Abstract
Au, Cu and bimetallic Au-Cu nanoparticles were synthesized on the surface of commercial TiO2 compounds (P25) by reduction of the metal precursors with tetrakis (hydroxymethyl) phosphonium chloride (THPC) (0.5 % in weight). The alloyed structure of Au-Cu NPs was confirmed by HAADF-STEM, EDS, HRTEM and XPS techniques. The photocatalytic properties of the modified TiO2 have been studied for phenol photodegradation in aqueous suspensions under UV-visible irradiation. The modification by the metal nanoparticles induces an increase in the photocatalytic activity. The highest photocatalytic activity is obtained with Au-Cu/TiO2 (Au/Cu 1:3). Their electronic properties have been studied by time resolved microwave conductivity (TRMC) to follow the charge-carrier dynamics. TRMC measurements show that the TiO2 modification with Au, Cu and Au-Cu nanoparticles plays a role in charge-carrier separations increasing the activity under UV-light. Indeed, the metal nanoparticles act as a sink for electron, decreasing the charge carrier recombination. The TRMC measurements show also that the bimetallic Au-Cu nanoparticles are more efficient in electron scavenging than the monometallic Au and Cu ones.
1 Introduction
Titania (titanium (IV) dioxide, TiO2) has been one of the most investigated photocatalysts during these last decades, due to its high photocatalytic activity, redox properties, thermal and photochemical stability and low cost. The limitation in its application, results from low quantum yield because of the fast charge carriers (e−/h+) recombination and the necessity to use UV irradiation. Indeed, TiO2 absorbs only 2–3 % of the solar light impinging on the Earth’s surface as it can be excited only under UV irradiation with wavelengths shorter than 400 nm. Moreover, as in most of semiconductors, a high rate of recombination between electrons and holes results into low quantum yield. In order to enhance the photocatalytic activity, modifications of crystalline TiO2 are, in general, involved.1–5
Surface modification with noble metal ions, such as platinum, palladium, silver and gold or metal clusters and nanoparticles (NPs)1,2,4,6–8 results in enhancements of the photo-conversion quantum yield and may allow the extension of the light absorption of wide band-gap semiconductors to the visible light. Noble metal-loaded titania photoreaction systems seem advantageous compared with other photosensitization systems using for example dye molecules, since noble metal deposits are relatively stable. Enhancement of the photoactivity originates from prolongation of charge carriers (photogenerated electrons and holes) lifetime since noble metals can act as an electron sink.9 Only a few studies report on modification of titania with bimetallic nanoparticles. Recently, improved photoactivity under visible light irradiation has been reported for modified titania with bimetallic silver-gold NPs prepared by microemulsion method.10
Bimetallic nanoparticles have attracted increasing attention because they exhibit new solid-state properties, which differ from their monometallic counterparts.11–13 Therefore, they have potential applications in various fields such as catalysis, electrocatalysis, sensing, magnetic storage… In particular, bimetallic nanoparticles based on gold have attracted increased attention because of their optical properties and their application in catalysis and electrocatalysis.14–19 Only a few studies report on synthesis, structure and properties of Au-Cu nanoparticles.20–24 Recently, it has been shown that Au–Cu bimetallic nanoparticles exhibit higher catalytic activities than monometallic gold catalysts, for both CO oxidation and PROX reactions.21,22 Bimetallic Au–Cu on TiO2 were found more active and selective towards propene epoxidation by nitrous oxide than monometallic Au or Cu samples supported on TiO2.23 Carbon electrodes modified by bimetallic Au-Cu NPs were found promising for electrocatalytic oxidation of glucose in alkaline solution.24
Here, we synthesized mono- and bimetallic Au and Cu nanoparticles by reduction of the metal precursors by tetrakis (hydroxymethyl) phosphonium chloride (THPC) followed by their deposition on TiO2. The modification of TiO2 by the metal NPs resulted in increase of the photocatalytic activity under UV-Visible light. The best photocatalytic activity was obtained with the bimetallic Au-Cu/TiO2.
2 Experimental
Materials
Titania (P25, Evonik, 50 m2.g−1, 80% Anatase, 20% Rutile) was used as support. HAuCl4•3H2O (Acros Chemicals) was used as gold precursor and CuCl2 (Rectapur) as copper precursor. Phenol (C6H5OH) and tetrakis (hydroxymethyl) phosphonium chloride (THPC, 80% in water) were respectively purchased from Fluka and Sigma-Adlrich. Deionized water (Milli Q with 18.6 MΩ) was used all through our experiments.
Photocatalysts Preparation
The monometallic gold catalysts (0.5 wt. % corresponding to 0.2 at. % of Au on TiO2) were prepared according to Duff and Baiker method.25,26 This preparation was based on the preparation of a gold sol, which was then deposited onto a support. In a beaker, 1.5 mL of NaOH solution (0.2 M, freshly prepared) was added to 45 mL of deionized water under vigorous stirring. After 5 minutes, 1 mL of tetrakis (hydroxymethy1) phosphonium chloride (THPC, 0.05 M) was added to the mixture followed by addition of 2.5 mL of HAuCl4 solution (10−2 M). THPC is used as reducing and stabilizing agent. A color change from transparent to brown was immediately observed indicating the reduction of AuIII into Au0 and the formation of Au NPs. 1 g of P25 support was then added to the mixed solution, which was maintained under vigorous stirring at room temperature during two hours. The solid was separated by centrifugation, washed with deionised water and centrifuged three times. The sample was then dried at 50 °C for 48 hours. The same procedure is also used to reduce CuII into Cu0 and to obtain Cu NPs which were deposited on P25.
For the bimetallic Au-Cu catalysts, the unique difference with the protocol of synthesis of the monometallic Au catalysts was that gold and copper were simultaneously introduced, the total metal mass percentage (mass of the metal/mass of the TiO2) was kept at 0.5 wt. % for the mono- and bimetallic photocatalysts. The compositions of the synthesized photocatalysts are listed in Table 1.
Table 1.
Summary of the modified photocatalysts prepared by chemical method with THPC.
| Photocatalyst | Molar Ratio of Au/Cu | Content of metal precursor/P25 (wt.%/at.%) | Color | aTEM size (nm) | ||
|---|---|---|---|---|---|---|
| Au | Cu | bbefore | cafter | |||
| Au/P25 | 1:0 | 0.5/0.20 | 0/0 | violet | 3.1 | 6.9 |
| AuCu1:1/P25 | 1:1 | 0.38/0.15 | 0.12/0.15 | light-violet | 3.9 | 5.2 |
| AuCu1:3/P25 | 1:3 | 0.25/0.10 | 0.25/0.30 | grey-violet | 2.9 | 4.8 |
| Cu/P25 | 0:1 | 0/0 | 0.5/0.60 | light-green | N/A | N/A |
TEM size: this was measured manually with a program (Nano measurement);
before: the prepared samples were before thermal treatment;
after: the prepared samples were thermal treated.
After drying, all the samples were stored in dark. The Au, Cu, and Au-Cu modified TiO2 samples were calcinated under air at 500 °C with a heating rate of 5 °C·min−1 then a plateau of 15 min. The samples were then reduced again under H2 at 500 °C (~100 mg of catalyst under 100 mL·min−1), with a plateau of 15 min. After reduction, the samples were cooled down to room temperature under N2 flow, and transferred in air before characterization.
Characterization Techniques
For transmission electron microscopy (TEM) observations, the suspensions containing modified TiO2 were first sonicated for a few minutes then a few drops of the suspension were deposited on copper coated carbon grids. TEM experiments were performed on a JEOL JEM 100 CXII transmission electron microscope at an accelerating voltage of 100 kV. For high resolution electron microscopy (HRTEM) images we used a JEOL JEM 2010 equipped with a LaB6 filament and operating at 200 kV. The images were collected with a 4008 × 2672 pixels CCD camera (Gatan Orius SC1000).
The samples were also analyzed by scanning transmission electron microscopy (STEM) using a JEOL ARM (200F): 200 kV FEGSTEM/TEM equipped with a CEOS Cs corrector on the illumination system. The probe current used for acquiring the high-angle annular dark field (HAADF)- and the bright field (BF)-STEM images was 9C (23.2 pA); the condenser lens aperture size was 40 µm. HAADF-STEM images were acquired with a camera length of 8 cm/6 cm and the collection angle of 68–280 mrad/90–270 mrad. The BF-STEM images were obtained using a 3 mm/1mm aperture and a collection angle of 17 mrad/5.6 mrad (camera length in this case was 8 cm). The HAADF as well as the BF images were acquired using a digiscan camera. EDS measurements for line scan profiles as well chemical maps for the various elements were obtained with a solid state detector and software for two dimensional mapping from EDAX.
The diffusion reflectance spectra (DRS) of the modified TiO2 samples were obtained using Cary 5E spectrophotometer equipped with Cary 4/5 diffuse reflection sphere. The baseline was recorded using a poly(tetrafluoroethylene) reference. The X-ray photoelectron spectroscopy (XPS) analysis was performed on In foils. Sample drops were deposited on the foils and dried under N2 flow. The XPS analyzer was a Thermo Electron ESCALAB 220i-XL. Either a non-monochromatic or a monochromatic X-ray Al Kα line was used for excitation. The photoelectrons were detected perpendicularly to the support. A constant analyzer energy mode was used with pass energy of 20 eV. Element atomic percentage determinations were performed using peak area corrected by sensitivity factors using the Thermo Avantage data base. Fitting procedures were also performed using the Thermo Avantage Program.
The charge-carrier lifetimes in TiO2 after UV illumination were determined by microwave absorption experiments using the Time Resolved Microwave Conductivity method (TRMC).27,28 The principle of TRMC and the experimental set-up have been widely described in previous papers. The incident microwaves were generated by a Gunn diode of the Ka band at 30 GHz). Pulsed light source was a Nd:YAG laser providing an IR radiation at λ = 1064 nm. Full width at half-maximum of one pulse was 7 ns, repetition frequency of the pulses was 10 Hz. UV light (355 nm) was obtained by tripling the IR radiation. Visible light (532 nm) was obtained by doubling it. The light energy density received by the sample was 0,8 mJ·cm−2. The TRMC technique is based on the measurement of the change of the microwave power reflected by a sample, ΔP(t), induced by its laser pulsed illumination. The relative difference ΔP(t)/P can be correlated, for small perturbations of conductivity, to the difference of conductivity Δσ(t) considering the following equation:
| (Eq. 1) |
where Δni(t) is the number of excess charge-carriers i at time t and μi their mobility. The sensitivity factor A is independent of time, but depends on different factors such as the microwave frequency or the dielectric constant.
Considering that the trapped species have a small mobility which can be neglected, Δni is reduced to mobile electrons in the conduction band and holes in the valence band. In the specific case of TiO2, the TRMC signal can be attributed to electrons because their mobility is much larger than that of the holes.29
Photocatalytic Tests
The photocatalytic activity under UV-visible illumination of the synthesized catalysts has been tested by photodecomposition of phenol (C6H5OH) in water. The photodegradation reaction of phenol at 2×10⁻⁴ M was carried out in a 10 mm optical path quartz cell reactor containing 3.5 mL of a model solution with a concentration of 1 g/L of photocatalyst. The suspension of the photocatalyst in phenol solution was sonicated for 30 seconds to smash the powders into tiny particles then magnetically stirred for 10 minutes in the dark to ensure the equilibrium between adsorption and desorption prior to irradiation. Then, the suspension was irradiated for 10 min with an Oriel 300 W xenon lamp (under UV-visible light) and bubbled with O2 at fixed flow rate along with magnetic stirring. 0.5 mL of aliquot was sampled from the reactor at different time point and was centrifuged to separate the catalyst to get transparent solution. HPLC was used to determine the concentration decrease of phenol and to study its degradation.
Varian Prostar 230 ternary gradient pump combined with a Prostar 330 photodiode array detector (D2 lamp), by a method developed in our laboratory. For elution, an isocratic mobile phase consisting of 75 % H2O and 25 % acetonytrile (ACN), at a 1 mL·min−1 flow rate, was used, with a detection at 270 nm. The column was Adsorbosphere C18 reverse phase (5µm, l: 150 mm, ID: 4.6 mm, Alltech) combined with All-Guard cartridge systemTM (7.5 × 4.6 mm, Alltech). For data acquisition, Star software was used.
For the photodegradation of rhodamine B (RhB), the conditions were the same except that the initial concentration of RhB was 10−4 M. RhB solutions were characterized using a HP Agilent diode array 8453 UV-Visible spectrophotometer
3 Results and Discussion
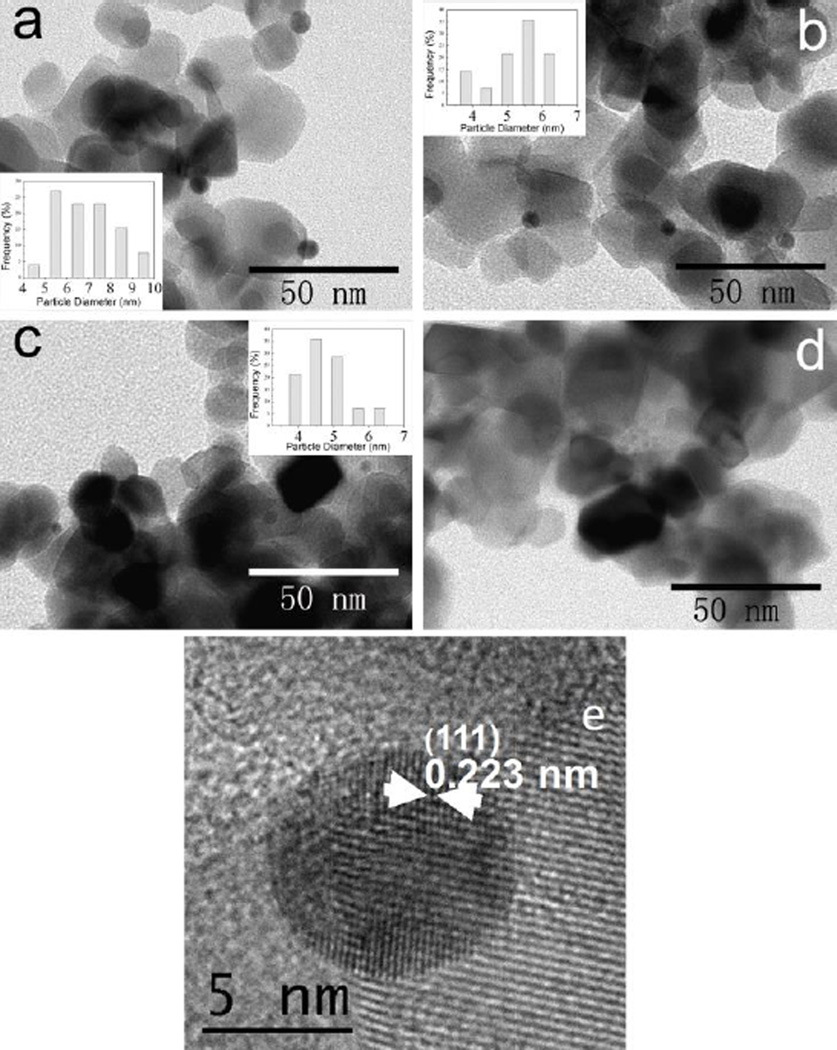
The modified photocatalysts Au/TiO2, Cu/TiO2, and Au-Cu/TiO2 were respectively violet, light-green and grey-violet. TEM observations show small nanoparticles homogenously dispersed on the surface of P25 (Fig. 1).
Fig. 1.
TEM (a, b, c and d) and HRTEM (e) images of the prepared photocatalysts P25 modified with nanoparticles. (a) Au/ P25, (b and e) AuCu1:1/P25, (c) AuCu1:3/P25, and (d) Cu/P25. The nominal mass percentages of metallic nanoparticles to P25 for the above catalysts are kept at 0.5%
Calcination (used to remove the THPC residue) and hydrogen treatment (used for further reduction) induces only a very small change in NPs size (increase by less than 2 nm for the mean size). The mean particle size slightly decreased (after calcinations and H2 treatment) from 6.9 nm (for pure gold NPs) to 4.8 nm (for Au/Cu 1:3 NPs) when gold is associated to Cu. In the latter case, smaller NPs and more homogeneous in size were obtained (see Fig. 1 and Fig. S1). It has been reported that the size of alloy Au-Cu particles decreases as the amount of copper in the NPs increased.10,12 In case of Cu on TiO2, we did not observe any metal particle on the support, probably because of their small size and the small contrast between Cu and titania.
HRTEM observations were also performed on bimetallic Au-Cu NPs on TiO2. A representative HRTEM image of the AuCu1:1/P25 NPs is shown in Fig. 1e. The d spacings measured on different nanoparticles were found in the range of 0.223 – 0.229 nm, lying between the d spacings of monometallic Au (0.235 nm) and Cu (0.208 nm). According to the Vegard’s law we could expect for a ratio Au/Cu 1:1, a value of 0.2215 nm for the (111) lattice planes. The measured d spacings might indicate the formation of Au/Cu 1:1 alloy nanoparticles, with a small fluctuating composition. Note however that the Vegard’s law is not necessarily followed by nanoalloys.
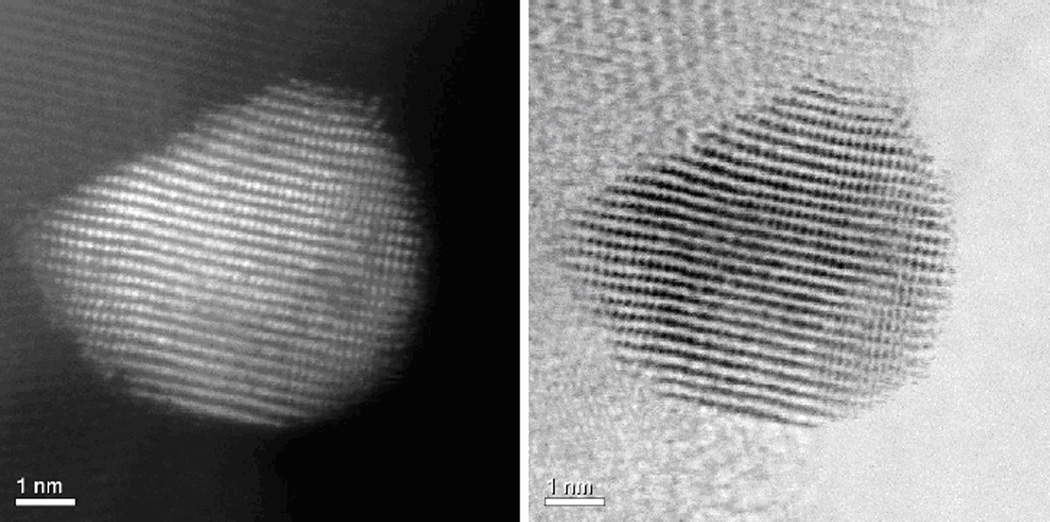
HAADF-STEM images of the NPs show that they are composed by an alloy of Au-Cu. Fig. 2 shows the atomic composition in a Au-Cu NP. The contrast is roughly proportional to Z2 where Z is the atomic number. Therefore due to the difference of the atomic number of Au and Cu the contrast is easy to see. Every spot in the image of Fig. 2 corresponds to an atomic column. The bright spots correspond therefore to columns richer in Au and the lighter spots to columns richer in Cu. We found that the nominal composition of the sample (Au/Cu = 1:1) is roughly followed in the images.
Fig.2.
HAADF-STEM (left) and BF-STEM (right) images of AuCu11P25.
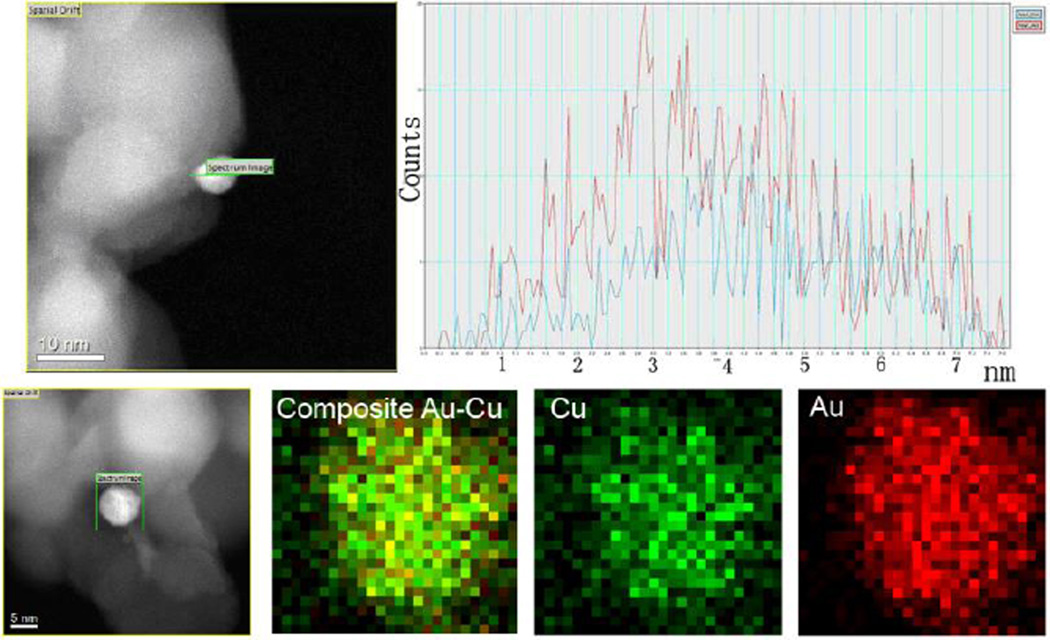
The composition of the modified Au-Cu nanoparticles was determined by STEM- Electron dispersive X-ray spectroscopy (EDS). Different NPs were analyzed and the profile spectra across the different individual NPs were taken (Fig. 3 and Fig. S2). The Au and the Cu line scan signals (Fig. 3, right), showed clearly the same intensity along the different regions of the NPs. The HAADF-STEM images of AuCu1:1/P25 indicate the bimetallic nanoparticle deposited on the surface of TiO2 (Fig. 3, left): both of the Au-L and Cu-K peaks demonstrate that the Au and Cu atoms apparently homogeneously dispersed. Therefore, the EDS line scans evidenced the Au-Cu bimetallic nanoparticles have an alloyed structure.
Fig. 3.
Top. Energy dispersive X-ray spectroscopy line scans across a nanoparticle of AuCu1:1/P25 (The profile was taken along the green line, the blue line corresponds to CuK and the red one to AuL signal) and corresponding STEM images for the samples. Bottom. Mapping EDS analysis performed at a nanoparticle of AuCu1:1/P25 (left).
We have also carried out EDAX elemental mapping for the respective elements, Fig. 3 (bottom) shows chemical maps for Au–Cu bimetallic NPs. Au (K, M) and Cu (K, L) maps clearly revealed the presence of the bimetallic Au-Cu alloys (composite image).
The informations obtained from high resolution TEM images, HAADF-STEM and EDS analysis of the individual NPs confirm the formation of bimetallic alloyed Au-Cu NPs.
XPS analysis which is performed under 400 µm spot size probes a large number of particles layered onto the holder. It is a statistical measurement that provides the global response of a large number of nanoparticles. It is a complementary information of the other ones issued from local approaches. Obviously XPS demonstrates homogeneity of the preparations because signals for different layering of NPs on substrates are very reproducible in global chemical composition as in energy distribution whatever the core level investigated. Different preparation of Au/Cu-P25 TiO2 NPs have been investigated. For each preparation XPS observed expected responses: Au, Ti, O core levels for Au/P25 NPs; Au, Cu, Ti, O core levels for Au/Cu/P25 NPs; Cu, Ti, O core levels for Cu/P25 NPs. Using atomic % determination for each element, we observed specific ratio ((% Au or % Au+ % Cu or % Cu) /(% Ti + %O)), which characterized the “metallic NPs/P25_TiO2” networks and reflected the relative dispersion for both component after calcinations under air then reduction under H2 at 500 °C. Again the different ratios are rather reproducible indicating the homogeneity of the dispersions. Typical values are given in table 2. An interesting feature concerns the Cu/P25_TiO2 NPs for which we detected easily both Cu and TiO2 signals demonstrating the presence of Cu NPs on TiO2 particles, which was very difficult to observe by electron microscopy.
Table 2.
Specific atomic ratio deduced from the XPS spectra for the samples Cu/P25, Au/P25, AuCu1:3/P25, AuCu1:1/P25 (after calcination under air followed by reduction under H2 at 500 °C).
| Sample | (%Au + %Cu)/ (%Ti +%O) |
%Au/% Cu |
|---|---|---|
| Au/P25 | 0.0014 | *** |
| AuCu1:1/P25 | 0.003 | 0.7 |
| AuCu1:3/P25 | 0.0062 | 0.14 |
| Cu/P25 | 0.0093 | *** |
Another, important information deduced from XPS concerns the chemical state of the different metallic or bimetallic particles. It is clear that Au4f7/2 core levels present their BE in the range 83.0–83.5 eV, so slightly negatively shifted compared to standard bare Au (84 eV) (see Fig S3). For Au signal, we can consider that the position range is in agreement with Au(0) chemical state but with a specific low BE position which has been already reported in the literature.23,24 This shift can reflect the strong interaction of gold-based NPs with TiO2 changing its electronic environment. Concerning Cu2p3/2 core levels the BE positions are in the range of 932.5 – 933.0 eV (see Fig S4). The copper position range is in agreement with Cu(0) chemical state; This is comforted by the lack of satellite excluding any Cu(II) contribution. The XPS data on Cu confirms the stabilization of very small Cu(0) clusters by TiO2. The interest of the comparison between metallic and bimetallic systems is that the energy reparation for each element can be considered as the same.
So the global characterization performed by XPS agrees with the local ones, that means that bimetallic NPs supported on P25 TiO2 can be considered as homogeneously distributed.
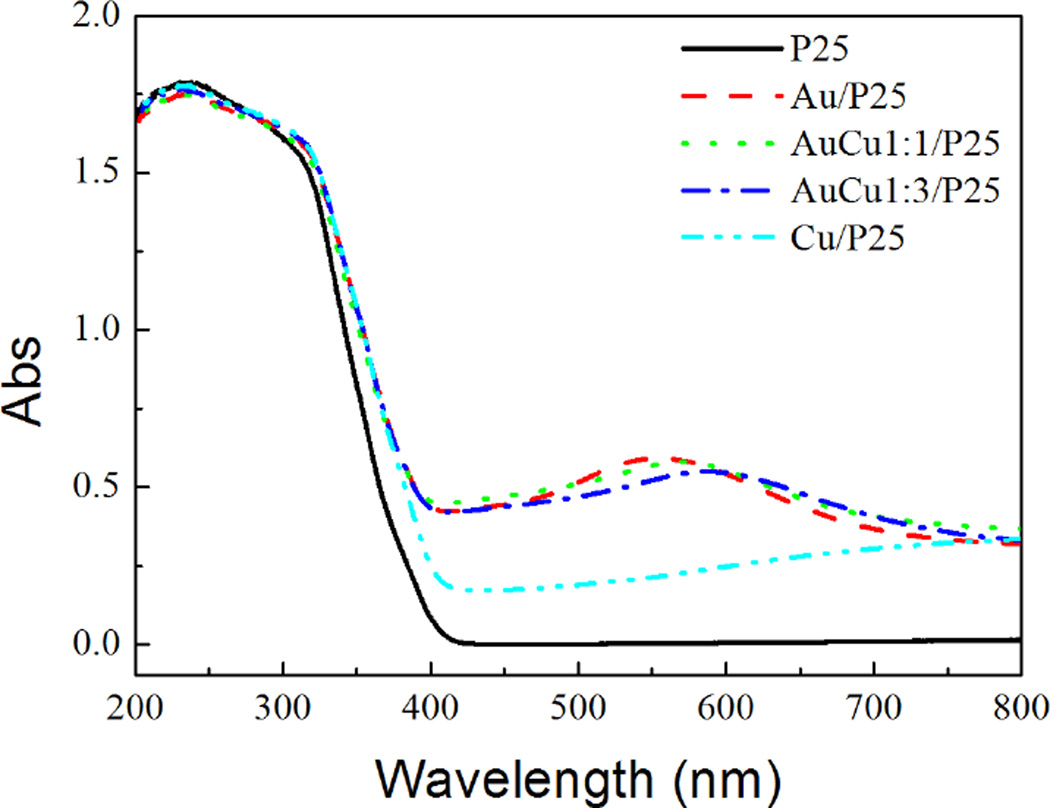
The optical properties of the modified TiO2 have been studied in details by Diffuse Reflectance Spectroscopy (DRS). Fig. 4 shows the spectra of pure and modified TiO2.
Fig. 4.
Diffuse Reflectance Spectra of pure and modified P25 photocatalysts.
It should also be pointed out that the DRS of the modified samples show a slight shift in the band-gap transition to longer wavelengths for all kinds of surface-modified photocatalysts. This effect was previously observed with Pt- and Ag- modified TiO2.4,8 This can be attributed to a stronger stabilization of the conduction band of TiO2 by the interaction with the Au-Cu NPs compared to the stabilization of the valence band. The absorbance in the visible region is always higher for the modified than for pure TiO2. Note that wide absorptions with maxima at 550 and 750 nm are obtained respectively with Au- and Cu-modified P25 (Fig. 4). Au-Cu modified P25, absorb in the visible with maxima respectively at 580 and 600 nm for AuCu1:1/P25 and AuCu1:3/P25. These absorptions result in pink or violet colors of the modified TiO2 samples. Au and Cu nanoparticles are known to exhibit a plasmon band with a maximum at around 520 nm and 570 nm in water. This plasmon band is sensitive to the environment and can be shifted depending on the stabilizer or on the substrate. Because of the coupling between the metal nanoparticles and TiO2 support having a high reflective index (the absorption coefficient and refractive index are for anatase phase 90 cm−1 and 2.19 at a wavelength of 380 nm, respectively), the plasmon bands in case of Au/TiO2 and Au-Cu/TiO2 are red-shifted. However in case of Cu/TiO2, the metal nanoclusters are very small and the wide absorption band in the visible and near infra-red region observed in this case could be due to inter-band transitions in the Cu clusters deposited on different phases and sites of TiO2 and with strong interaction with the support.
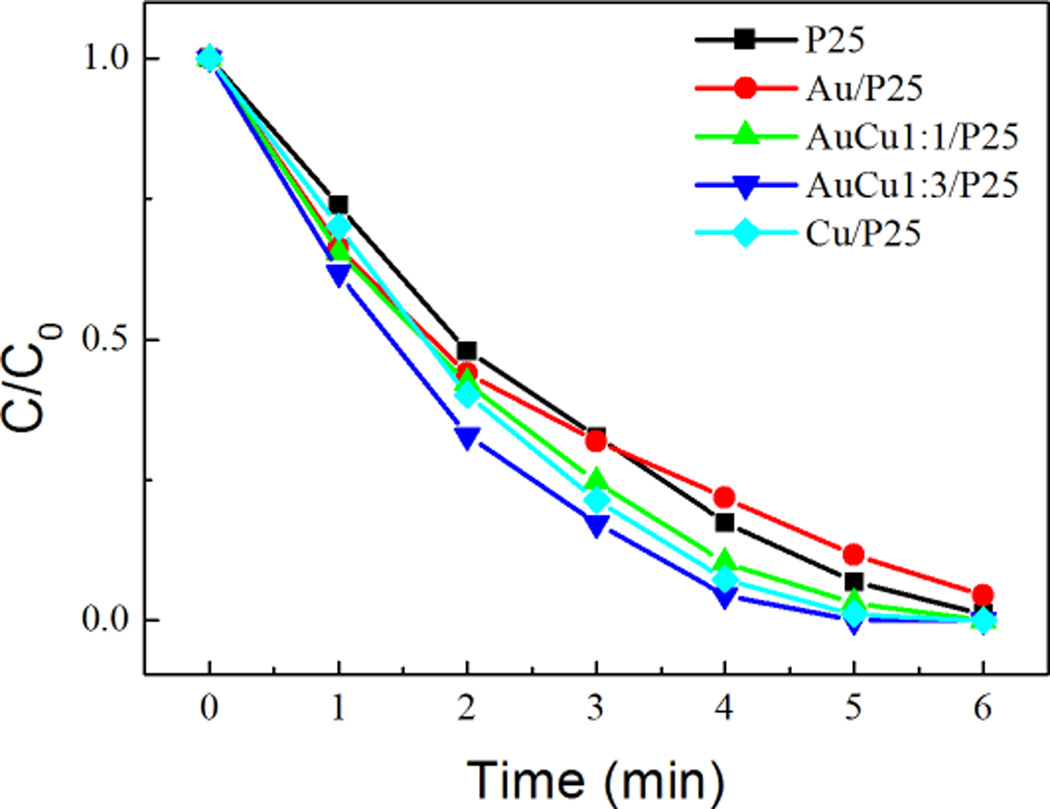
Evonik P25 is highly photoactive for phenol degradation under UV-Vis light. The degradation of phenol is studied by HPLC. After 3 min of irradiation, 60 % of phenol was degraded (Fig. 5).
Fig. 5.
Photodegradation of phenol under UV illumination by pure and modified P25 photocatalysts.
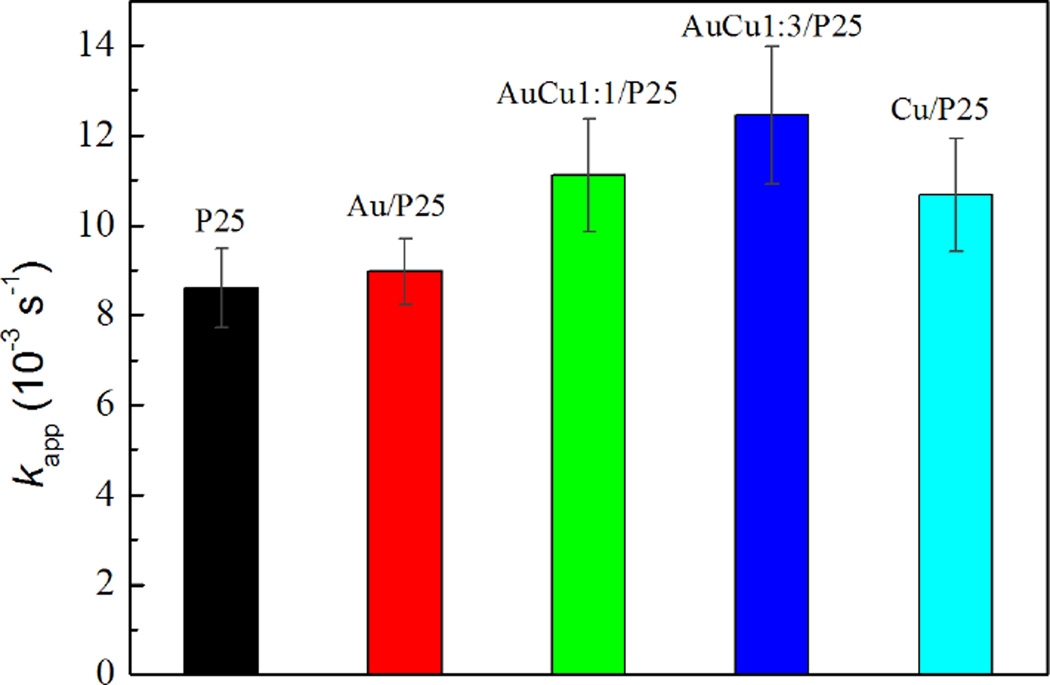
The degradation is faster with modified P25, the faster degradation was obtained with Au-Cu-modified (Au/Cu 1:3) P25: 80 % of the phenol was degraded after 3 min (Fig.5). The apparent rate constants of the first-order kinetic of phenol photodegradation for the bare- and modified- TiO2 are shown in Fig. 6. Surprisingly, modification with Cu leads to better enhancement in the photocatalytic properties compared to modification with Au. Modification of P25 by Au-Cu NPs induces the highest enhancement in the photocatalytic properties. The best photacatalyst being the Au-Cu/P25 with Au/Cu 1:3. The details on kinetics degradation of phenol and characterisation of degradation products by HPLC are shown in supplementary information (Fig. S5–S9, Table S1). Photocatalytic tests on the Au- and/or Cu- modified P25 were also carried out for degradation of RhB under UV light. The time courses of RhB concentration and histogram of rate constants are shown in Fig. S10. The results are well coincident with those obtained for phenol photodegradation. Modification of P25 with monometallic Cu NPs induces a better improvement of the photocatalytic activity compared to the modification with Au NPs. Bimetallic Au-Cu NPs modified photocatalyst with Au/Cu 1:3 showed the highest photoactivity.
Fig. 6.
Rate constants of the first-order kinetics of phenol photodegradation by pure and modified P25 photocatalysts under UV-Visible illumination.
Photocatalytic tests have been conducted under visible light. In that case, no improvement of the photocatalytic activity of modified titania was observed.
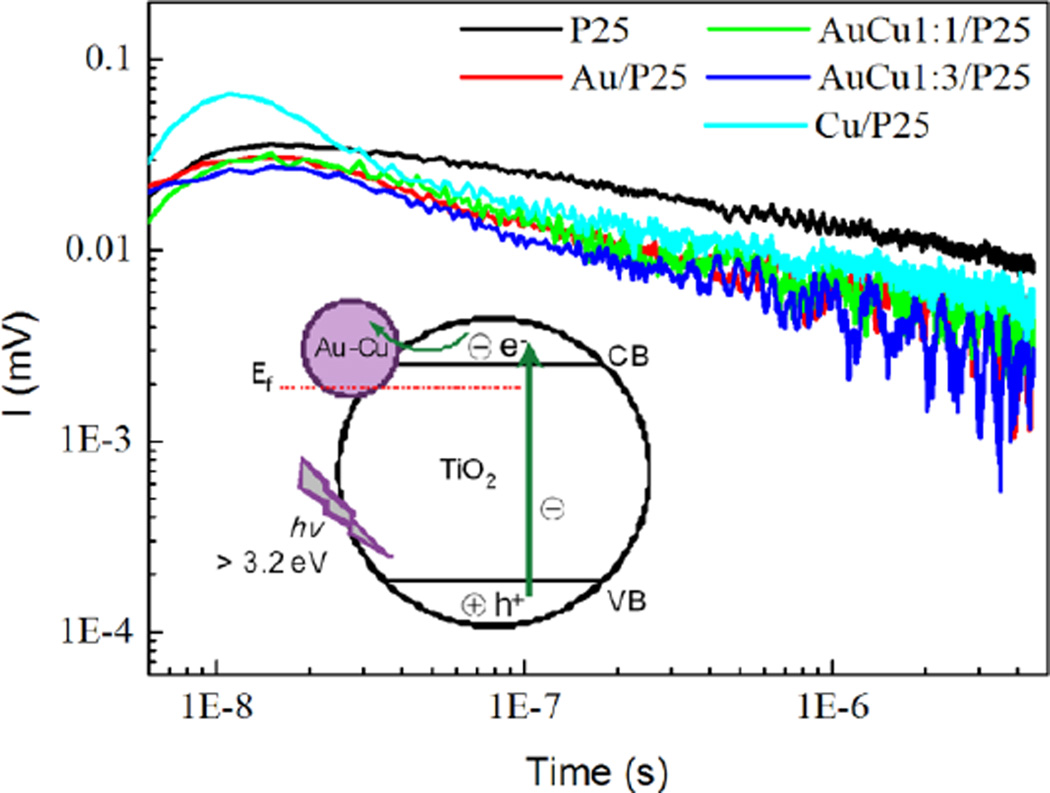
Time Resolved Microwave Conductivity (TRMC) experiments were conducted to study the charge carrier dynamics. TRMC signals obtained under UV illumination are shown in Fig. 7. The surface modification with Au, Cu and Au-Cu NPs shows a strong influence on the charge-carrier decay of P25. This influence on the decay can be related to the activity in the case of phenol and RhB degradation under UV light.
Fig. 7.
Time Resolved Microwave Conductivity signals of modified P25 photocatalysts prepared by the chemical method with THPC. Inset: scheme depicting the electron scavenging and transfer on Au-Cu modified TiO2 surface after the absorption of UVphotons
The modification with Au, Cu and Au-Cu NPs accelerates the overall decay of the signal for all the modified TiO2 compounds. As shown previously, the modification by these nanoparticles causes an increase in the photocatalytic activity of P25. The TRMC signal is mainly related to the electron mobility. The decrease of the TRMC signal is then probably due to efficient electron scavenging by the nanoparticles deposited on TiO2 diminishing the number of mobile electrons. It implies a decrease of the charge-carrier recombination that is beneficial to the photoactivity. It has to be noted that the acceleration of the decay is faster for P25 modified with bimetallic NPs (Fig. 7). This acceleration has also been observed for the modification of TiO2 with Ag clusters.4 It is different from our previous observations made with Pt and Pd modified TiO2, where a slowdown of the overall decay was observed.7,8 Indeed, contrary to metals such as Pt and Pd which provide an ohmic contact, metals such as Ag, Au and Cu exhibit capacitive properties. The TRMC measurements show that bimetallic Au-Cu nanoparticles are very efficient in electron scavenging.
Furthermore, the modification with copper nanoparticles increases the initial TRMC signal intensity in the case of Cu/P25 (Fig. 7). This indicates that more electrons are produced under UV-illumination in the conduction band of Cu-modified P25. These excess electrons could be due to the electrons injected in the conduction band of TiO2 after excitation of the copper nanoparticles which are more easily oxidized.
At 532 nm (the second excitation wavelength of the laser), there are no TRMC signal with all the samples. Under excitation in the visible, there is no direct light absorption of pure TiO2 but the metal NPs deposited on modified titania (Au and Au-Cu) are absorbing light through their plasmon, and in case of Cu/TiO2 excited state of the Cu nanoclusters could be reached. Since no TRMC signal is observed at this excitation wavelength, one can conclude that no electron transfer from the NPs and nanoclusters to the conduction band of TiO2 occurs. This is consistent with the photocatalytic results under visible light.
Further experiments will be conducted to optimize the Au/Cu ratio and to try to modify the size of the Au-Cu NPs and to also optimize their interaction with TiO2 in the aim to improve the photocatalytic activity of the modified titania for applications under solar light.
4 Conclusions
Small Au, Cu and bimetallic Au-Cu nanoparticles homogeneous in size were synthesized on P25 TiO2 by the THPC method. HRTEM, HAADF-STEM, EDS and XPS have demonstrated the alloyed structure of the Au-Cu NPs. Titania surface modification with Au, Cu and bimetallic Au-Cu NPs enables the increase of the photocatalytic activity under UV-visible irradiation. We have found that very small amount of metal (0.5% wt.) can activate titania for photocatalytic applications, thus the costs of photocatalyst preparation are relatively low. TRMC measurements show that under UV irradiation Au, Cu and Au-Cu NPs act as electron scavengers hindering charge recombination in modified P25. The modification of titania by Cu nanoclusters induces a larger enhancement in the photocatalytic activity compared with its modification with Au NPs. The highest photocatalytic activity is obtained with P25 modified with Au/Cu 1:3. TRMC signals show that bimetallic nanoparticles are better electron scavengers than Cu and Au NPs. These bimetallic NPs can also have applications in catalysis and electrocatalysis.
Supplementary Material
Acknowledgments
The authors thank Laurent Delannoy (LRS, UPMC, Paris, France) for the thermal treatment of the samples. C’nano - Ile de France and the RTRA Triangle de la Physique are acknowledged for their financial support with the TRMC setup. The authors would also like to acknowledge the Welch Foundation Agency Project # AX-1615, the NSF for grants PREM 0934218 and Grant 1103730 “Alloys at the Nanoscale; The Case of Nanoparticles Second Phase” and to the National Institute on Minority Health and Health Disparities for the grant (G12MD007591) from NIH.
Footnotes
Electronic Supplementary Information (ESI) available: EDS, XPS, degradation of phenol and rhodamine B and rate constants. See DOI: 10.1039/b000000x/
References
- 1.Kamat PV. J. Phys. Chem. C. 2007;111:2834. [Google Scholar]
- 2.Zaleska A. Curr. Patent. Eng. 2008;2:157. [Google Scholar]
- 3.Dozzi MV, Chiarello GL, Selli E. J. Adv. Oxid. Technol. 2010;13:305. [Google Scholar]
- 4.Grabowska E, Zaleska A, Sorgues S, Kunst M, Etcheberry A, Colbeau-Justin C, Remita H. J. Phys. Chem. C. 2013;117:1955. [Google Scholar]
- 5.Daghrir R, Drogui P, Robert D. Ind. Eng. Chem. Res. 2013;52:3581. [Google Scholar]
- 6.Linic S, Christopher P, Ingram DB. Nature Mater. 2011;10:911. doi: 10.1038/nmat3151. [DOI] [PubMed] [Google Scholar]
- 7.Tahiri Alaoui O, Herissan A, Le Quoc C, Zekri M, Sorgues S, Remita H, Colbeau-Justin C. J. Photochem. Photobiol. A. 2012;242:34. [Google Scholar]
- 8.Kowalska E, Remita H, Colbeau-Justin C, Hupka J, Belloni J. J. Phys. Chem. C. 2008;112:1124. [Google Scholar]
- 9.Kamat PV. J. Phys. Chem. B. 2002;106:7729. [Google Scholar]
- 10.Zielinska-Jurek A, Kowalska E, Sobczak JW, Lisowski W, Ohtani B, Zaleska A. Appl. Catal. B. 2011;101:504. [Google Scholar]
- 11.Wang D, Villa A, Porta F, Prati L, Su D. J. Phys. Chem. C. 2008;112:8617. [Google Scholar]
- 12.Lehoux A, Ramos L, Beaunier P, Uribe DB, Dieudonne P, Audonnet F, Etcheberry A, Jose-Yacaman M, Remita H. Adv. Funct. Mater. 2012;22:4900. [Google Scholar]
- 13.Singh AK, Xu Q. Chem Cat Chem. 2013;5:652. [Google Scholar]
- 14.Doherty RP, Krafft J-M, Methivier C, Casale S, Remita H, Louis C, Thomas C. J. Catal. 2012;287:102. [Google Scholar]
- 15.Hugon A, Delannoy L, Krafft J-M, Louis C. J. Phys. Chem. C. 2010;114:10823. [Google Scholar]
- 16.Mirdamadi-Esfahani M, Mostafavi M, Keita B, Nadjo L, Kooyman P, Remita H. Gold Bull. 2010;43:49. [Google Scholar]
- 17.Sandoval A, Aguilar A, Louis C, Traverse A, Zanella R. J. Catal. 2011;281:40. [Google Scholar]
- 18.Redjala T, Remita H, Apostolescu G, Mostafavi M, Thomazeau C, Uzio D. Gas Oil Sci. Technol. 2006;61:789. [Google Scholar]
- 19.Ksar F, Ramos L, Keita B, Nadjo L, Beaunier P, Remita H. Chem. Mater. 2009;21:3677. [Google Scholar]
- 20.Rodriguez-Lopez JL, Montejano-Carrizales JM, Jose-Yacaman M. Appl. Surf. Sci. 2003;219:56. [Google Scholar]
- 21.Liu XY, Wang AQ, Li L, Zhang T, Mou CY, Lee JF. J. Catal. 2011;278:288. [Google Scholar]
- 22.Liu XY, Wang AQ, Zhang T, Su DS, Mou CY. Catal. Today. 2011;160:103. [Google Scholar]
- 23.Chimentao RJ, Medina F, Fierro JLG, Llorca J, Sueiras JE, Cesteros Y, Salagre P. J. Mol. Catal. A: Chem. 2007;274:159. [Google Scholar]
- 24.Tominaga M, Taema Y, Taniguchi I. J. Electroanal. Chem. 2008;624:1. [Google Scholar]
- 25.Duff DG, Baiker A. Langmuir. 1993;9:2301. [Google Scholar]
- 26.Duff DG, Baiker A, Edwards PP. J. Chem. Soc., Chem. Commun. 1993:96. [Google Scholar]
- 27.Colbeau-Justin C, Kunst M, Huguenin D. J. Mater. Sci. 2003;38:2429. [Google Scholar]
- 28.Kunst M, Goubard F, Colbeau-Justin C, Wunsch F. Mater. Sci. Eng. C. 2007;27:1061. [Google Scholar]
- 29.Fonash SJ. Solar cell device physics. New York, London: Academic Press; 1981. [Google Scholar]
Associated Data
This section collects any data citations, data availability statements, or supplementary materials included in this article.


