

Abstract
Introduction: Northern Ontario is a region in Canada with approximately 775,000 people in communities scattered across 803,000 km2. The Ontario Telemedicine Network (OTN) facilitates access to medical care in areas that are often underserved. We assessed how OTN utilization differed throughout the province. Materials and Methods: We used OTN medical service utilization data collected through the Ontario Health Insurance Plan and provided by the Ministry of Health and Long Term Care. Using census subdivisions grouped by Northern and Southern Ontario as well as urban and rural areas, we calculated utilization rates per fiscal year and total from 2008/2009 to 2013/2014. We also used billing codes to calculate utilization by therapeutic area of care. Results: There were 652,337 OTN patient visits in Ontario from 2008/2009 to 2013/2014. Median annual utilization rates per 1,000 people were higher in northern areas (rural, 52.0; urban, 32.1) than in southern areas (rural, 6.1; urban, 3.1). The majority of usage in Ontario was in mental health and addictions (61.8%). Utilization in other areas of care such as surgery, oncology, and internal medicine was highest in the rural north, whereas primary care use was highest in the urban south. Conclusions: Utilization was higher and therapeutic areas of care were more diverse in rural Northern Ontario than in other parts of the province. Utilization was also higher in urban Northern Ontario than in Southern Ontario. This suggests that telemedicine is being used to improve access to medical care services, especially in sparsely populated regions of the province.
Key words: : health services accessibility, medically underserved area, telemedicine, telehealth, rural health services, Canada
Introduction
Telemedicine can improve access to health and medical care services, especially in sparsely populated and less developed regions, by bridging the geographic distance between patients and service providers. However, providing access does not mean that the services will be used, or used to capacity.1 Our objective was to examine telemedicine use in the Province of Ontario, Canada, with a focus on traditionally underserved areas such as rural and Northern Ontario.
Northern Ontario is sparsely populated, with 88% of the province's area but only 6% of the population.2 Approximately 34% of Northern Ontario's population resides in rural areas, compared with 11% of Ontario as a whole.3 Although Southern Ontario's rural areas are connected to an extensive road network, many of the small communities in the north are accessible only by train, airplane, or winter (ice) road. This creates different contexts for healthcare service delivery in rural versus urban areas in different regions of the province.
Northern and rural regions of the province are often medically underserved. Although most people in Canada are within 5 km of a physician, some rural residents are more than 100 km from the closest physician.4 Only 16% of Canadian family physicians and 2.4% of specialists were located in rural and small-town Canada, compared with 21.1% of the Canadian population.4 In Ontario, only 6% of physicians practice in Northern Ontario, and 71% of these Northern Ontario physicians practice in urban areas.5
The Ontario Telemedicine Network (OTN) is a not-for-profit organization funded by the Ontario Ministry of Health and Long Term Care (MOHLTC). OTN uses technology to connect patients and providers throughout Ontario.6 OTN, the largest telemedicine service provider in Canada7 and one of the largest in the world,8 has 2,026 OTN sites across Ontario. One-quarter of OTN sites are in Northern Ontario (n = 552), and half of those (n = 286) are located in the rural parts of the north.9
There is limited research on telemedicine use in Ontario. OTN usage rates in Ontario ranged from 9 to 22 sessions per 1,000 from 2010 to 2014.7 Per capita rates for Ontario exceed all provinces except Newfoundland and Labrador and the Territories, areas that are sparsely populated. However, these studies do not differentiate between utilization in urban and rural parts of the province. In a study on the uptake of telemental health services in the province of Alberta, utilization rates were lowest in urban centers where residents had access to more healthcare services that were provided in-person.11 Australia researchers report that 75% of telemental health patients reside in rural or remote locations.12 In the United States, patients living further from the clinic were more likely to seek electronic visits for selected primary care services.13 These studies demonstrate the uptake of telemedicine in rural areas.
Health service organizations in rural areas were more likely to use telemedicine than those in urban areas. A survey on telemedicine in Western Australia found a significant positive correlation between distance to Perth, the major urban center in the area, and the number of telehealth services received.14 Telemedicine in Newfoundland and Labrador was developed exclusively for people in remote communities; in 2008, there were 3 specialist sites in St. John's (the capital of Newfoundland and Labrador) and 28 remote sites where patients could connect to specialists in St. John's.15
OTN is an exemplar of how telemedicine can provide an extensive range of medical services over large geographic areas with services that are integrated and incentivized within existing physician payment models. In this article we use medical service billing data to compare the number and type of clinical telemedicine utilization in four regions of Ontario, categorized as urban Southern Ontario, rural Southern Ontario, urban Northern Ontario, and rural Northern Ontario. This study provides insights into the uptake of virtual medical care in medically underserved communities and regions.
Materials and Methods
This research is part of a multiphase research program funded by the Ontario MOHLTC designed to better understand how OTN is being used in Ontario in order to improve access to healthcare services in underserved communities. Data from the MOHLTC were obtained under a data sharing agreement. Although the research described in this article was exempt, ethics approval was obtained from Laurentian University's Research Ethics Board for the broader research program.
We used OTN-flagged medical service utilization data collected through the Ontario Health Insurance Plan (OHIP) and shared by the MOHLTC. These data may slightly underestimate the total number of events, as billing records may not capture visits with physicians who use alternative payment programs or who are salaried. However, billing records do capture the vast majority of virtual care services as the majority of physicians are paid fee-for-service for telemedicine consultations. Records included patient and physician geographic location (residence code), month and year of visit, and type of medical visit (billing code) for the 2008/2009 to 2013/2014 fiscal years. We matched patients' residence codes to Statistics Canada's Census Subdivisions (CSDs) and calculated utilization per 1,000 people for each CSD by fiscal year using 2011 census population data. We grouped CSDs as Northern or Southern Ontario, using the boundaries of the Northeast and Northwest Local Health Integration Networks16 and as urban or rural using Statistics Canada's Statistical Area Classification system.17
In 2011, there were 574 CSDs in Ontario with 279 in Northern Ontario. The OHIP-derived utilization rates for CSDs classified as First Nations were very low, even though we knew that these sites were used frequently.18 Aboriginal people who are registered under the Indian Act and receive care on Reserves have most of their medical service use billed to Health Canada (a federal agency) and are not included in provincial OHIP data.19 CSDs classified as First Nations and those with a population of under 50 were removed (n = 148), leaving 426 CSDs for analysis.
Each OTN visit generated two or more distinct OHIP codes: at least one health service code along with one telemedicine premium code. We used telemedicine premium codes20 to identify individual patient visits. Any OTN utilization that was not covered by OHIP is not included in this analysis.
Using OHIP's Schedule of Benefits for physicians,21 we were able to organize the billing codes by therapeutic area of care. We used the most common areas according to OTN22 reporting and grouped everything else as “other.” Addiction codes were categorized with Mental Health as per OTN reporting.
Results
Of scheduled OTN visits billed through OHIP, 89.1% (n = 652,337) were completed patient visits, 10.7% (n = 78,708) were appointments that were missed or canceled, and 0.2% (n = 1,343) were dropped due to technical difficulties. Patient location was missing in 32,514 visits (5.0% of total completed visits).
Just over half (51.6%) of all completed visits took place with patients from Southern Ontario, 81.9% of which (275,605/336,570) were in urban areas (Table 1). In contrast, only half of the patients from Northern Ontario resided in urban areas (49.9% [141,440/283,253]). The CSDs with the highest number of patient visits were urban areas that are distant from Ontario's metropolis Toronto, and these included Thunder Bay in Northwestern Ontario with 50,485, Ottawa in Southeastern Ontario with 44,722, and Greater Sudbury in Northeastern Ontario with 28,946 patient visits.
Table 1.
Ontario Telemedicine Network Facilitated Patient Visits Recorded in the Provincial Medical Services Database by Fiscal Year
| FISCAL YEAR | RURAL NORTH (N = 132 CSDs) | URBAN NORTH (N = 25 CSDs) | RURAL SOUTH (N = 159 CSDs) | URBAN SOUTH (N = 110 CSDs) | MISSING PATIENT LOCATION | TOTAL COMPLETED PATIENT VISITS |
|---|---|---|---|---|---|---|
| 2008/2009 | 12,525 (45.7%) | 8,121 (29.6%) | 2,487 (9.1%) | 3,189 (11.6%) | 1,087 (4.0%) | 27,409 (100%) |
| 2009/2010 | 15,445 (39.3%) | 9,697 (24.7%) | 3,859 (9.8%) | 8,488 (21.6%) | 1,780 (4.5%) | 39,269 (100%) |
| 2010/2011 | 18,350 (31.7%) | 11,443 (19.8%) | 5,836 (10.1%) | 19,190 (33.2%) | 3,050 (5.3%) | 57,869 (100%) |
| 2011/2012 | 26,329 (22.3%) | 23,715 (20.1%) | 9,931 (8.4%) | 50,457 (42.7%) | 7,642 (6.5%) | 118,074 (100%) |
| 2012/2013 | 33,229 (17.6%) | 38,162 (20.3%) | 17,429 (9.3%) | 89,013 (47.3%) | 10,530 (5.6%) | 188,363 (100%) |
| 2013/2014 | 35,935 (16.2%) | 50,302 (22.7%) | 21,423 (9.7%) | 105,268 (47.6%) | 8,425 (3.8%) | 221,353 (100%) |
| Total | 141,813 (21.7%) | 141,440 (21.7%) | 60,965 (9.3%) | 275,605 (42.2%) | 32,514 (5.0%) | 652,337 (100%) |
Data are number (%) of visits. Excluded are 78,708 missed appointments and 1,343 appointments dropped for technical reasons.
CSD, census subdivision.
The number of OTN patient visits grew from 27,409 in the 2008/2009 fiscal year to 221,353 in the 2013/2014 fiscal year (Fig. 1). From 2008/2009 to 2010/2011, there were more patient visits in Northern Ontario than in Southern Ontario. Although utilization in Northern Ontario continued to grow, by the end of the study period, just under 40% of visits were taking place with patients from the north (38% in 2012/2013 and 39% in 2013/2014), down from 75% in 2008/2009. Similarly, in 2008/2009 most visits were taking place with rural patients (55%), but by 2013/2014 only 26% of visits were taking place with rural patients, as the absolute number of telemedicine visits in urban areas surpassed that in rural areas. We also calculated utilization rates for each CSD to provide a per capita measure of telemedicine use across regions with different population sizes (Fig. 2). Utilization rate for completed OHIP billable patient visits for CSDs in Ontario ranged from no visits to 484.5 visits per 1,000 people per year during 2008/2009 to 2013/2014. The median utilization rate for Ontario CSDs was 8.4, and the mean was 30.2 for the study period. The median rate for rural Northern Ontario was higher than for urban Northern Ontario (52.0 versus 32.1), and both areas were much higher than rates in Southern Ontario (3.1 for urban Southern Ontario and 6.1 for rural Southern Ontario) (Fig. 3).
Fig. 1.

Number of Ontario Telemedicine Network facilitated patient visits per month as recorded in the provincial medical services database for Southern and Northern Ontario from fiscal years 2008/2009 to 2013/2014.
Fig. 2.

Map of annual number of Ontario Telemedicine Network facilitated patient visits per 1,000 people by census subdivision (CSD) as recorded in the provincial medical services database from 2008/2009 to 2013/2014 for Ontario CSDs.
Fig. 3.
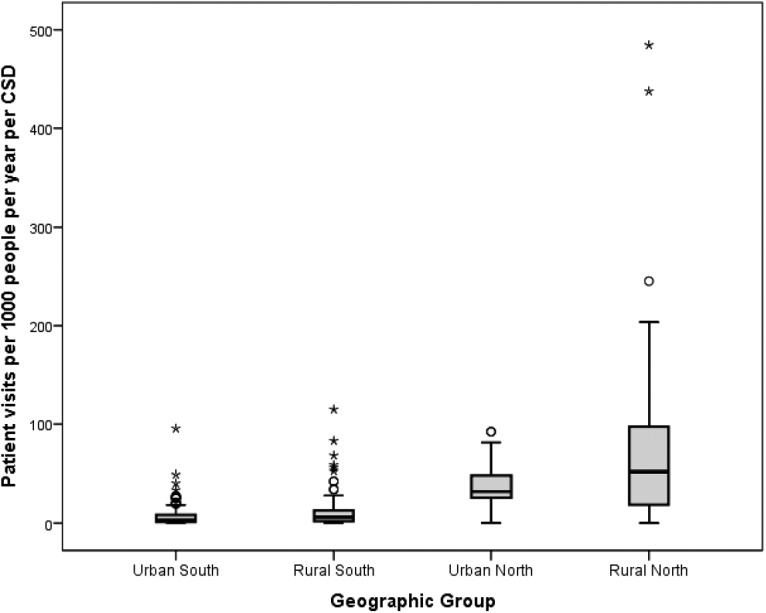
Boxplot of annual number of Ontario Telemedicine Network facilitated patient visits by census subdivision (CSD) as recorded in the provincial medical services database from 2008/2009 to 2013/2014 for Ontario regions.
Figure 4 shows distinct differences among the four geographical regions by population size and utilization rate. Northern rural areas had higher utilization rates and smaller populations than Southern rural areas. Southern urban areas had higher populations and lower utilization rates. Northern urban areas were spread among population sizes and utilization rates. The median utilization rate for Ontario CSDs increased from 1 visit per 1,000 people per year in 2008/2009 to 19.5 in 2013/2014; in Northern Ontario, median utilization rates increased from 39.5 to 96.9 over the same period.
Fig. 4.

Number of Ontario Telemedicine Network facilitated patient visits per year by census subdivision (CSD) as recorded in the provincial medical services database from 2008/2009 to 2013/2014 for Ontario regions. The data are truncated at rates of 250 and population sizes of 52,000 to show detail. Inset: All data.
In Ontario, 62% of telemedicine use is for mental health and addictions, and this varies from 42% in rural Northern Ontario to 70% in urban Southern Ontario (Fig. 5). Family and general medicine use is highest in urban areas, especially urban Southern Ontario. Proportionally, rural Northern Ontario has more surgical, oncology, and internal medicine use than the other geographical areas. Usage for the catchall category of “other clinical services” is higher in rural than urban CSDs (15% versus 7%), regardless of region.
Fig. 5.
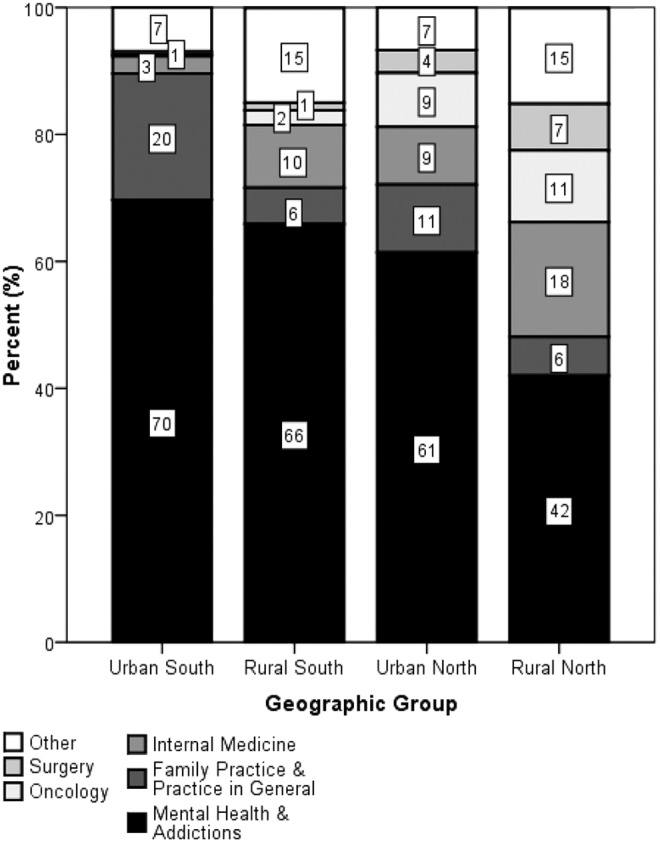
Percentage of completed Ontario Telemedicine Network facilitated patient visits per geographic group by therapeutic area of care from 2008/2009 to 2013/2014.
Discussion
Our study found increasing OTN utilization in all regions of Ontario from 2008/2009 to 2013/2014 with the greatest absolute increase for patients living in urban southern Ontario. Per capita rates also increased over time, with higher rates in Northern Ontario, particularly in rural northern CSDs. We recognize there is a lack of standard measure to calculate telemedicine activity, which makes comparison problematic. The mean utilization rate of 30 visits per 1,000 people is higher than previously reported rates for Ontario of 9 to 22 visits per 1,000 people from 2010 to 2014.10 The main reason for the different rates is that the other study used data collected for scheduling purposes, whereas we used data collected for physician payment, and so there may be differences in how sessions are defined and which sessions are counted.
Concerns regarding the reliability of the technology have been cited as reasons why patients and physicians hesitate to use telemedicine.23–28 OHIP data suggest that only 0.2% of visits are dropped due to technical difficulties. The rates of technical difficulties vary for different telemedicine providers and may improve over time. For instance, telemedicine providers have reported technical difficulties in as many as one in five visits in a review of 1,000 patient visits during the start-up of a new telemedicine program.29 Another study in a pediatric cardiac unit reported no technical difficulties in a case series of 53 patients over 9 months.30 Technical difficulties can be mediated by investing in appropriate technology and infrastructure, including training for the people who will be using the technology.31–33
The rates of missed and canceled visits are often a problem in medical settings. For OTN-flagged OHIP billings, 10.7% of all scheduled visits were missed or canceled. This is comparable to other healthcare programs, in which missed visits range from 10% to 25%.34–36
Telemedicine is often used to provide mental health services to patients, especially those residing in underserved rural and remote communities with limited access to in-person services.11,12,37,38 Praxia10 reported that 54% of utilization in Canada in 2010/2011 was for addictions and mental health. In our study, 62% of utilization was for mental health and addictions services. The proportion of telemedicine utilization in mental health and addictions is lower in rural Northern Ontario than in other parts of the province. This is not due to lower per capita utilization for mental health and addictions in the north, but due to a higher rate of OTN utilization for other clinical areas of care, such as oncology, surgery (consultation and follow-up), and internal medicine. We suggest that telemedicine helps compensate for the lack of medical specialists with practices in northern and rural areas, thus realizing monetary and environmental benefits associated with reduced patient or provider travel as well as the potential health benefits of increased access to medical care.
The primary limitation to this research is that data on OTN are collected for billing purposes and are not designed for research. A pertinent limitation is that OHIP data underestimate patient visits in First Nation communities. In addition, OHIP data count only patient–physician interactions and exclude physician–physician consultations or care management sessions. Nonmedical clinical use is also excluded. For example, OHIP data exclude visits with other healthcare professionals such as nurses, occupational therapists, or physical therapists and exclude family visits that connect patients with loved ones in distant parts of the province. However, with the exception of telemedical services provided to patients in First Nations communities that are billed to the federal government, physicians must use OTN for clinical services to be eligible for remuneration by the province, and most physicians bill OTN clinical sessions as fee-for-service, with the possible exception of some of those physicians who are salaried or participate in alternative physician compensation models. Therefore, OHIP billing is considered to accurately capture telemedical services in Ontario, with the aforementioned exception of First Nations communities. A geographic limitation is that several of the rural Northern Ontario CSDs span several hundred square kilometers. As such, aggregate measures may conceal important differences in access to care and utilization of OTN within these CSDs.
Next Steps
In the previous stage of this research, we conducted a road network analysis to find the maximum potential access to OTN for residents in Northern Ontario. In this article, we calculated utilization rates in Ontario for rural and urban areas in Northern and Southern Ontario and identified use by broad type of therapeutic care. In the next stage of this research, we will assess factors that affect OTN uptake through further analysis of administrative data, augmented by interviews with key stakeholders in order to provide recommendations regarding the future of telemedicine in Ontario.
Conclusions
Utilization rates were higher in rural CSDs than in urban CSDs and higher in Northern Ontario than in Southern Ontario. Type of use was more evenly distributed in rural Northern Ontario CSDs than in other regions, although the category of mental health and addictions was still the most frequent type of use. While we do not know if overall access to care is increasing in Northern Ontario, access to care via OTN is certainly on the rise, and utilization rates are highest in traditionally underserved rural areas. Although this article focuses on utilization in Ontario, the success of OTN's model can be used elsewhere in the world to advocate for the development of virtual care for a wide variety of therapeutic areas of care, especially in rural, remote, and underserved areas.
Acknowledgments
We thank the Ontario Ministry of Health and Long-Term Care for providing data and supporting our research through the Health System Research Fund (grant 04254SB). We thank the Ontario Telemedicine Network for their advice and support of the study.
Disclosure Statement
No competing financial interests exist.
References
- 1.Mars M, Scott R. Telemedicine service use: A new metric. J Med Internet Res 2012;14:e178. [DOI] [PMC free article] [PubMed] [Google Scholar]
- 2.Statistics Canada. Census profile, 2011 census. Statistics Canada catalog number 98-316-XWE. Ottawa: Statistics Canada, 2012 [Google Scholar]
- 3.Statistics Canada. Population and dwelling counts, for Canada, provinces, and territories, census metropolitan areas and census agglomerations, 2011 and 2006 censuses. Ottawa: Statistics Canada, 2015 [Google Scholar]
- 4.Pong RW, Pitblado JR. Geographic distribution of physicians in Canada: Beyond how many and where. Ottawa: Canadian Institute for Health Information, 2005 [Google Scholar]
- 5.Wenghofer EF, Timony PE, Pong RW. A closer look at Ontario's northern and southern rural physician demographics. Rural Remote Health 2011;11:1591. [PubMed] [Google Scholar]
- 6.Brown EM. The Ontario Telemedicine Network: A case report. Telemed J E Health 2013;19:373–376 [DOI] [PubMed] [Google Scholar]
- 7.COACH. 2013. Canadian telehealth report. Canada's Health Informatics Association; 2015. Available at www.coachorg.com/en/communities/Telehealth-Report---2015.asp (last accessed October22, 2015) [Google Scholar]
- 8.Holmes M, Hart A. Profile: Ed Brown and the development of Ontario Telemedicine Network. Healthc Q 2009;12:28–31 [DOI] [PubMed] [Google Scholar]
- 9.O'Gorman LD, Hogenbirk JC. Driving distance to telemedicine sites in Northern Ontario as a measure of potential access to healthcare. Telemed J E Health 2016;22. doi: 10.1089/tmj.2015.0133 [DOI] [PubMed] [Google Scholar]
- 10.Praxia Information Intelligence & Gartner Inc. Telehealth benefits and adoption: Connecting people and providers across Canada. 2011. Available at https://www.infoway-inforoute.ca/en/component/edocman/resources/reports/333-telehealth-benefits-and-adoption-connecting-people-and-providers-full/view-document (last accessed September8, 2015)
- 11.Hailey D, Ohinmaa A, Roine R, Bulger T. Uptake of telemental health services in Alberta: A success, but not in all regions. J Telemed Telecare 2007;13(Suppl 3):42–44 [Google Scholar]
- 12.Lessing K, Blignault I. Mental health telemedicine programmes in Australia. J Telemed Telecare 2001;7:317–323 [DOI] [PubMed] [Google Scholar]
- 13.Mehrotra A, Paone S, Martich GD, Albert SM, Shevchik GJ. Characteristics of patients who seek care via evisits instead of office visits. Telemed J E Health 2013;19:515–519 [DOI] [PMC free article] [PubMed] [Google Scholar]
- 14.Bahaadinbeigy K, Yogesan K, Wootton R. A survey of the state of telemedicine in Western Australia. J Telemed Telecare 2010;16:176–180 [DOI] [PubMed] [Google Scholar]
- 15.Newfoundland and Labrador Centre for Health Information. Evaluating the benefits of Newfoundland and Labrador provincial telehealth program: Chronic disease management. Canada Health Infoway. 2010. Available at http://www.nlchi.nl.ca/images/PDFs/Telehealth_BE_FinalReport.pdf (last accessed August8, 2015)
- 16.Local Health Integration Network. Ontario LHINs. 2014. Available at www.lhins.on.ca/ (last accessed October8, 2014)
- 17.McNiven C, Puderer H, Janes D. Census metropolitan area and census agglomeration influenced zones (MIZ): A description of the methodology. Statistics Canada catalog number 92F0138MIE, number 2000-2. Ottawa: Statistics Canada, 2000 [Google Scholar]
- 18.KOTM. Making Health Services Accessible for Remote and Isolated First Nations in Ontario's Far North: KO eHealth Telemedicine Services Annual Report, 2014–15. 2015. Available at https://tm.knet.ca/files/FINAL_KOETS_AR_2014-15.pdf (last accessed October22, 2015)
- 19.Health Canada. First Nations & Inuit Health. 2014. Available at www.hc-sc.gc.ca/fniah-spnia/index-eng.php (last accessed July25, 2015)
- 20.Ministry of Health and Long Term Care. Data link for OHIP billing software vendors per the OHIP payment of telemedicine claims. 2008. Available at www.health.gov.on.ca/en/pro/programs/ohip/bulletins/technical/08_003.pdf (last accessed August28, 2015)
- 21.Ministry of Health and Long Term Care. Schedule of benefits: Physician services under the Health Insurance Act. 2015. Available at www.health.gov.on.ca/english/providers/program/ohip/sob/physserv/sob_master11062015.pdf (last accessed August28, 2015)
- 22.OTN. Top therapeutic areas of care across Ontario. 2015. Available at https://otn.ca/en/members/newsletter (last accessed August5, 2015)
- 23.Al-Qirim N. Championing telemedicine adoption and utilization in healthcare organizations in New Zealand. Int J Med Inf 2007;76:42–54 [DOI] [PubMed] [Google Scholar]
- 24.Mauldon E. The use of and attitudes towards telehealth in rural communities. Aust J Prim Health 2007;13:29–34 [Google Scholar]
- 25.Menachemi N, Burke DE, Ayers DJ. Factors affecting the adoption of telemedicine—A multiple adopter perspective. J Med Syst 2004;28:617–632 [DOI] [PubMed] [Google Scholar]
- 26.Moffatt JJ, Eley DS. Barriers to the up-take of telemedicine in Australia—A view from providers. Rural Remote Health 2011;11:1581. [PubMed] [Google Scholar]
- 27.Whitten P, Holtz B. Provider utilization of telemedicine: The elephant in the room. Telemed J E Health 2008;14:995–997 [DOI] [PubMed] [Google Scholar]
- 28.Barton PL, Brega AG, Devore PA, Mueller K, Paulich MJ, Floersch NR, et al. Specialist physicians' knowledge and beliefs about telemedicine: A comparison of users and nonusers of the technology. Telemed J E Health 2007;13:487–500 [DOI] [PubMed] [Google Scholar]
- 29.Nesbitt TS, Hilty DM, Kuenneth CA, Siefkin A. Development of a telemedicine program: A review of 1,000 videoconferencing consultations. West J Med 2000;173:169–174 [DOI] [PMC free article] [PubMed] [Google Scholar]
- 30.Munoz RA, Burbano NH, Motoa MV, Santiago G, Klevemann M, Casilli J. Telemedicine in pediatric cardiac critical care. Telemed J E Health 2012;18:132–136 [DOI] [PubMed] [Google Scholar]
- 31.Buck S. Nine human factors contributing to the user acceptance of telemedicine applications: A cognitive-emotional approach. J Telemed Telecare 2009;15:55–58 [DOI] [PubMed] [Google Scholar]
- 32.Mooi JK, Whop LJ, Valery PC, Sabesan SS. Teleoncology for Indigenous patients: The responses of patients and health workers. Aust J Rural Health 2012;20:265–269 [DOI] [PubMed] [Google Scholar]
- 33.Garfield MJ, Watson RT. Four case studies in state-supported telemedicine initiatives. Telemed J E Health 2003;9:197–205 [DOI] [PubMed] [Google Scholar]
- 34.McLean S, Gee M, Booth A, Salway S, Nancarrow S, Cobb M, et al. Targeting the Use of Reminders and Notifications for Uptake by Populations (TURNUP): A systematic review and evidence synthesis. Southampton, United Kingdom: Queen's Printer and Controller of HMSO, 2014 [PubMed] [Google Scholar]
- 35.Adjei DN, Agyemang C, Dasah JB, Kuranchie P, Amoah AG. The effect of electronic reminders on risk management among diabetic patients in low resourced settings. J Diabetes Complications 2015;29:818–821 [DOI] [PubMed] [Google Scholar]
- 36.Macharia WM, Leon G, Rowe BH, Stephenson BJ, Haynes R. An overview of interventions to improve compliance with appointment keeping for medical services. JAMA 1992;267:1813–1817 [PubMed] [Google Scholar]
- 37.Hilty DM, Yellowlees PM, Nesbitt TS. Evolution of telepsychiatry to rural sites: Changes over time in types of referral and in primary care providers' knowledge, skills and satisfaction. Gen Hosp Psychiatry 2006;28:367–373 [DOI] [PubMed] [Google Scholar]
- 38.Information Analysis and Connectivity Branch. Telemental health in Canada: A status report. Ottawa: Health Canada, 2006 [Google Scholar]