
FIG. 3.
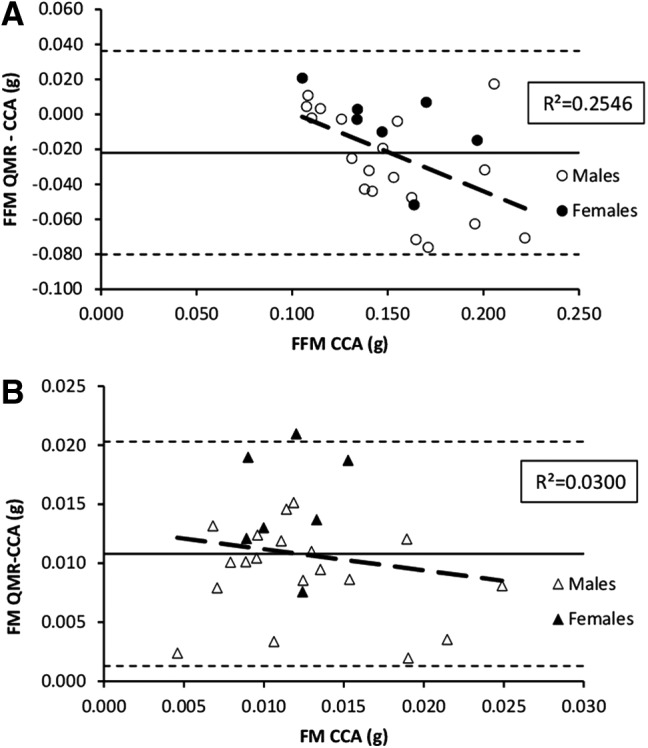
Residual plots for (QMR–CCA) body composition compartments for the validation group (n = 26) for (A) FFM and (B) FM. Group mean differences (solid line) ± 2 SD (dotted line) shown. Regression line (dashed line) demonstrates a significant bias in FFM and FM. SD, standard deviation.