Abstract
The blood oxygen-level dependent (BOLD) response to a neural stimulus is analysed using the transfer function derived from a physiologically based poroelastic model of cortical tissue. The transfer function is decomposed into components that correspond to distinct poles, each related to a response mode with a natural frequency and dispersion relation; together these yield the total BOLD response. The properties of the decomposed components provide a deeper understanding of the nature of the BOLD response, via the components' frequency dependences, spatial and temporal power spectra, and resonances. The transfer function components are then used to separate the BOLD response to a localized impulse stimulus, termed the Green function or spatio-temporal haemodynamic response function, into component responses that are explicitly related to underlying physiological quantities. The analytical results also provide a quantitative tool to calculate the linear BOLD response to an arbitrary neural drive, which is faster to implement than direct Fourier transform methods. The results of this study can be used to interpret functional magnetic resonance imaging data in new ways based on physiology, to enhance deconvolution methods and to design experimental protocols that can selectively enhance or suppress particular responses, to probe specific physiological phenomena.
Keywords: fMRI, BOLD, modes, decomposition, spatio-temporal, haemodynamics
1. Introduction
Functional magnetic resonance imaging (fMRI), based on the blood oxygen-level dependent (BOLD) signal, has become increasingly popular in the last decades because of its ability to probe the function of various regions of the brain. The experiments are performed through non-invasive measurement of vascular oxygenation changes in response to neural activity [1–5]. The dynamics of the BOLD response can be further understood by formulating a haemodynamic response function (HRF) that represents the spatio-temporal properties of the response to a localized impulse of stimulation; for neuroimaging, the stimulation is related to the neural activity. Such a formulation will potentially enable better mapping of the brain areas that respond to specific experimental stimuli.
Attempts have been made to model the BOLD signal by linking changes in haemodynamic quantities, such as cerebral blood flow (CBF), cerebral blood volume (CBV) and deoxygenated haemoglobin (dHb). One of them is the temporal ‘balloon model’ [6] that treats the cerebral vasculature as an elastic balloon that inflates/deflates during an increase/decrease in blood volume. Paired with the neurovascular model of [7], this has successfully predicted observed temporal properties of the BOLD signal, such as stimulus-dependent increases and undershoots [7,8]. Many studies on the spatio-temporal variation of BOLD, on the other hand, have rested on an assumption that the spatio-temporal haemodynamic response function (stHRF) is just a product of a temporal HRF and a spatial point spread function. The spatial function has been widely approximated by a Gaussian function [9], motivated by numerical fitting in three-dimensional fMRI experiments [10,11] and rapid spatial diffusion of vasodilatory agents, such as nitric oxide [12]. However, the simple product of temporal and spatial HRFs ignores intrinsic brain dynamics such as blood flow in between neighbouring veins and arteries, finite blood propagation speeds and haemodynamic waves [13].
A recent physiologically based model, which treats cortical tissue as a poroelastic medium, is successful in predicting both the spatial and temporal characteristics of the BOLD response [13–15]. The model was formulated using the methods from the theory of linear poroelasticity in geophysics [16], resulting in a transfer function that predicts the linear BOLD response to a neural activity. It comprises coupled nonlinear partial differential equations that embody the mean field approximations of haemodynamic changes of blood flow, blood mass, pore pressure and haemoglobin concentration in response to neural activity as governed by physical conservation laws.
The features of the transfer function derived from poroelastic haemodynamics relate the dynamics of inputs to determine the spatio-temporal properties of the BOLD response. One important feature is the frequency poles that allow recovery of the natural frequencies that govern the inherent modes of oscillation of the BOLD signal. In order to find the poles, one can use the partial fraction method widely used in control systems theory [17] and computer modelling [18]. The technique transforms a transfer function into linear combinations of lower-order components, thereby reducing the complexity of the system under study. The objective of this work is to analytically decompose the BOLD transfer function into partial fractions to derive the poles and response modes. This may enable us to formulate optimization protocols that allow one to selectively enhance or suppress specific modes/responses depending on which physiological phenomenon is relevant.
The paper is organized as follows: in §2, we summarize the spatio-temporal haemodynamic model [13–15] and discuss how the resulting transfer function predicts the linear BOLD response to a neural activity. In §3, we detail the partial fraction method to decompose the BOLD response into natural modes, each corresponding to a frequency pole. In §4, we characterize the spatio-temporal frequency properties of these components in terms of frequency responses, power spectra and resonances. In §5, we derive analytic expressions for the BOLD response to localized impulsive neural activity, mathematically modelled as a Dirac delta function; we term this response the Green function or the stHRF. The results provide a powerful quantitative tool to calculate the linear BOLD response to an arbitrary neural drive, which is faster and more efficient than traditional Fourier transform methods. In §6, we apply our analytical results to determine the BOLD response to a spatio-temporal Gaussian stimulus and compare with experimental fMRI data. We show how the response can be decomposed into its components. We also show an illustrative example to selectively enhance the BOLD response components by using a spatio-temporally moving sinusoidal neural stimulus. Finally, in §7, we summarize our major results and provide key points in designing appropriate protocols to test our findings in future experiments.
2. Spatio-temporal haemodynamic model
Many studies have shown that the BOLD signal, measured using fMRI, can serve as a proxy for neural responses [4,5]. The physical principles underlying fMRI experimental data can be better understood by formulating a theory that can predict the haemodynamic response to neural activity. In this section, we outline the key results of a recent haemodynamic model derived from physiological properties of cortical tissue that produces a transfer function that can predict the linear BOLD response to a neural activity. Readers are referred to the original references for detailed description and derivation [13–15].
2.1. Dynamical equations
Here we outline and briefly discuss the spatio-temporal haemodynamic model. Its equations can be used to predict the spatio-temporal BOLD signal Y.
The model starts by considering a cortical tissue approximated as a poroelastic medium in which the vessels serve as the ‘pores’ of the system as shown in figure 1. In the presence of a neural activity ζ(R, t) at location R at time t, the neurovascular coupling between neurons and blood vessels leads to changes in blood inflow. The arterial blood inflow rate F(R, t) is modelled as a damped harmonic oscillator driven by the neural drive ζ(R, t) [7,14]
| 2.1 |
where κ, γ and F0 are the blood flow signal decay rate, the flow-dependent elimination constant and the resting blood inflow, respectively.
Figure 1.
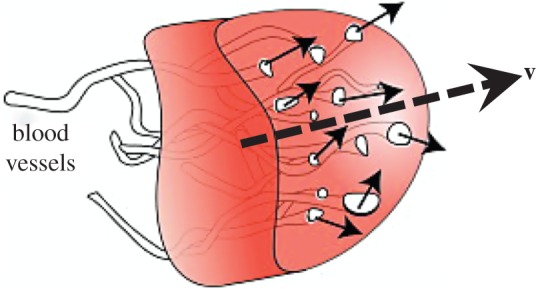
Arbitrary volume element of poroelastic cortical tissue. Blood flows through the vessels, serving as pores of the tissue, in the direction of the solid arrows. Broken arrow indicates the average direction of the flow with velocity v. (Online version in colour.)
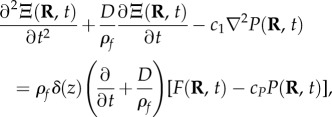
The response owing to inflows or outflows is constrained by changes in blood vessel pressure and conservation of mass and momentum of blood within the tissue. This is collectively modelled by the nonlinear haemodynamic wave equation for blood mass Ξ(R, t) [13,15]
 |
2.2 |
where D quantifies damping owing to effective blood viscosity, ρf is the blood density, c1 is the pressure coupling constant, δ(z) is the Dirac delta function expressing the inflows or outflows at the cortical surface z = 0, cP is the blood outflow constant, and P(R, t) is the average pressure. Equation (2.2) predicts propagation of Ξ waves with  serving as the spatial coupling between adjacent sites in the tissue owing to pore pressure gradients. In addition, P(R, t) is related to Ξ via the constitutive equation
| 2.3 |
where c2 is the porous coupling constant and β is the elasticity exponent of cortical vessels. In this paper, we associate β with the reciprocal of Grubb's exponent, which relates CBF to CBV, such that β ≈ 3.23 [14,19]. This β value implies that the average behaviour of the vessels is hyperelastic (i.e. more resistant to stretching than perfectly elastic vessels).
Analogous to the conservation of blood mass in the arterioles, conservation of dHb must also be followed in the veins. Changes in the concentration of dHb Q(R, t) are described by the dynamical equation
 |
2.4 |
where v(R, t) is the average blood velocity, vF(R, t) is the inflow blood velocity, vP(R, t) is the outflow blood velocity, ψ is the ratio of haemoglobin concentration to blood density and η is the fractional rate of oxygen consumption. The first term on the right-hand side relates the rate of change of dHb to the amount of flux going to adjacent sites, the second term is the conversion of dHb to oxygenated haemoglobin (ψΞ − Q) at a rate η, and the last term represents the rate of reduction of dHb owing to blood outflow at the boundary. On the other hand, vF(R, t) and vP(R, t) are derived from the boundary conditions imposed on Q(R, t) and follow the relations
| 2.5 |
and
| 2.6 |
whereas conservation of momentum governs the average blood velocity such that
| 2.7 |
Finally, the BOLD signal Y is modelled by the semi-empirical relation [20]
 |
2.8 |
where V0 is the resting blood volume fraction, Q0 is the resting dHb concentration per unit cerebral cortical volume, and k1–k3 are parameters dependent on the configuration of the fMRI scanner used. Equation (2.8) expresses the spatio-temporal BOLD signal Y(R, t) in terms of the quantities F(R, t), Ξ(R, t), P(R, t) and Q(R, t) for a given neural drive ζ(R, t).
2.2. Linear blood oxygen-level dependent transfer function
Equations (2.1)–(2.8) can be used to calculate the nonlinear haemodynamic response to any kind of neural drive ζ(R, t). However, when the neural drive is short in duration and low in amplitude, it has been shown in experiments that the haemodynamic response is approximately linear [13,21]. In this case, we can treat the haemodynamic variables F, Ξ, Q, v, P, ζ and Y as being linear perturbations from their steady-state values allowing us to linearize equations (2.1)–(2.8).
Fourier methods can be used to understand the properties of the linearized equations at a given spatial frequency k and temporal angular frequency ω. This leads to a set of transfer functions Tθζ which describes the change of the haemodynamic quantity θ (i.e. F, Ξ, Q, Y) per unit change in neural drive ζ at the same k and ω. As an example, for θ = Y, the transfer function TYζ that relates the BOLD signal to the neural drive is
| 2.9 |
where Y(k, ω) and ζ(k, ω) are the Fourier transforms of the BOLD signal Y(R, t) and neural drive ζ(R, t), respectively.
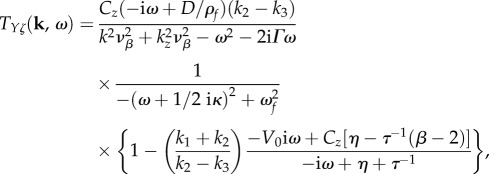
Upon averaging of dynamics through the thickness of the cortex, linearization of equations (2.1)–(2.8), and mapping to Fourier space, equation (2.9) becomes [15]
 |
2.10 |
where  is the spatial wavenumber in the plane of the cortex, Cz is the outflow normalization constant, kz is the effective spatial frequency, ωf is the natural frequency of flow response, τ is the haemodynamic transit time and vβ and Γ are the free parameters corresponding to the wave propagation speed and damping rate, respectively [13,15]. All constants are either obtained from known physiological estimates or derived from steady-state behaviour [15]; their nominal values from physiology are summarized in table 1.
Table 1.
Model variables and parameters. In each row, the columns are ordered from first to last to detail the variable or parameter, its symbol or formula, its nominal value/range from physiology coming from various sources, and its units, respectively [8,14,15,22–25].
| variable | symbol | value | units |
|---|---|---|---|
| pressure coupling constant | c1 | 6 × 10⁻⁸ | — |
| porous coupling constant | c2 | 104 × (32)−β | Pa kg−β m3β |
| blood flow signal decay rate | κ | 0.65 | s−1 |
| flow-dependent elimination constant | γ | 0.41 | s−2 |
| blood mass density | ρf | 1062 | kg m–3 |
| effective blood viscosity | D | 106–850 | kg m–3 s–1 |
| mean elasticity exponent of cortical vessels | β | 3.23 | — |
| baseline CBF | F0 | 0.01 | s–1 |
| haemodynamic transit time | τ | 1 | s |
| fractional oxygen consumption rate | η | 0.4 | s–1 |
| haemoglobin concentration–blood density ratio | ψ | 0.0018 | mol kg–1 |
| resting blood volume fraction | V0 | 0.03 | — |
| magnetic field parameters at 3 T, TE = 30 ms | k1, k2, k3 | 4.2, 1.7, 0.41 | — |
| natural frequency of flow response |  |
0.56 | s–1 |
| blood outflow constant | cP | 1 × 10⁻⁷ | s–1 Pa–1 |
| average cortical thickness | L | ≈3 | mm |
| wave propagation speed | vβ | 1–20 | mm s–1 |
| wave damping rate |  |
0.1–1 | s–1 |
| perpendicular spatial frequency | k0 = cos−1(0.8)/L | ≈214 | m–1 |
| outflow normalization constant |  |
≈0.36 | — |
| effective spatial frequency |  |
≈214–950 | m–1 |
2.3. Calculation of the blood oxygen-level dependent response
Equations (2.9) and (2.10) can be used to calculate the BOLD response to an arbitrary drive. This is achieved by taking the inverse Fourier transform of Y(k, ω) to obtain the two-dimensional linear BOLD response in coordinate space as
 |
2.11 |
where from here on, the previously defined spatial variable R is replaced by r to signify that we are measuring the average dynamics in the plane of the cortex. Note that it is possible to extend the BOLD measurement to three dimensions to complement studies on laminar flows and cortical layer-specific activity [26]. However, this requires additional underlying theory to be developed and is beyond the scope of this study.
3. Natural modes of the blood oxygen-level dependent response
Transfer functions are vital in signal processing and control systems theory as they are powerful and convenient representations of the input–output response of a linear system [17]. Consider a transfer function G(ω) obtained through methods such as Fourier and Laplace transforms, which describes the response of a linear system to different frequencies ω. If G(ω) can be expressed as a ratio of two polynomials (i.e.  the roots of B(ω) are poles of G(ω) and will give us an insight into the behaviour of the system for any input. Solving the linear dispersion relation corresponding to the poles will result in output solutions that represent the underlying modes of oscillation of the system. For example, if a pole of the form −a ± bi is found for G(ω), where a and b are positive constants, then we can immediately infer that one of the underlying modes of the system under study is a decaying sinusoid with decay rate a and oscillation frequency b. Other modes that can possibly arise from analysis of the poles are widely discussed in several control systems books such as [17]. Finally, the general response after an arbitrary excitation will be a weighted sum of all the modes.
In this section, we rewrite the linear BOLD transfer function in equation (2.10) as a ratio of two polynomials and calculate the poles. We decompose the resulting equation into components corresponding to each pole via the partial fraction method, thereby allowing us to derive the natural modes of the BOLD response.
3.1. Pole decomposition of the blood oxygen-level dependent transfer function
Here we provide an analytic method to decompose the BOLD transfer function to pole components associated with its modes. We want to write TYζ as a linear sum of transfer functions Tj(k, ω), i.e.
 |
3.1 |
where N is the number of modes we can extract from TYζ. This enables us to characterize the separate contribution of the jth mode to the overall BOLD response. In addition, we want Tj to be related to a temporal frequency pole ωj(k) with general form
| 3.2 |
such that the jth mode of TYζ follows the dispersion relation
| 3.3 |
and aj(k) is a k-dependent quantity that needs to be determined. Equations (3.1) and (3.2), when combined, decompose the BOLD transfer function via the partial fraction method. The rest of the section is devoted to the derivation of the number of modes N, the poles ωj(k), and the quantities aj(k).
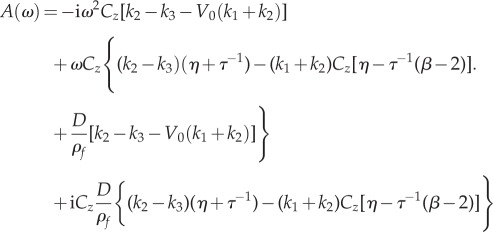
We start by expressing equation (2.10) as a ratio of two polynomials A(ω) and B(k, ω) such that
| 3.4 |
where
 |
3.5 |
and
 |
3.6 |
We can write A(ω) in a compact form by defining real-valued constants
| 3.7 |
 |
3.8 |
 |
3.9 |
such that equation (3.5) becomes
| 3.10 |
On the other hand, B(k, ω) in equation (3.6) is a fifth-order polynomial, which implies that the BOLD transfer function has five frequency poles corresponding to five intrinsic modes (N = 5). To derive the exact form of the poles, we rewrite equation (3.6) as
 |
3.11 |
where the dispersion relation in equation (3.3) is followed. Comparing equations (3.6) and (3.11), the complex frequency poles are
| 3.12 |
| 3.13 |
| 3.14 |
| 3.15 |
| 3.16 |
where ω3, ω4 and ω5 are k-independent constants. We use equations (3.1), (3.2), (3.4), (3.10) and (3.11) to get the final expression for aj(k) as
 |
3.17 |
where δjm is the Kronecker delta equal to 1 if j = m and 0 otherwise. We see from the form of aj(k) that each Tj depends on all m ≠ j poles, implying that the modes of the BOLD response will have inter-related properties.
3.2. Decomposition of the blood oxygen-level dependent response
In §3.1, we analytically decomposed TYζ into a linear sum of component transfer functions Tj. This result when substituted in equation (2.11) leads to the decomposition of two-dimensional BOLD response Y(r, t) as a linear sum of five response components Yj(r, t). Mathematically, this is demonstrated as
 |
3.18 |
where
 |
3.19 |
Many studies have shown that a linear section of the primary visual cortex will be stimulated if presented with a ring stimulus centred in the subject's visual field [13,27], owing to the natural retinotopic mapping between visual field and visual cortex [28]. Thus, a ring visual stimulus translates to a neural drive that only spatially varies perpendicular to a line (i.e. it is independent of the y direction) and results in a stronger BOLD response than its two-dimensional point-stimulus counterpart [13,15]. Hence, it is also worth calculating the BOLD response to a neural stimulus that is uniform in the y-dimension such that
| 3.20 |
where kx and ky are the spatial frequencies in the x- and y-directions, respectively. Substituting equation (3.20) into (2.11) will allow us to drop the y argument and Y will only depend on the one-dimensional distance x perpendicular to the centre of stimulus given by
| 3.21 |
We can then represent equation (3.21) as
 |
3.22 |
where
| 3.23 |
is the jth component of the BOLD response in one dimension (i.e. to a line stimulus).
4. Features of components Tj(k,ω)
For a given neural drive ζ, the BOLD response Y depends on the properties of the transfer function TYζ(k, ω). The decomposition derived in §3 allows us to isolate the contribution of each component Tj(k, ω) to the overall characteristics of TYζ(k,ω), providing a detailed understanding of the BOLD response. It also aids in formulating possible methods to selectively enhance or suppress specific modes of the BOLD response depending on which pole ωj(k) we want to focus on. In this section, we describe the frequency characteristics of Tj(k, ω) and calculate its corresponding temporal and spatial power spectra. We analytically derive the frequencies of resonances in the power spectra and associate them with the singularities of aj(k).
4.1. Spatio-temporal frequency properties
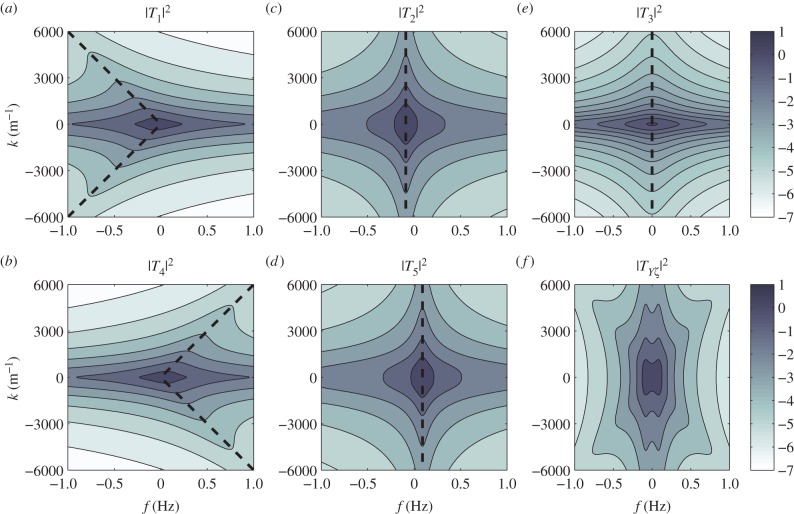
The wave properties of the BOLD response Y depend on the intrinsic frequency characteristics of Tj(k, ω). We show in figure 2 the magnitude of Tj using vβ = 1 mm s−1 and Γ = 1 s−1 for different spatio-temporal frequencies k and f = ω/2π.
Figure 2.
Frequency characteristics of the component transfer functions for vβ = 1 mm s−1 and Γ = 1 s−1. Each panel shows a contour plot in logarithmic scale of (a) |T1(k, ω)|2, (b) |T2(k, ω)|2, (c) |T3(k, ω)|2, (d) |T4(k, ω)|2, (e) |T5(k, ω)|2 and (f)  Broken lines indicate maximums for different values of k and colour bars show levels of values acquired. (Online version in colour.)
We observe the following relationships
| 4.1 |
and
| 4.2 |
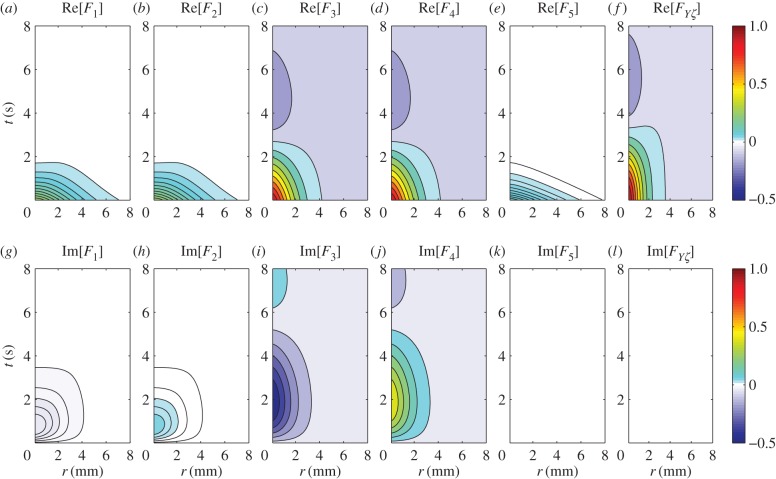
signifying responses of the same magnitude that are mirror images of each other with respect to ω = 0. This remark can be further illustrated in coordinate space by taking the inverse Fourier transform  where
where  is the inverse Fourier transform operator, as plotted in figure 3. Figure 3 shows that
  where F* denotes the complex conjugate of F, verifying that they represent travelling waves of the same speed but propagating in opposite directions. Also, we observe that F3–F5 are local and non-propagating responses; with F3 and F4 having the same magnitude but opposite phases (because
  ), whereas F5 is real-valued having low amplitude.
Figure 3.
Real and imaginary parts of Fj(r, t) for vβ = 1 mm s−1 and Γ = 1 s−1. Each panel shows a contour plot normalized to the maximum of Re[FYζ(r, t)] as indicated by the colour bars. (a) Re[F1(r, t)], (b) Re[F2(r, t)], (c) Re[F3(r, t)], (d) Re[F4(r, t)], (e) Re[F5(r, t)], (f) Re[FYζ(r, t)], (g) Im[F1(r, t)], (h) Im[F2(r, t)], (i) Im[F3(r, t)], (j) Im[F4(r, t)], (k) Im[F5(r, t)] and (l) Im[FYζ(r, t)], where  Note that Im[F5(r, t)] and Im[FYζ(r, t)] are zero everywhere. (Online version in colour.)
The broken lines in figure 2 show the maximums of |Tj(k, ω)|2 representing resonances that indicate where the BOLD response Y will preferentially oscillate. For each k value, the broken lines predict a corresponding temporal resonance frequency fj,res = ωj,res/2π. The general form or value of ωj,res is exactly solved by taking the partial derivative of |Tj(k, ω)|2 with respect to ω and equating it to zero. This results in
| 4.3 |
where Re[·] denotes taking the real part and the explicit forms of ωj(k) are given in equations (3.12)–(3.16).
Using parameters vβ = 1 mm s−1 and Γ = 1 s−1, and nominal values for the constants, the relation 
 is valid, such that
  and
and  For k-values where
 ω1,res and ω2,res vary almost linearly with k as shown by the broken lines in figure 2a,b. In addition, using ωf = 0.56 s−1 (table 1), the resonances ω3,res/2π = −0.089, ω4,res/2π = +0.089 and ω5,res = 0 Hz are the specific frequencies of the broken lines in figure 2c,d,e, respectively. Moreover, the resonances for the total transfer function in figure 2f occur at all resonance frequencies observed for its components.
4.2. Power spectra
In this section, we examine the spectral distribution of power in Tj(k, ω). We do this by calculating the temporal power spectrum  and spatial power spectrum
  as follows
 |
4.4 |
and
| 4.5 |
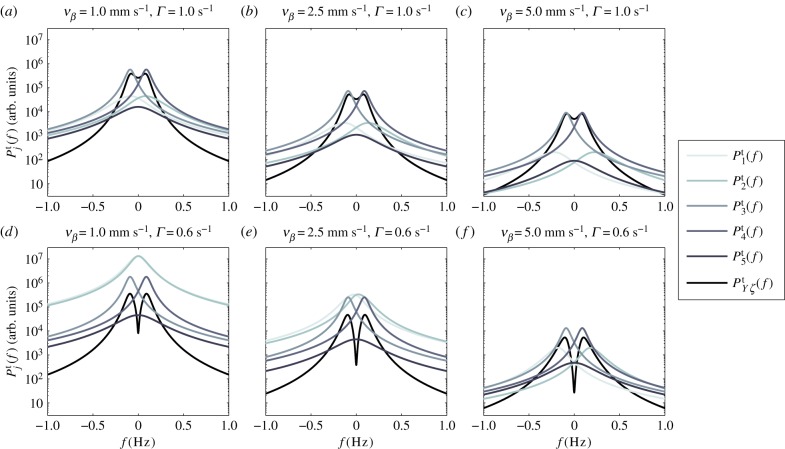
In figure 4, we plot the temporal power as a function of frequency f = ω/2π for different pairs of vβ and Γ. We observe that each Tj(k, ω) has high temporal power at low frequencies, characteristic of a low-pass filter and consistent with the findings of experiments [14] and the blood volume fluctuation transfer function predicted by the balloon model [21]. We also see that by independently increasing vβ and Γ, the amplitudes of all spectra decreases. However, higher Γ broadens  and
and  but does not change the shape of
 and
and  Moreover, it increases the low-frequency (near f = 0 Hz) value of
  because it causes the response to be more localized, thus it has a higher amplitude at its centre. Furthermore, each
  reaches peak values at certain resonance frequencies
  The value of
  can generally be calculated by taking the derivative of
  with respect to ω and equating it to zero, which results in
 |
4.6 |
where Re[·] denotes taking the real part. For j = 3, 4, 5, where ωj is independent of k, the solution for equation (4.6) can be obtained analytically such that
| 4.7 |
which coincides with the results of our resonance calculation in equation (4.3). Upon substitution of nominal parameter values, we get 
 and
and  which give the frequencies of the peaks of
 and
and  in figure 4. However, for j = 1, 2, where ωj is k-dependent, equation (4.6) is not analytically tractable and we need to use numerical methods to get the exact values of
  and
and  However, for cases when
  such as for vβ –Γ pairs (1.0 mm s–1, 0.6 s–1) and (2.5 mm s–1, 0.6 s–1),
  which is evident in figure 4d,e. We further note that
  and
and  move to higher values as vβ and Γ are increased.
Figure 4.
Temporal power  on a logarithmic scale as a function of f = ω/2π for various combinations of vβ and Γ. Increasing colour shade from light to dark represents data for


 and
and  respectively. The parameters used in (vβ, Γ) format are: (a) (1.0 mm s–1, 1.0 s–1), (b) (2.5 mm s–1, 1.0 s–1), (c) (5.0 mm s–1, 1.0 s–1), (d) (1.0 mm s–1, 0.6 s–1), (e) (2.5 mm s–1, 0.6 s–1) and (f) (5.0 mm s–1, 0.6 s–1). (Online version in colour.)
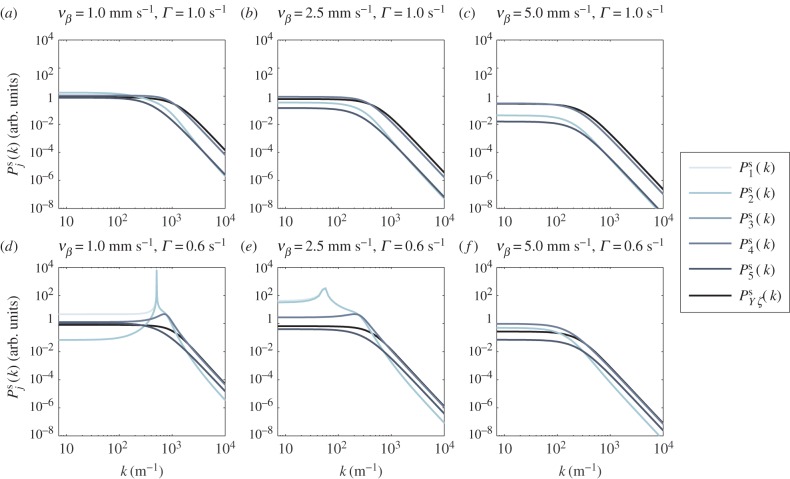
On the log–log scale used in the plot of spatial power versus spatial frequency k shown in figure 5, the general shape of  for Γ = 1 s−1 is constant at low k and asymptotically approaches a power law of exponent –4 for higher k as expected from our theoretical formulae. The transition point between the flat and decreasing spectral regions moves to lower k as vβ increases, because the haemodynamic waves are able to propagate faster and are not limited to local dynamics. For Γ = 0.6 s−1 combined with vβ = 1 mm s−1 or 2.5 mm s–1, the constant-to-power law transition still occurs for
  and
and  However, for

 and
and  we see a constant spectrum for lower k followed by a maximum at an intermediate k before it decreases with an asymptotic power law of exponent –4 for higher k. The frequency
  of the maximum, if it exists, can generally be calculated by taking the derivative of
  with respect to k and equating it to zero, which yields
| 4.8 |
 |
4.9 |
| 4.10 |
Upon substitution of nominal parameter values, equations (4.8)–(4.10) predict the frequencies of the peaks in figure 5. In §4.3, we study the mechanism behind the occurrence of maximum spatial power by relating  to the resonances of aj(k).
Figure 5.
Log–log plot of the spatial power  as a function of k for various combinations of vβ and Γ. Increasing colour shade from light to dark represents data for


 and
and  respectively. The parameters used in (vβ, Γ) format are: (a) (1.0 mm s–1, 1.0 s–1), (b) (2.5 mm s–1, 1.0 s–1), (c) (5.0 mm s–1, 1.0 s–1), (d) (1.0 mm s–1, 0.6 s–1), (e) (2.5 mm s–1, 0.6 s–1) and (f) (5.0 mm s–1, 0.6 s–1). Note that
  lie on top of
  for all panels, whereas
  lie on top of
  for panels (a)–(c) and (f). (Online version in colour.)
4.3. Singularity of aj(k)
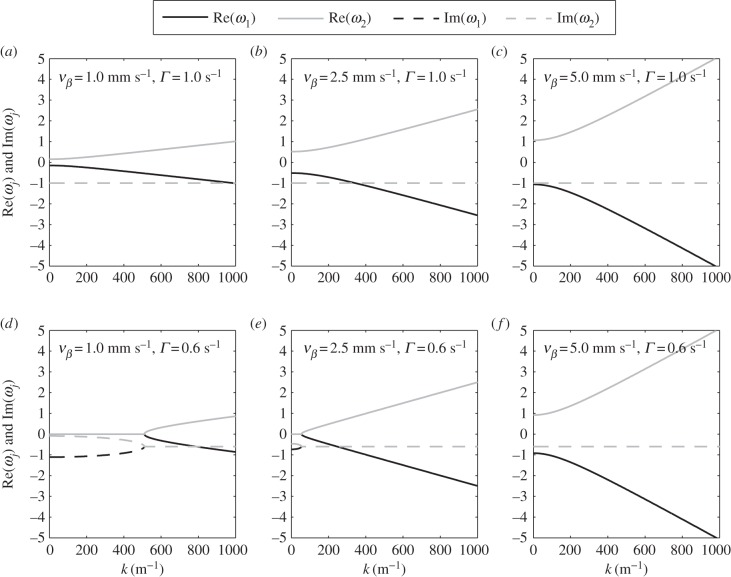
The form of aj(k) in equation (3.17) is proportional to [ωj(k) − ωm(k)]−1 which will produce singularities if ωj(k) = ωm(k) for j ≠ m. This is not applicable for j, m = 3, 4, 5, because ω3, ω4 and ω5 are k-independent constants having different values. However, for the case of j, m = 1, 2, ω1(k) and ω2(k) are k-dependent quantities that have the same value at a critical spatial frequency kc. In figure 6d,e, we simultaneously plot the real and imaginary parts of ω1(k) and ω2(k) and show that a solution for kc exists when Γ = 0.6 s−1 and vβ ≤ 2.5 mm s−1. We also observe that the real parts of ω1(k) and ω2(k) remain zero for k ≤ kc, showing that the poles are purely imaginary and correspond to damped responses. However, in figures 6a,b,c,f, where vβ and Γ are varied,  for all k. These results imply that the existence of kc depends strongly on the parameters vβ and Γ.
Figure 6.
Functional forms of ω1(k) and ω2(k) versus k for various combinations of vβ and Γ. Each panel shows the real (solid lines) and imaginary (dashed lines) parts of ω1(k) (black) and ω2(k) (grey). The parameters used in (vβ, Γ) format are: (a) (1.0 mm s–1, 1.0 s–1), (b) (2.5 mm s–1, 1.0 s–1), (c) (5.0 mm s–1, 1.0 s–1), (d) (1.0 mm s–1, 0.6 s–1), (e) (2.5 mm s–1, 0.6 s–1) and (f) (5.0 mm s–1, 0.6 s–1).
We can easily calculate the value of kc by setting ω1(kc) = ω2(kc). Substituting equations (3.12) and (3.13), the equality holds when
| 4.11 |
This result tells us that for Γ > kzvβ, kc is real such that ω1(k) can have the same value with ω2(k) in the real k-space; thus, singularity of aj(k) can be observed. To obtain an idea of the range of values kc may have, we show in figure 7 the values of kc for various combinations of vβ and Γ. Figure 7 shows a solid boundary line that separates the vβ – Γ parameter space into two regions where kc is either real or imaginary. The equation of the line is  which can be obtained by imposing kc = 0 and substituting the nominal values from table 1. The importance of this line is that we can immediately discern the nature of kc for a given pair of vβ and Γ even without calculating its explicit value. If the pair falls to the left side of the boundary line, kc is immediately real, and we would expect singularities in aj(k).
Figure 7.
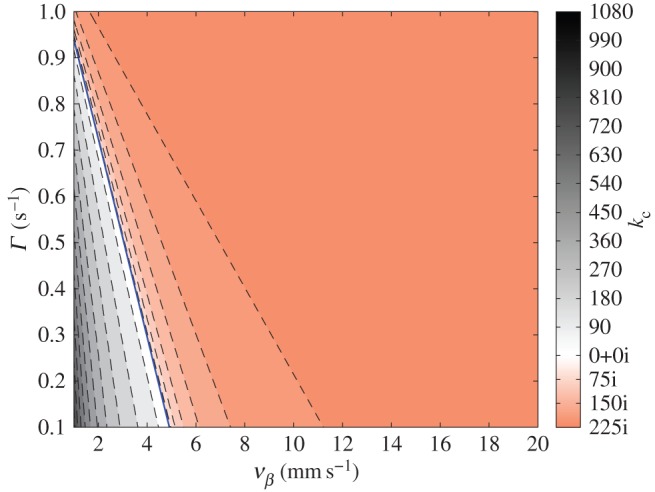
Contour plot of kc for various combinations of vβ and Γ. The solid line is a straight line with slope –k0 that divides the parameter space into real- and imaginary-valued kc. Contours to the left side of the solid boundary line represent cases when kc is real; while contours to the right side of the boundary line represent cases when kc is imaginary. Colour bar indicates level of values calculated. (Online version in colour.)
With the discovery of the boundary line in the vβ – Γ parameter space, it is easy to see that Γ = 1.0 s−1 combined with any vβ falls to the right side of the boundary line, thus leading to imaginary-valued kc. This will result in non-intersecting ω1(k) and ω2(k), as shown in figures 6b,c. The same analysis is true when Γ = 0.6 s−1 is paired with vβ = 5 mm s−1, as verified in figure 6f. However, when Γ = 0.6 s−1 is combined with any vβ < 2.58 mm s−1, they fall to the left side of the boundary line, thus kc is real and ω1(kc) = ω2(kc), as shown in figure 6d,e.
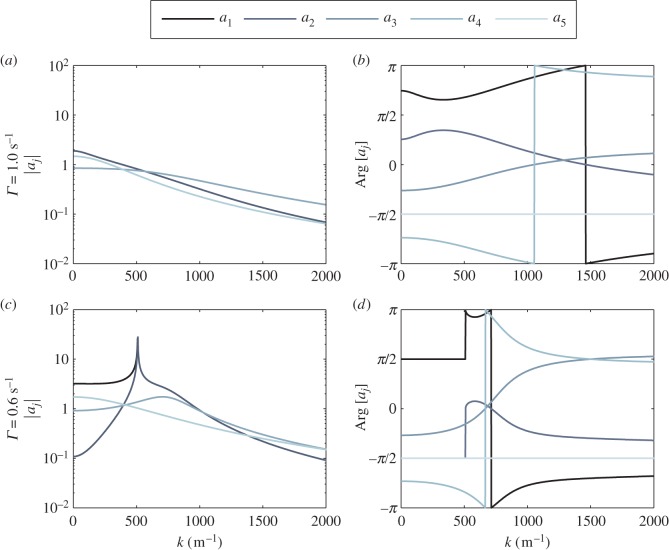
We now describe the behaviour of aj(k) in figure 8 by calculating its modulus and argument, using vβ = 1 mm s−1 and different damping rates. The damping rates chosen are Γ = 0.6 and 1.0 s–1 to investigate the properties of aj(k) when kc is either real or imaginary. In figure 8a,b, where vβ = 1 mm s−1 and Γ = 1.0 s−1, kc is imaginary, thereby leading to monotonic changes in |aj(k)|. Also, we see that |a1(k)| overlaps with |a2(k)|, as well as |a3(k)| with |a4(k)|, which can be attributed to the similarity in the forms of their corresponding poles. The discontinuous jumps in the plot of Arg[aj] are artefacts of the restriction of the range of Arg to [−π, π), and can easily be removed by translating the range to [0, 2π).
Figure 8.
Behaviour of aj(k) as a function of k using vβ = 1 mm s−1 and different Γ. Decreasing colour shade from dark to light represents data for a1, a2, a3, a4 and a5, respectively. (a) |aj| when Γ = 1.0 s−1, (b) Arg[aj] when Γ = 1.0 s−1, (c) |aj| when Γ = 0.6 s−1 and (d) Arg[aj] when Γ = 0.6 s−1. Note that for panel (a), the curves of a1 and a3 are exactly underneath a2 and a4, respectively, for all k. For panel (c), a3 is exactly underneath a4 for all k while a1 superimposes with a2 for k ≥ kc ≈ 510 m−1. (Online version in colour.)
On the other hand, for vβ = 1 mm s−1 combined with Γ = 0.6 s−1 (figure 8c,d), kc is real. This is why we see a sharp resonance for |a1(k)| and |a2(k)| at  where
where  is defined in equation (4.8). We also observe a resonance for |a3(k)| and |a4(k)| at
  with
with  from equation (4.9). These resonances are responsible for the occurrence of the peaks in the spatial power spectra in figure 5, because
  is proportional to aj(k).
5. Blood oxygen-level dependent response to a localized neural activity: Green function
In the previous sections, we analytically decomposed the total transfer function TYζ(k, ω) into components and analysed their characteristics, in order to retrieve and describe the underlying modes of oscillation of the BOLD response Y. We now want to explore the effects of the nature of these modes on the haemodynamic response. However, instead of calculating the effect of Tj(k, ω) on the BOLD response using the Fourier transform method of §2.3, we relate it to the Green function, also called the stHRF. In general, the Green function characterizes the response of a system to the presence of an impulse source. Because any distribution of source can be written as a combination of impulse sources, knowing how the system reacts to an impulse source provides significant information as to how the system will react to a distribution of source. In this paper's context, the two-dimensional Green function G(r, t) is the BOLD response to neural activity that is localized in space and time, i.e.
| 5.1 |
where δ(·) is the Dirac delta function. Once we have the Green function, we can immediately find the two-dimensional BOLD response Y(r, t) to an arbitrary stimulus ζ(r, t) by performing a convolution over space and time, with
 |
5.2 |
where ⊗ is the convolution operator and the integrals are over all space r′ and time t′. This is an alternative to the Fourier transform method of equation (2.11). The same principle is used to get the one-dimensional BOLD response Y(x, t) from the one-dimensional Green function G(x, t). In this section, we describe the integral forms of the Green function corresponding to each transfer function component. We also analytically derive closed forms of the Green function components for poles ω3, ω4 and ω5, which will significantly reduce the complexity of calculating the BOLD response in applications.
5.1. General form of the Green function
Here we describe how to calculate the Green function corresponding to Tj(k, ω). We start by considering that the Fourier transform of equation (5.1) is ζ(k, ω) = 1. When substituted in equation (2.11), this gives the general integral form of the two-dimensional Green function G(r, t) as
 |
5.3 |
which shows that the Green function is just the inverse Fourier transform of the transfer function. Following the decomposition of TYζ(k, ω) and Y(r, t) in equations (3.1) and (3.18), respectively, we can express the Green function as the linear sum
 |
5.4 |
where
 |
5.5 |
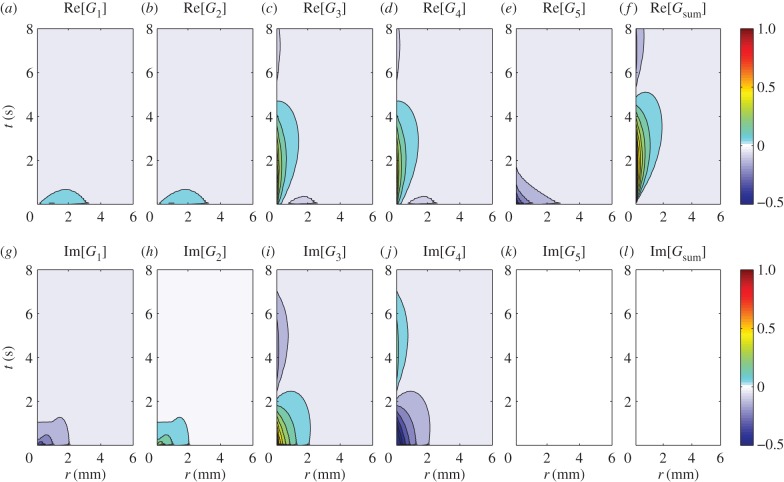
Figure 9 shows the two-dimensional Green function components Gj(r, t) in coordinate space using  and
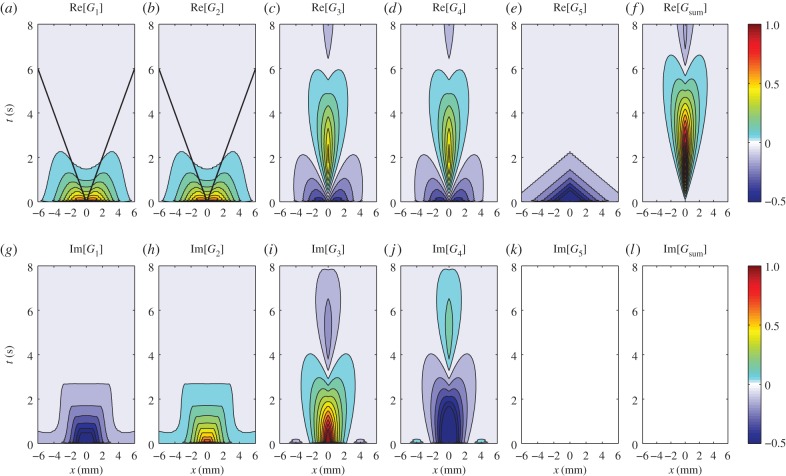
and  We first note that G1(r, t) and G2(r, t) have wave-like responses propagating in a small spatial range with speeds comparable to vβ. The structure of the wavefronts will be seen more clearly in one dimension (figure 10a,b) as the waves are able to propagate further in space because they only spread in one direction, as opposed to two for two dimensions. Thus, the effective amplitude of a one-dimensional wave will fall off proportional to
  instead of
  for two dimensions. On the other hand, G3(r, t), G4(r, t) and G5(r, t) remain as non-propagating responses, agreeing with the results of §4.1. Surprisingly, G1(r, t)–G4(r, t) have non-zero imaginary parts, whereas G5(r, t) is negative and purely real. This does not follow a simple expectation that the components must be real-valued functions, because the total Green function Gsum(r, t) is real. However, upon closer inspection, we find that the components follow the relations:

 and
and  where Re[·] and Im[·] denote taking the real and imaginary parts, respectively. Thus, the combined responses
  and
and  produce real-valued functions and can potentially be related to observable haemodynamic quantities. These results account for why the total BOLD response Gsum(r, t) remains real (figures 9f,l).
Figure 9.
Real and imaginary parts of the two-dimensional Green function components Gj(r, t), where r = |r|, for vβ = 1 mm s−1 and Γ = 1 s−1. Each panel shows a contour plot of the response normalized to the maximum of Re[Gsum(r, t)] as indicated by the colour bars. (a) Re[G1(r, t)], (b) Re[G2(r, t)], (c) Re[G3(r, t)], (d) Re[G4(r, t)], (e) Re[G5(r, t)], (f) Re[Gsum(r, t)], (g) Im[G1(r, t)], (h) Im[G2(r, t)], (i) Im[G3(r, t)], (j) Im[G4(r, t)], (k) Im[G5(r, t)] and (l) Im[Gsum(r, t)], where  Note that Im[G5(r, t)] and Im[Gsum(r, t)] are zero everywhere. (Online version in colour.)
Figure 10.
Real and imaginary parts of the one-dimensional Green function components Gj(x, t) for vβ = 1 mm s−1 and Γ = 1 s−1. Each panel shows a contour plot of the response normalized to the maximum of Re[Gsum(x, t)] as indicated by the colour bars. (a) Re[G1(x, t)], (b) Re[G2(x, t)], (c) Re[G3(x, t)], (d) Re[G4(x, t)], (e) Re[G5(x, t)], (f) Re[Gsum(x, t)], (g) Im[G1(x, t)], (h) Im[G2(x, t)], (i) Im[G3(x, t)], (j) Im[G4(x, t)], (k) Im[G5(x, t)] and (l) Im[Gsum(x, t)], where  Note that Im[G5(x, t)] and Im[Gsum(x, t)] are zero everywhere. Solid straight lines in panels (a) and (b) serve as guides for wavefronts moving in both directions with speeds of vβ = 1 mm s−1. (Online version in colour.)
Another interesting result is the non-zero response of Gj(r, t) at t = 0 and  (figure 9a–e,g–k). These non-zero responses appear even though the neural stimulus used to get the Green functions is localized and non-zero only at t = 0 and r = 0 and seem to violate causality. However, we verify that they are not artefacts of the numerical implementation of equation (5.5). We then tried adding G1(r, t)–G5(r, t) and found that the responses at t = 0 and r ≠ 0 perfectly cancel each other to produce the expected zero response of Gsum(r, t) at t = 0 for any r ≠ 0 (figure 9f).
Finally, we emphasize that the behaviour of Gj(r, t) we see in figure 9 is general but the exact spatio-temporal variation depends strongly on the chosen properties of the vasculature, particularly the wave propagation speed vβ and damping rate Γ; the spatial range of the responses increases for higher vβ and decreases for higher Γ.
Similarly, the Green function in one dimension G(x, t) is
 |
5.6 |
where
| 5.7 |
Figure 10 shows the one-dimensional Green function components Gj(x, t) in coordinate space using vβ = 1 mm s−1 and Γ = 1 s−1. We see that Gj(x, t) has a symmetric activity on both sides of x = 0 but the shape is generally similar to its two-dimensional counterpart Gj(r, t). However, the responses are stronger and have larger spatio-temporal extent, in agreement with the findings of [13,15]. We also note that G1(x, t) and G2(x, t) still correspond to travelling waves with propagation speeds comparable to vβ, because the wavefronts move almost parallel to the guide line shown in figure 10a,b, whereas G3(x, t), G4(x, t) and G5(x, t) are non-propagating responses, similar to the findings of figure 9. More importantly, we still see the unique characteristics of the components such as (i) non-zero imaginary parts for G1(x, t)–G4(x, t) and (ii) the paradoxical non-zero response of Gj(x, t) at t = 0 and x ≠ 0. The imaginary parts then cancel each other such that G1(x, t) + G2(x, t) and G3(x, t) + G4(x, t) are real. In addition, combining all Gj(x, t), the response at t = 0 and x ≠ 0 vanishes as expected for the BOLD response (figure 10f,l).
The results we get from the two- and one-dimensional Green functions provide a comprehensive picture of the features we would expect from a BOLD response. We show both cases here to better appreciate that our theory can be compatible with future fMRI experiments, which may be measured in a preferred dimensionality (either two- or one dimension), as what we will illustrate in §6.
5.2. Simplifying the integral form of the Green functions
In §5.1, we derived the integral form of the Green function. Because we know the general form of the component transfer function Tj, we can reduce the complexity of equations (5.5) and (5.7) by analytically evaluating the ω integral. In this section, we show how this can be done using contour integration.
For the two-dimensional case, the transfer function Tj(k, ω) is radially symmetric in k, thus Gj(r, t) will also be radially symmetric such that equation (5.5) becomes
| 5.8 |
with r = |r| and J0(kr) is the zeroth-order Bessel function of the first kind [29]. Upon substituting equation (3.2) into (5.8), we get
| 5.9 |
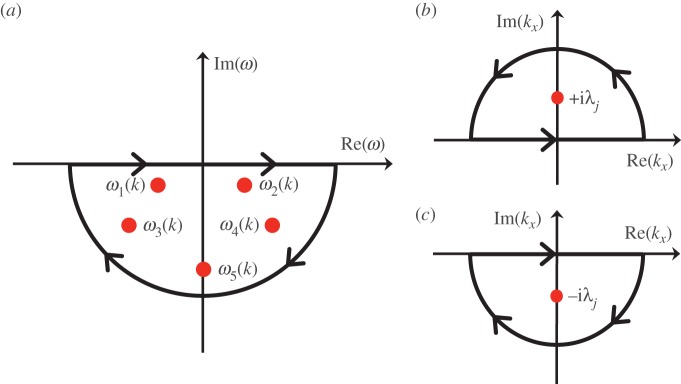
The ωj poles in equations (3.12)–(3.16) lie in the lower half of the complex plane, so we evaluate the ω integral using Cauchy residue theorem and the contour shown in figure 11a to enclose ωj(k). This simplifies Gj(r, t) to
| 5.10 |
where  is the Heaviside function that expresses causality. Equation (5.10) is known as the Hankel transform and is less complex and faster to evaluate than the three-dimensional Fourier transform in equation (5.5). Many numerical implementations are available in the literature that can evaluate the Hankel transform efficiently, such as the method proposed in [30].
Figure 11.
Path of integration to evaluate the complex integrals in: (a) equations (5.9) and (5.11), (b) equation (5.21) for the x > 0 case and (c) equation (5.21) for the x < 0 case. Each panel shows a semicircle contour in the complex plane to enclose the related poles represented as dots. (Online version in colour.)
For the one-dimensional case, we substitute equation (3.2) into (5.7) and rearrange to get
| 5.11 |
As in the two-dimensional case, we evaluate the ω integral using the contour in figure 11a and simplify Gj(x, t) to
| 5.12 |
Equation (5.12) is a single Fourier transform and is less complex and faster to evaluate than the two-dimensional Fourier transform in equation (5.7).
5.3. Analytic derivation of the Green function for j = 3, 4 and 5
Equations (3.14)–(3.16) imply that for j = 3, 4, 5, the  are independent of k, so that we can write
  This allows us to derive analytical closed forms for G3–G5. We begin by expressing equation (3.17) as a product of k-independent and k-dependent terms, as follows
 |
5.13 |
where the term in the curly brackets is k-dependent. Substituting equations (3.12) and (3.13) into (5.13), we find
 |
5.14 |
for j = 3, 4 and 5. If we define, the constant
| 5.15 |
we can rewrite equation (5.14) as
 |
5.16 |
For the two-dimensional case, we substitute equation (5.16) into (5.10) and rearrange to obtain
 |
5.17 |
Consider the instance when
| 5.18 |
where Re[·] denotes taking the real part. Equation (5.18) implies that  An integral relation, only true for
  and
and  is
is
 |
5.19 |
where K0 is the zeroth-order modified Bessel function of the second kind [31]. Using equation (5.19), the closed-form solution of equation (5.17) becomes
 |
5.20 |
For situations where condition in equation (5.18) is not satisfied, that is  our derivation is still valid upon using the transformation
For the one-dimensional case, we substitute equation (5.16) into (5.12) and rearrange to obtain
 |
5.21 |
For x > 0, we can evaluate equation (5.21) by using the Cauchy residue theorem and the contour shown in figure 11b to enclose the pole  This results in
 |
5.22 |
On the other hand, for x < 0, we use the contour in figure 11c to enclose the pole  This results in
 |
5.23 |
Combining the results of equations (5.22) and (5.23), the closed-form solution of equation (5.21) is
 |
5.24 |
We emphasize that the analytical forms of equations (5.20) and (5.24) are only true for j = 3, 4 and 5, because they correspond to the k-independent poles, which is required for our derivation to work. Furthermore, we verified that for any νβ and Γ value, equations (5.20) and (5.24) perfectly match the results when equations (5.5) and (5.7) are numerically integrated using fast Fourier transform, serving as a check of the accuracy of our results. We can use these analytical results to significantly reduce the complexity of determining the BOLD response to an arbitrary neural stimulus, because our remaining task is only to numerically solve for G1 and G2 instead of all five Gj.
6. Illustrative applications
We showed in §3.2 that decomposing the linear BOLD transfer function into components  allowed us to recover the components Yj of the linear BOLD response to a neural drive, each corresponding to a mode of frequency ωj(k). The components Tj are then used to analytically derive the Green function component Gj, both in two dimensions and in one dimension, that will significantly reduce the complexity of calculating the BOLD response to any neural drive. In this section, we illustrate how our theoretical derivations can be used to calculate the components of the haemodynamic response to a specific neural stimulus; in this case, we use a spatio-temporal Gaussian neural stimulus. We also show an example neural stimulus, a spatio-temporally varying sinusoidal stimulus, that can potentially enhance a BOLD response component of interest. For illustration purposes, we will restrict our analysis to one-dimensional haemodynamics.
6.1. Haemodynamic response to a spatio-temporal Gaussian neural stimulus
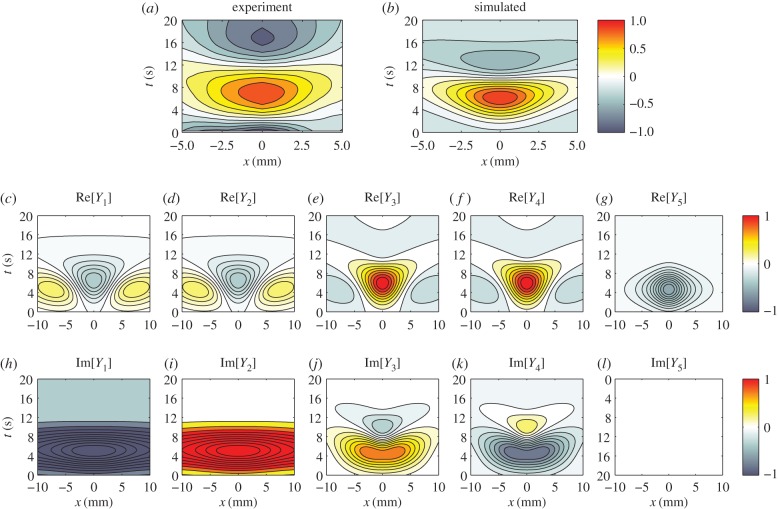
In this section, we obtain the spatio-temporal haemodynamic response to a neural stimulus that is localized and low in amplitude. This kind of stimulus has been shown to produce a linear BOLD response on the human visual area V1. To test the model results experimentally, we compare our theory with fMRI data previously collected from a visual experiment [13]. In that study, the authors used a visual stimulus consisting of flickering concentric rings to measure the linear BOLD response on V1. They then used a wavefront phase estimation technique to quantitatively obtain the speed and damping rate of the haemodynamic waves observed for each subject. We use their estimations of vβ and Γ to predict the BOLD response of one subject and compare with their data. We will then study the properties of the resulting decomposed BOLD components.
We model the stimulus mathematically as
| 6.1 |
where σx and σt are the spatial and temporal widths, respectively, and t0 is a temporal parameter to match the neural stimulus' centre. In this case, we use  and
and  to have fixed full widths at half maximum of 2 mm and 2 s, and fix t0 = 4 s, to emulate the neural response elicited by the experiment of [13]. We then convolve equation (6.1) with the one-dimensional Green functions (equations (5.12) and (5.24)), using vβ = 2.01 mm s−1 and Γ = 0.72 s−1, to get the responses for one subject as shown in figure 12. Note that the chosen values of the parameters vβ and Γ are taken from the experimental estimates of [13].
Figure 12.
Experimental and simulated BOLD response to a spatio-temporal Gaussian stimulus. Each panel shows a contour plot in x (distance from centre of stimulus) and t (time from stimulus onset) space of the normalized response as indicated by the colour bars. (a) Experimental BOLD response, (b) simulated BOLD response using parameters vβ = 2.01 mm s−1 and Γ = 0.72 s−1 fitted to experiment, whereas the components of the simulated BOLD response are (c) Re[Y1(x, t)], (d) Re[Y2(x, t)], (e) Re[Y3(x, t)], (f) Re[Y4(x, t)], (g) Re[Y5(x, t)], (h) Im[Y1(x, t)], (i) Im[Y2(x, t)], (j) Im[Y3(x, t)], (k) Im[Y4(x, t)] and (l) Im[Y5(x, t)]. Note that Im[Y5(x, t)] is exactly zero everywhere. (Online version in colour.)
We first note that the time to peak of the simulated BOLD response in figure 12b has a small offset relative to the experimental data in figure 12a. We attribute this temporal discrepancy to potential factors such as influences of astrocytic delays and other neurovascular coupling processes [32,33]. Incorporating these factors requires additional theoretical groundwork and is beyond the scope of this paper. However, we will implement model extensions related to astrocyte activity in a subsequent study to improve fits.
If we disregard the small temporal discrepancy, the general shape of the simulated response is similar to the result of the experiment especially in replicating the spatio-temporal width of the positive part of the signal. This demonstrates that the neural stimulus chosen is well grounded.
To study the components, we extended the spatial region of interest from [–5, 5] to [–10, 10] mm to be able to note obscured properties away from the origin. The responses show similar dynamics to the Green function components in figures 9 and 10, but with notable increases in spatial and temporal extent. In particular, Y1 and Y2 still correspond to travelling wave components, whereas Y3–Y5 correspond to non-propagating components of the BOLD signal. Moreover, Y1–Y4 have non-zero imaginary parts and follow the relations: 

 and
and  where Re[·] and Im[·] denote taking the real and imaginary parts, respectively. These relations enable the imaginary parts of Y1–Y4 to cancel each other producing real functions Y1 + Y2 and Y3 + Y4 resulting to a BOLD signal that is purely real. From this decomposition, we can clearly see that the local dynamics near x = 0 of the simulated BOLD response is dictated by the non-propagating components, whereas the spatial extent is highly influenced by the travelling wave component. This provides an exhaustive picture of the constituents of the BOLD response.
6.2. Enhancement of blood oxygen-level dependent response components
One of our goals is to demonstrate the potential to selectively enhance or suppress particular modes that underlie the BOLD response. We show in this section one way to enhance the relative amplitude of a BOLD response component by using a moving spatio-temporal sinusoid as neural stimulus. We mathematically model the neural stimulus as
| 6.2 |
where ks and ωs are the real-valued spatial and temporal frequencies of the stimulus, respectively. In frequency space, the Fourier transform of equation (6.2) is a combination of Dirac delta functions
| 6.3 |
In order to get the jth component of the BOLD response, we either convolve equation (6.2) with Gj(x, t) or substitute equation (6.3) into equation (3.23), resulting in
| 6.4 |
We further simplify equation (6.4) by substituting equation (3.2) and exploiting the fact that aj(k) and ωj(k) are even functions, to get
| 6.5 |
where aj(k) is defined in equation (3.17). Equation (6.5) can be simplified to
 |
6.6 |
and we can separate  into its real and imaginary parts, with
 |
6.7 |
We can see from equation (6.6) that there are two ways to enhance the response of Yj(x, t). First, we can vary the spatial frequency ks of the neural stimulus such that it is tuned to the resonance of aj(k). That is, we use  where
where  is the analytical resonance frequency we derived in equations (4.8)–(4.10). However, for pairs of vβ and Γ where
 becomes imaginary and this technique will not be applicable. Second, we can manipulate the temporal frequency ωs to minimize the denominator of equation (6.6), such that
  However, because ωs is real-valued, it can only have
  as its limiting value.
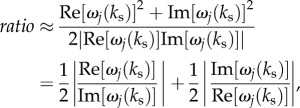
We can approximate the degree of enhancement of the second method by taking the ratio of the absolute value of equation (6.6) when  to its value when the stimulus is almost stationary in time; ωs is very small or
  An approximate value of this ratio at positions and times where
  and
and  is
is
 |
6.8 |
which always greater than 1 for any j. Note that ratio is a constant for j = 3, 4 and 5, because ω3, ω4 and ω5 are constants. For j = 1 and 2,  for very weak or very strong damping of ω1(ks) and ω2(ks). This proves that a sinusoidal stimulus is able to enhance the response of the jth component of the BOLD response, as long as its frequency is tuned appropriately. This illustrative application will be implemented in future works to test its accuracy.
7. Summary and conclusions
We have analysed the transfer function from a physiologically based poroelastic haemodynamic model [13–15], to provide a deeper understanding of the linear BOLD response to neural activity. In particular, we have developed quantitative tools to uncover the fundamental components that contribute to the overall structure of the haemodynamic response to a localized impulse input. The main results of this study are as follows:
(i) We analytically decomposed the linear BOLD transfer function into components corresponding to frequency poles via partial fractions. The poles are responsible for resonances of the transfer function and are associated with modes of the BOLD response. Each mode has a distinct dispersion relation, as shown in equation (3.3).
(ii) The derived component transfer functions were characterized in terms of frequency responses, power spectra and calculation of resonances. We found from the frequency responses that the BOLD transfer function consists of three components that are non-propagating and two components that represent waves travelling in opposite directions. Each component has resonance frequencies that we calculated analytically in equation (4.3) and illustrated in figure 2. Analysis of spatial and temporal power spectra show that the damping rate Γ restricts significant responses in r – t space to a localized region because it increases flow losses owing to blood drainage. We also found that the components have peak values tuned to selected frequencies
 and
and  ; exact values of which are shown in equations (4.6)–(4.10). The origin of the peak values is related to the properties of aj(k). Because aj(k) is proportional to the inverse of the differences of ωj(k) pairs, critical spatial frequencies kc where the equality ω1(k) = ω2(k) is achieved can lead to resonances that enhance the responses. We further showed how kc changes, from real to imaginary values, as a function of propagation speed vβ and damping rate Γ.
(iii) We used the transfer function components to derive and decompose the BOLD response to a localized neural impulse—i.e. the Green function or stHRF. Our technique analytically decomposes the Green function into component responses that can be related to different physiological phenomena. This provides an efficient method to calculate the linear BOLD response to any kind of neural activity that is less complex and faster to implement than direct Fourier transform methods.
(iv) The analytical results were used to demonstrate how the BOLD response to a spatio-temporal Gaussian neural stimulus can be decomposed into response components. For spatial and temporal widths of the stimulus matching the analysis of an experiment by [13], we decomposed the linear BOLD response into travelling waves and non-propagating components, which enabled us to clearly identify the origin of the shape and characteristics of the BOLD response in terms of underlying physiology.
(v) An illustrative application was provided to show how a moving sinusoidal neural stimulus can be used to alter the effect of different components of the BOLD response. This was done by tuning the spatial and temporal frequencies of the stimulus to the preferred resonance frequencies of particular components. We estimated the potential increase in the response and quantitatively showed that our method is capable of enhancing the component corresponding to the chosen resonance frequency.
Overall, our present work establishes new methods to quantitatively understand the spatio-temporal properties of haemodynamic responses to various neural stimuli. It provides basis for further analyses and predictions for comparison with experiment. For example, it has the potential to aid in designing experiment protocols that can selectively enhance or suppress spatio-temporal resonances to increase or decrease signal amplitude of some responses. One could potentially design a visual stimulus, such as a contrast-reversing grating with sinusoidal contrast modulation [34], to elicit a neural response similar to the example in §6.2 and highlight the corresponding BOLD response component. In addition, because we found that the BOLD response consists of wave-like and non-propagating components, our results can also be used to design experiments to improve measurement of vascular properties such as vβ and Γ by exploring the wave components of the BOLD response and disregarding the non-wave components.
Another promising application is to derive the modes underlying the BOLD response to different types of stimulus. A recent study by [35] developed a method, based on the model we used, to deconvolve fMRI data and extract spatio-temporal patterns of neural activity. The formulated deconvolution technique would be able to separate neural and haemodynamic contributions on fMRI maps to gain insights of various physiological phenomena such as detection of stimulus orientation in human primary visual cortex [36]. This is crucial to obtain accurate neural activity maps that can disambiguate real neural dynamics from spatially distributed connectivity delays [37]. As advances in fMRI scanner hardware continue to improve, we can use the deconvolution technique to obtain an estimate of neural activity ζ. The estimated ζ can then be convolved with the Green function components Gj to calculate the response modes Yj. Exploration of this application and possible nonlinear BOLD dynamics is left for future work.
Acknowledgements
The authors thank Thomas Lacy for useful discussions.
Authors' contributions
P.A.R. proposed the decomposition method and showed substantial feasibility. J.C.P. carried out most subsequent theoretical work and all numerical work. All authors performed analysis and interpretation of results and drafted the manuscript. All authors gave final approval for publication.
Competing interests
The authors declare no competing interests.
Funding
This work was supported by the Australian Research Council Center of Excellence for Integrative Brain Function (ARC Center of Excellence Grant CE140100007), the Australian Research Council Laureate Fellowship Grant (FL140100025), and the Australian Research Council Discovery Project (DP130100437).
References
- 1.Kwong KK, et al. 1992. Dynamic magnetic resonance imaging of human brain activity during primary sensory stimulation. Proc. Natl Acad. Sci. USA. 89, 5675–5679. ( 10.1073/pnas.89.12.5675) [DOI] [PMC free article] [PubMed] [Google Scholar]
- 2.Ogawa S, Tank DW, Menon R, Ellermann JM, Kim SG, Merkle H, Ugurbil K. 1992. Intrinsic signal changes accompanying sensory stimulation: functional brain mapping with magnetic resonance imaging. Proc. Natl Acad. Sci. USA 89, 5951–5955. ( 10.1073/pnas.89.13.5951) [DOI] [PMC free article] [PubMed] [Google Scholar]
- 3.Hennig J, Speck O, Koch MA, Weiller C. 2003. Functional magnetic resonance imaging: a review of methodological aspects and clinical applications. J. Magn. Reson. Imaging 18, 1–15. ( 10.1002/jmri.10330) [DOI] [PubMed] [Google Scholar]
- 4.Buxton RB. 2009. Introduction to functional magnetic resonance imaging: principles and techniques. Cambridge, UK: Cambridge University Press. [Google Scholar]
- 5.Friston KJ. 2009. Modalities, modes, and models in functional neuroimaging. Science 326, 399–403. ( 10.1126/science.1174521) [DOI] [PubMed] [Google Scholar]
- 6.Buxton RB, Wong EC, Frank LR. 1998. Dynamics of blood flow and oxygenation changes during brain activation: the balloon model. Magn. Reson. Med. 39, 855–864. ( 10.1002/mrm.1910390602) [DOI] [PubMed] [Google Scholar]
- 7.Friston KJ, Mechelli A, Turner R, Price CJ. 2000. Nonlinear responses in fMRI: the balloon model, Volterra kernels, and other hemodynamics. Neuroimage 12, 466–477. ( 10.1006/nimg.2000.0630) [DOI] [PubMed] [Google Scholar]
- 8.Buxton RB, Uludauğ K, Dubowitz DJ, Liu TT. 2004. Modeling the hemodynamic response to brain activation. Neuroimage 23, S220–S233. ( 10.1016/j.neuroimage.2004.07.013) [DOI] [PubMed] [Google Scholar]
- 9.Kriegeskorte N, Cusack R, Bandettini P. 2010. How does an fMRI voxel sample the neuronal activity pattern: compact-kernel or complex spatiotemporal filter? Neuroimage 49, 1965–1976. ( 10.1016/j.neuroimage.2009.09.059) [DOI] [PMC free article] [PubMed] [Google Scholar]
- 10.Engel SA, Glover GH, Wandell BA. 1997. Retinotopic organization in human visual cortex and the spatial precision of functional MRI. Cereb. Cortex 7, 181–192. ( 10.1093/cercor/7.2.181) [DOI] [PubMed] [Google Scholar]
- 11.Schmuel A, Yacoub E, Chaimow D, Logothetis NK, Ugurbil K. 2007. Spatio-temporal point-spread function of functional MRI signal in human gray matter. Neuroimage 35, 539–552. ( 10.1016/j.neuroimage.2006.12.030) [DOI] [PMC free article] [PubMed] [Google Scholar]
- 12.Friston KJ. 1995. Regulation of rCBF by diffusible signals: an analysis of constraints on diffusion and elimination. Hum. Brain Mapp. 3, 56–65. ( 10.1002/hbm.460030106) [DOI] [Google Scholar]
- 13.Aquino KM, Schira MM, Robinson PA, Drysdale PM, Breakspear MJ. 2012. Hemodynamic traveling waves in human visual cortex. PLoS Comput. Biol. 8, e1002435 ( 10.1371/journal.pcbi.1002435) [DOI] [PMC free article] [PubMed] [Google Scholar]
- 14.Drysdale PM, Huber JP, Robinson PA, Aquino KM. 2010. Spatiotemporal BOLD dynamics from a porous elastic hemodynamic model. J. Theor. Biol. 265, 524–534. ( 10.1016/j.jtbi.2010.05.026) [DOI] [PubMed] [Google Scholar]
- 15.Aquino KM, Robinson PA, Drysdale PM. 2014. Spatiotemporal hemodynamic response functions derived from physiology. J. Theor. Biol. 347, 118–136. ( 10.1016/j.jtbi.2013.12.027) [DOI] [PubMed] [Google Scholar]
- 16.Wang HF. 2000. Theory of linear poroelasticity with applications to geomechanics and hydrogeology, 1st edn Princeton, NJ: Princeton University Press. [Google Scholar]
- 17.Shinners SM. 1998. Modern control system theory and design, 2nd edn New York, NY: John Wiley & Sons. [Google Scholar]
- 18.Mansouri R, Bettayeb M, Djennoune S. 2010. Approximation of high order integer systems by fractional order reduced-parameters models. Math. Comp. Model. 51, 53–62. ( 10.1016/j.mcm.2009.07.018) [DOI] [Google Scholar]
- 19.Grubb RL, Raichle ME, Eichling JO, Ter-Pogossian MM. 1974. The effects of changes in PaCO2 on cerebral blood volume, blood flow, and vascular mean transit time. Stroke 5, 630–639. ( 10.1161/01.STR.5.5.630) [DOI] [PubMed] [Google Scholar]
- 20.Stephan KE, Weiskopf N, Drysdale PM, Robinson PA, Friston KJ. 2007. Comparing hemodynamic models with DCM. Neuroimage 38, 387–401. ( 10.1016/j.neuroimage.2007.07.040) [DOI] [PMC free article] [PubMed] [Google Scholar]
- 21.Robinson PA, Drysdale PM, der Merwe HV, Kyriakou E, Rigozzi MK, Germanoska B, Rennie CJ. 2006. BOLD responses to stimuli: dependence on frequency, stimulus form, amplitude, and repetition rate. Neuroimage 31, 585–599. ( 10.1016/j.neuroimage.2005.12.026) [DOI] [PubMed] [Google Scholar]
- 22.Friston KJ, Harrison L, Penny W. 2003. Dynamic causal modelling. Neuroimage 19, 1273–1302. ( 10.1016/S1053-8119(03)00202-7) [DOI] [PubMed] [Google Scholar]
- 23.Trudnowski RJ, Rico RC. 1974. Specific gravity of blood and plasma at 4 and 37°C. Clin. Chem. 20, 615–616. [PubMed] [Google Scholar]
- 24.Huppert TJ, Hoge RD, Diamond SG, Franceschini MA, Boas DA. 2006. A temporal comparison of BOLD, ASL, and NIRS hemodynamic responses to motor stimuli in adult humans. Neuroimage 29, 368–382. ( 10.1016/j.neuroimage.2005.08.065) [DOI] [PMC free article] [PubMed] [Google Scholar]
- 25.Duvernoy HM, Delon S, Vannson JL. 1981. Cortical blood vessels of the human brain. Brain Res Bull. 7, 519–579. ( 10.1016/0361-9230(81)90007-1) [DOI] [PubMed] [Google Scholar]
- 26.Olman CA, Harel N, Feinberg DA, He S, Zhang P, Ugurbil K, Yacoub E et al. 2012. Layer-specific fMRI reflects different neuronal computations at different depths in human V1. PLoS ONE 7, e32536 ( 10.1371/journal.pone.0032536) [DOI] [PMC free article] [PubMed] [Google Scholar]
- 27.Tootell RB, Silverman MS, Switkes E, Valois RLD. 1982. Deoxyglucose analysis of retinotopic organization in primary striate cortex. Science 218, 902–904. ( 10.1126/science.7134981) [DOI] [PubMed] [Google Scholar]
- 28.Schira MM, Tyler CW, Breakspear MJ, Spehar B. 2009. The foveal confluence in human visual cortex. J. Neurosci. 29, 9050–9058. ( 10.1523/JNEUROSCI.1760-09.2009) [DOI] [PMC free article] [PubMed] [Google Scholar]
- 29.Gradshteyn IS, Ryzhik IM, Jeffrey A, Zwillinger D. 2007. Table of integrals, series, and products, 7th edn New York, NY: Academic Press. [Google Scholar]
- 30.Guizar-Sicairos M, Gutiérrez-Vega JC. 2004. Computation of quasi-discrete Hankel transforms of integer order for propagating optical wave fields. J. Opt. Soc. Am. A 21, 53–58. ( 10.1364/JOSAA.21.000053) [DOI] [PubMed] [Google Scholar]
- 31.Prudnikov AP, Brychkov YA, Marichev OI. 1986. Integrals and series volume 2: special functions. Amsterdam, The Netherlands: Gordon and Breach. [Google Scholar]
- 32.DeYoe EA, Bandettini P, Neitz J, Miller D, Winans P. 1994. Functional magnetic resonance imaging (FMRI) of the human brain. J. Neurosci. Methods 54, 171–187. ( 10.1016/0165-0270(94)90191-0) [DOI] [PubMed] [Google Scholar]
- 33.Masamoto K, Unekawa M, Watanabe R, Toriumi H, Takuwa H, Kawaguchi H et al. 2015. Unveiling astrocytic control of cerebral blood flow with optogenetics. Sci. Rep. 5, 11455 ( 10.1038/srep11455) [DOI] [PMC free article] [PubMed] [Google Scholar]
- 34.Ferree TC, Wade AR, Calvisi ML, Szeri AJ, Liley DTJ, Inglis BA et al. 2007. Experimental study of EEG and BOLD responses to sinusoidal contrast modulation. In Engineering in Medicine and Biology Workshop, 2007 IEEE Dallas, TX, 11–12 November, pp. 12–15. Piscataway, NJ: IEEE.
- 35.Aquino KM, Robinson PA, Schira MM, Breakspear MJ. 2014. Deconvolution of neural dynamics from fMRI data using a spatiotemporal hemodynamic response function. Neuroimage 94, 203–215. ( 10.1016/j.neuroimage.2014.03.001) [DOI] [PubMed] [Google Scholar]
- 36.Haynes JD, Rees G. 2005. Predicting the orientation of invisible stimuli from activity in human primary visual cortex. Nat. Neurosci. 8, 686–691. ( 10.1038/nn1445) [DOI] [PubMed] [Google Scholar]
- 37.Chang C, Thomason ME, Glover GH. 2008. Mapping and correction of vascular hemodynamic latency in the BOLD signal. Neuroimage 43, 90–102. ( 10.1016/j.neuroimage.2008.06.030) [DOI] [PMC free article] [PubMed] [Google Scholar]


