Abstract
Context: The impact of dietary protein on body composition changes after older adults purposefully lose weight requires systematic evaluation. Objective: This systematic review and meta-analysis assessed the effects of protein intake (<25% vs ≥25% of energy intake or 1.0 g/kg/d) on energy restriction–induced changes in body mass, lean mass, and fat mass in adults older than 50 years. Data Sources: PubMed, Cochrane, Scopus, and Google Scholar were searched using the keywords “dietary proteins,” “body composition,” “skeletal muscle,” and “muscle strength.” Study Selection: Two researchers independently screened 1542 abstracts. Data Extraction: Information was extracted from 24 articles. Data Synthesis: Twenty randomized control trials met the inclusion criteria. Conclusion: Older adults retained more lean mass and lost more fat mass during weight loss when consuming higher protein diets.
Keywords: aging, body composition, obesity, protein
INTRODUCTION
Older adults experience age-related changes in body composition, including increased body mass and fat mass and decreased lean mass, which includes skeletal muscle.1,2 Age-related loss of skeletal muscle mass, or sarcopenia, is associated with impaired mobility, increased risk of morbidity, and reduced quality of life in older adults.3 In addition to losing lean mass, older adults gain fat mass and the prevalence of overweight and obesity in the United States has progressively increased during the past 3 decades.4 The Centers for Disease Control and Prevention reported that the prevalence of obesity (body mass index ≥30 kg/m2) among adults 60 years and older in 2011–2012 was 35.4%.5 Obesity is associated with an increased risk of chronic diseases and a reduced physical functioning capacity, both of which contribute to disproportionately high healthcare expenditures and premature mortality.6–8 Furthermore, obesity may contribute to the loss of skeletal muscle mass or quality because of decreased physical activity, skeletal muscle inflammation, leptin resistance,9 or impaired skeletal muscle mammalian target of rapamycin signaling pathway,10 the key regulating pathway for skeletal muscle protein synthesis.11
Purposeful moderate dietary energy restriction (500–750 kcal/d energy deficit) is an effective way for overweight/obese adults to reduce body mass and fat mass and improve their health profile.12–14 However, on average, approximately 25% of the body mass lost by dietary energy restriction consists of lean mass.15,16 Exercise training and nutrition are potential determinants of the quality of body composition changes that occur with weight loss. Regarding exercise training, a recent systematic review strongly supports the effectiveness of aerobic and resistance exercise training to help men and postmenopausal women aged ≥50 years retain lean mass or reduce the loss of lean mass during diet-induced weight loss.15 Regarding nutrition, professional nutrition and obesity societies recommend moderate dietary energy restriction and a protein intake of 1.0 g per kilogram of body mass per day while dieting to prevent or improve medical complications associated with obesity.12 Higher total dietary protein intakes (1.2–1.5 g/kg/d) are reported to preserve lean mass and improve body composition during weight loss in young, middle-aged, and older adults when compared with normal protein intakes (0.8 g/kg/d).13,17–19 One meta-analysis study in young and middle-aged adults indicated that higher protein intakes promote positive body composition changes by retaining lean mass during energy restriction,20 but whether similar effects occur in older adults has not been systematically evaluated. Therefore, the present systematic review and meta-analysis of randomized control trials (RCTs) was conducted to assess and evaluate the effects of protein intake on dietary energy restriction–induced changes in body mass, lean mass, and fat mass in groups of adults with a mean age of 50 years and older.
METHODS
The current study followed the PRISMA (Preferred Reporting Items for Systematic Reviews and Meta-Analyses) guidelines.21 The description of the PICOS (population, intervention, comparison, outcome, and setting) criteria used to define the research question is presented in Table 1.
Table 1.
Description of the PICOS criteria used to define the research question
| Parameter | Description |
|---|---|
| Population | Adults mean age ≥50 y |
| Intervention | Groups who consumed energy-restricted diets with either ≥25% of energy intake from protein or protein of ≥1.0 g/kg/d during weight loss |
| Comparison | Groups who consumed energy-restricted diets with either <25% of energy intake from protein or protein of <1.0 g/kg/d during weight loss |
| Outcome | Changes in whole-body composition, including body mass, lean mass, and fat mass |
| Setting | Randomized controlled trials |
| Research question | What is the effect of higher dietary protein intake on whole-body composition changes after weight loss in older adults? |
Data sources
A computerized search of the literature was conducted on January 23, 2015, using PubMed (http://www.ncbi.nlm.nih.gov/pubmed), Cochrane (http://www.cochrane.org/), Scopus (http://www.scopus.com/), and Google Scholar (http://scholar.google.com/) databases. Search terms in PubMed included “dietary proteins” [MeSH] AND (“body composition” [MeSH] OR “muscle, skeletal" [MeSH] OR “muscle strength"[MeSH]), and the search was limited to “human,” “English,” and “adults (19+ years).” Inputted search terms in Google Scholar also included “dietary proteins” AND (“weight loss” OR “weight reduction") AND (“body composition” OR “skeletal muscle" OR “muscle strength”), and “English” was selected as a limitation. “Dietary proteins” AND (“body composition” OR “skeletal muscle” OR “muscle strength”) were used as search strings for Scopus and Cochrane. Reference lists of the articles identified via the PubMed search as well as those of a previously published meta-analysis20 and a meta-regression22 were reviewed to identify additional relevant articles.
Inclusion criteria
Inclusion criteria were as follows: RCT; subject mean age ≥50 years; weight loss via dietary energy restriction only (no concurrent exercise training); protein intake modified by protein supplementation and/or a prescribed higher protein diet; and use of an acceptable method of body composition assessment. Acceptable methods were dual-energy X-ray absorptiometry (DXA), air-displacement plethysmography, hydrostatic weighing, and assessment of total body potassium or deuterated water, since these are considered reliable and valid methods to detect lean mass changes in older, overweight, and obese adults during weight loss.23–27
Article selection and data extraction
All searches combined yielded 1536 results (PubMed: 708; Cochrane: 2; Scopus: 109; and Google Scholar: 717), and 6 additional relevant articles were identified from other reference lists. All abstracts were independently obtained and screened by the primary reviewer (J.E.K.) and the secondary reviewer (L.E.O.). Of the 1542 articles, 1518 were excluded for the following reasons: study was not a dietary-protein-related RCT; subject mean age was <50 years or no mean age was reported; study contained no dietary energy restriction; no lean mass measure was reported or lean mass was reported only graphically; or study used an unacceptable method of body composition assessment, such as bioelectrical impedance or skinfold thickness.28,29 The full texts of the 24 eligible articles were independently assessed by the primary and secondary reviewers to further assess inclusion eligibility and to avoid selection bias. Four of the 24 articles were excluded because they did not report primary outcomes, so 20 RCTs were used for this study (Figure 1). When possible, corresponding authors of the published articles were contacted via email to acquire unpublished data. When results for male and female subjects30,31 or high-protein intakes achieved using different sources of protein (chicken vs beef, whey protein vs mixed protein, respectively)14,32 were presented separately, they were treated as distinct interventions. In addition, results were included from studies in which postintervention measurements were obtained after a combined period of energy restriction and subsequent energy balance.30,31,33,34
Figure 1.
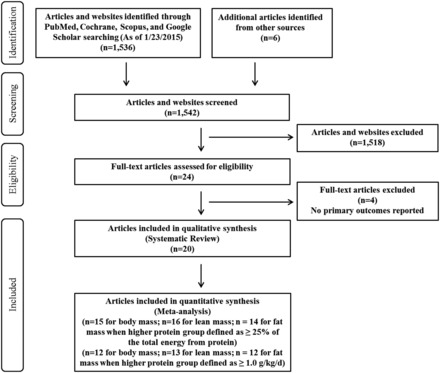
PRISMA flow chart of literature selection process.
Primary (J.E.K.) and secondary (L.E.O.) reviewers also independently extracted the following information from selected articles using an electronic form: first author’s last name; publication year; study population; sample sizes in each intervention; subject mean age, sex, and body mass index; intervention duration; total protein intakes and sources of dietary protein in each intervention; amount of dietary energy deficit for weight loss; techniques used for dietary control; method of body composition assessment; and pre- and postintervention and net changes in body mass, lean mass, and fat mass.
All of the studies included in this review measured body composition using DXA. There were some discrepancies in how lean mass was reported, with 16 studies using the term lean mass, 1 study using the term lean soft tissue,35 and 3 studies using the term fat-free mass.14,36,37 However, for this review, these terms were considered synonymous and the term lean mass is used consistently. After information was collected from corresponding authors or from elsewhere,20 it was noted that only 4 of the 20 studies included bone mineral content within lean mass.14,37–39 The studies that included bone mineral content within lean mass were included in the analyses because bone mineral content only accounts for approximately 5% of total lean mass40; moreover, bone turnover (remodeling) is very slow, requiring a minimum of 4 to 6 months, and may continue for 1 to 2 years.41 In addition, weight loss in overweight and obese individuals induces <1% of bone loss.42
Critical appraisal
The risks of selection, performance, and detection biases were evaluated from selected studies using a modified Cochrane tool for assessing risk of bias (see Table S1 in the Supporting Information online).43 Details of methods for assessment of dietary control and body composition are also included in this table.
Calculations
For this review, higher protein intake is defined as either (1) ≥25% of the daily total energy intake from protein during the intervention period, or (2) ≥1.0 g/kg/d, calculated by dividing the reported total dietary protein intake during the intervention period by the mean of pre- and postintervention body mass. The 1.0 g/kg/d threshold was chosen on the basis of a retrospective regression analysis of data from 106 older men and women (combined from 6 studies) who completed 12-week intervention periods with known protein intakes and resistance training.44 Protein intake predicted the change in lean mass over time, with the regression line crossing the point of no change in lean mass at approximately 1.0 g/kg/d. In addition, a previous study estimated the dietary protein intake in US adults aged 51 years and older using data obtained from the National Health and Nutrition Examination Survey 2005–2006, and a protein intake of 1.0 g/kg/d represented the 50th and 75th percentiles of usual protein intake in men and women, respectively.45 Some articles did not report mean changes for body mass,33,35,46 lean mass,33,46–48 or fat mass33,46–48 during an intervention period, and thus the estimated changes from reported pre- and postintervention body mass and lean mass values were calculated manually for the systematic review.
The mean and percent changes in body mass, lean mass, and fat mass and the percent body mass loss as fat mass and lean mass were calculated and each variable was categorized according to different magnitudes of change. Absolute change in body mass and percent change in body mass, respectively, were classified as follows: ≥10-kg loss, <10- to ≥5-kg loss, and <5-kg loss; and ≥10% loss, <10% to ≥5% loss, and <5% loss. These categorizations were based on previous studies reporting that the loss of 5 to 10 kg or 5% to 10% of body mass resulted in improved fasting blood glucose, blood pressure, and plasma lipid profiles.49–51 Changes in lean mass and fat mass were categorized as previously described15 (for the specific categories, see Table S213,14,30–39,46–48,54–57 in the Supporting Information online), and the percentages of body mass loss as fat mass and as lean mass were categorized on the basis of the widely cited rule that approximately 25% of body mass loss will be lean mass, with the remaining 75% being fat mass for sedentary adults.52 In addition, previous findings demonstrated that dietary energy restriction concurrent with exercise training attenuated the percentage of body mass loss as lean mass from 25% to 12% in young and middle-aged adults53 and from 24% to 11% in older adults.15 Each number in parentheses (see Table S2 in the Supporting Information online) represents an intervention, and the number of interventions varied for changes in body mass, fat mass, and lean mass, since some original articles did not report raw data for all of these parameters.
Statistical analyses
Statistical analyses were conducted by using Stata/SE 12 software (StataCorp LP, College Station, TX, USA), and data are reported as means ± standard deviations or as weighted mean differences (WMDs) and 95% confidence intervals (CIs). The overall effect sizes were calculated using the Stata 12 metaan function, using either the fixed-effects or the random-effects option, depending on heterogeneity statistics. Heterogeneity was assessed using chi-square tests and the I2 statistic. A significant chi-square test (P<0.05) and an I2 statistic of 50% or greater indicated heterogeneity in effect sizes between the studies and therefore warranted the use of a random-effects model; when the chi-square test was nonsignificant (P≥0.05) and the I2 statistic was less than 50%, a fixed-effects model was used.
RESULTS
Study features and subject characteristics
Twenty articles met all inclusion criteria, and intervention-specific results were included in this review. Descriptions of the intervention features (intervention duration and dietary energy and protein intakes) and subject characteristics (age, sex, body mass index, clinical health status) are summarized in Table 2. The degree of energy restriction among selected articles varied, with average energy intake ranging from 1250 to 1697 kcal/d and average energy deficit ranging from 500 to 750 kcal/d. The length of the energy restriction interventions ranged from 8 weeks to 2 years. End-of-study measurements were obtained at the end of an energy restriction period (15 studies) or after a 4-week period of energy balance after an energy restriction period (5 studies). There were 22 and 21 groups with normal protein intake and 24 and 19 groups with higher protein intake when protein intake was expressed as a percentage of energy intake or as grams per kilogram of body mass per day, respectively. The mean protein intakes of the normal protein groups were 18% of total energy intake (range, 15%–22%) and 0.79 g/kg/d (range, 0.58–0.97 g/kg/d), while the mean protein intakes of the higher protein groups were 31% of the total energy intake (range, 25%–40%) and 1.31 g/kg/d (range, 1.01–1.57 g/kg/d).
Table 2.
Study features and subject characteristics
| Reference | Mean age (y) | Population and no. of completed subjects; diet characteristics | BMI (kg/m2) | Duration (wk) | Energy restriction |
|---|---|---|---|---|---|
| Jesudason et al. (2013)48 | ≈61.0 | OW/OB T2D and renal disease M/F (n=45); HP (1.06a, 30b), NP (0.96a, 20b) | ≈36.0 | 52 | 1673 kcal/d (7000 kJ/d) EI for M and 1434 kcal/d (6000 kJ/d) EI for F |
| Jesudason et al. (2013)52 | ≈59.5 | OW postmenopausal F (n=136); HP (1.09a, 32b), NP (0.97a, 22b) | ≈33.7 | 104 | 1310 kcal/d (5500 kJ/d) EI |
| de Souza et al. (2012)38 | 52.0 (SD, 9.0) | OW/OB M/F (n=331); HP (N/A, 25b), NP (N/A, 15b) | 33.0 (SD, 4.0) | 24 | 750 kcal/d (3138 kJ/d) ED |
| Mojtahedi et al. (2011)35 | 65.2 (SD, 4.6) | OW/OB postmenopausal F (n=26); HP (1.12a, 30b), NP (0.83a, 18b) | 33.7 (SD, 4.9) | 24 | ≈500 kcal/d (2092 kJ/d) ED |
| Sukumar et al. (2011)46 | 58.0 (SD, 4.4) | Postmenopausal F (n=47); HP (1.01a, 30b), NP (0.75a, 18b) | 32.1 (SD, 4.6) | 52 | 500–600 kcal/d (2092–2510 kJ/d) ED |
| Aldrich et al. (2011)32 | ≈50.0 | Healthy M/F (n=18); HP-Mixed (1.52a, 30b), HP-Whey (1.52a, 30b), NP (0.80a, 15b) | ≈30.3 | 8 | Tailored to promote 0.75 kg weight loss weekly |
| Belobrajdic et al. (2010)55 | 51.0 (SE, 1.0) | OW/OB M (n=76); HP (1.33a, 32b), NP (0.85a, 20b) | 32.8 (SE, 0.5) | 12 | 1673 kcal/d (7000 kJ/d) EI |
| Campbell & Tang, study 1 (2010)36 | ≈55.8 | OW postmenopausal F (n=28); HP (1.45a, 30b), NP (0.82a, 18b) | ≈30.4 | 12 | 750 kcal/d (3138 kJ/d) ED |
| Wycherley et al. (2010)37 | 55.0 (SD, 8.4) | OW/OB T2D M/F (n=28); HP (1.21a, 33b), NP (0.74a, 19b) | 35.3 (SD, 4.5) | 16 | 1673 kcal/d (7000 kJ/d) EI for M and 1434 kcal/d (6000 kJ/d) EI for F |
| Evangelista et al. (2009)39 | 59.0 (SD, 10.0) | OW/OB T2D and heart failure M/F (n=10); HP (N/A, 30b), NP (N/A, 15b) | ≈36.6 | 12 | 500–800 kcal/d (2092–3347 kJ/d) ED |
| Gordon et al. (2008)53 | 58.0 (SD, 6.6) | OB postmenopausal F (n=24); HP (1.37a, 30b), NP (0.61a, 15–20b) | 33.0 (SD, 3.6) | 20 | 400 kcal/d (1674 kJ/d) ED |
| Mahon et al. (2007)14 | 58.0 (SD, 2.0) | Postmenopausal F (n=43); HP-Beef (0.86a, 26b), HP-Chicken (0.93a, 26b), NP (0.70a, 16b) | 29.6 (SD, 0.8) | 9 | 1250 kcal/d (5230 kJ/d) EI |
| Leidy et al. (2007)13 | ≈50.0 | OW/OB F (n=46); HP (1.46a, 30b), NP (0.85a, 18b) | ≈30.6 | 12 | 750 kcal/d (3138 kJ/d) ED |
| Keogh et al. (2007)56 | 50.0 (SD, 11.0) | OB hyperinsulinemic M/F (n=25); HP (1.18a, 40b), NP (0.88a, 20b) | 34.0 (SD, 4.0) | 52 | 1434 kcal/d (6000 kJ/d) EI |
| Moran et al. (2005)33 | 50.3 (SD, 9.9) | OW hyperinsulinemic M/F (n=57); HP (1.50a, 40b), NP (0.71a, 20b) | 34.0 (SD, 3.5) | 16 | 1434 kcal/d (6000 kJ/d) EI for 12 wk for E restriction followed by 1769 kcal/d (7400 kJ/d) EI for 4 wk for E balance |
| Luscombe-Marsh et al. (2005)31 | ≈50.2 | OB M/F (n=57); HP-M (1.43a, 40b), NP-M (0.63a, 20b), HP-F (1.57a, 40b), NP-F (0.78a, 20b) | ≈34.0 | 16 | 1434 kcal/d (6000 kJ/d) EI for 12 wk for E restriction followed by 1769 kcal/d (7400 kJ/d) EI for 4 wk for E balance |
| Brinkworth et al. (2004)47 | ≈51.7 | OB hyperinsulinemic M/F (n=43); HP (N/A, 30b), NP (N/A, 15b) | ≈34.0 | 16 | 1554 kcal/d (6500 kJ/d) EI for 12 wk for E restriction followed by 1984 kcal/d (8300 kJ/d) EI for 4 wk for E balance |
| Farnsworth et al. (2003)30 | ≈50.5 | OW/OB hyperinsulinemic M/F (n=56); HP-M (1.08a, 30b), NP-M (0.58a, 15b), HP-F (1.28a, 30b), NP-F (0.71a, 15b) | ≈34.0 | 16 | 1530 kcal/d (6400 kJ/d) EI for 12 wk for E restriction followed by 1936 kcal/d (8100 kJ/d) EI for 4 wk for E balance |
| Layman et al. (2003)54 | 50.1 (SE, 1.1) | OW F (n=24); HP (1.54a, 30b), NP (0.83a, 16b) | 30.3 (SE, 1.0) | 10 | 1697 kcal/d (7100 kJ/d) EI |
| Parker et al. (2002)34 | ≈61.2 | T2D M/F (n=54); HP (1.17a, 30b), NP (0.71a, 15b) | ≈34.0 | 12 | 1600 kcal/d (6694 kJ/d) EI for 8 wk for E restriction followed by 1902 kcal/d (7958 kJ/d) EI for 4 wk for E balance |
Abbreviations: BMI, body mass index; E, energy; ED, energy deficit; EI, energy intake; F, female; HP, higher protein; M, male; NP, normal protein; N/A, not available; OB, obese; OW, overweight; SD, standard deviation; SE, standard error; T2D, type 2 diabetes.
aProtein intake described as g/kg/d.
bProtein intake described as percentage of the daily total energy intake from protein.
Quality of selected studies
Four studies35,46,48,54 were deemed at low risk of selection bias, since they provided specified methods of randomization and/or allocation concealment in the original articles, while other selected articles did not clearly report the randomization and allocation concealment methods (see Table S1 in the Supporting Information online). Only 2 of the 20 articles provided details on whether participants and study investigator(s) were blinded during the intervention35,54 or until the data collection was completed.35 Three articles indicated all foods were provided to the subjects,32,55,56 while 11 articles reported that a portion of total protein or nonprotein energy intake was supplied to the subjects.13,14,30,31,33–36,46,57 The remaining articles noted that dietary intakes were controlled by providing dietary education and/or counseling from dietitians. Dietary compliance was monitored via 24-hour recalls, food records, food diaries, or daily food check-off logs, and 15 of the 20 articles used multiple methods to monitor dietary compliance. All selected articles assessed body composition via DXA.
Results of systematic review.
Compared with the normal protein group, the higher protein group lost comparable body mass, greater fat mass, and less lean mass (Figure 2 and Table S2 in the Supporting Information online). The vast majority (≥90%) of the normal protein and higher protein groups lost ≥5 kg of body mass and ≥5% of body mass (Figure 2A–D). With regard to fat mass, 57% and 71% of the normal protein and higher protein groups lost ≥5 kg as fat mass during the intervention periods, respectively (Figure 2E), and percent change in fat mass apparently was not different between the normal protein and higher protein groups (63% vs 69% with ≥15%) (Figure 2F). However, 23% of the normal protein group vs 13% of the higher protein group lost >3 kg of lean mass (Figure 2I), and 41% of the normal protein group vs 21% of the higher protein group lost >5% of lean mass (Figure 2J). Moreover, 48% of the normal protein group lost ≥30% of body mass as lean mass, while 22% of the higher protein group lost ≥30% of body mass as lean mass (Figure 2M). In contrast, 52% of the normal protein group lost ≥70% of body mass as fat mass, while 76% of the higher protein group lost ≥70% of body mass as fat mass (Figure 2N). When higher protein intake was defined as ≥1.0 g/kg/d, similar results in fat mass loss were observed (Figure 2G and 2H). With regard to lean mass, 24% of the normal protein group vs 16% of the higher protein group lost >3 kg of lean mass (Figure 2K), and 47% of the normal protein group vs 20% of the higher protein group lost >5% of lean mass (Figure 2L). Finally, 50% and 21% of the normal protein and higher protein groups, respectively, lost ≥30% of body mass as lean mass (Figure 2O), but 57% and 78% of the normal protein and higher protein groups, respectively, lost ≥70% of body mass as fat mass (Figure 2P).
Figure 2.
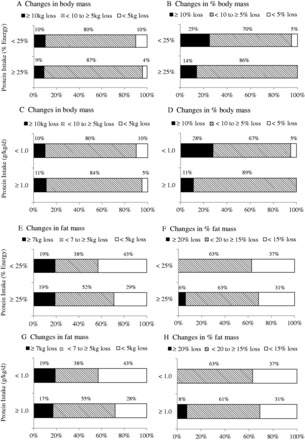
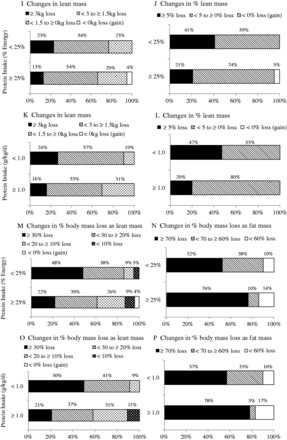
Changes in body mass (A and C), percent body mass (B and D), fat mass (E and G), percent fat mass (F and H), lean mass (I and K), percent lean mass (J and L), percent body mass loss as lean mass (M and O), and percent body mass loss as fat mass (N and P) in higher-protein and normal-protein groups. A, B, E, F, I, J, M, and N are results from the normal-protein group and the higher-protein group when protein intakes were defined as <25% and ≥25% of the daily total energy intake, respectively. C, D, G, H, K, L, O, and P are results from the normal-protein group and the higher-protein group when protein intakes were defined as <1.0 and ≥1.0 g/kg/d, respectively. Each percentage represents the proportion of groups in the categories of each variable.
Results of meta-analysis
The energy restriction–induced loss of body mass was not different between normal protein intake and higher protein intake when protein intake was expressed as a percentage of energy intake (Figure 3) or grams per kilogram per day (Figure 4). The aggregated mean difference in body mass was −0.54 kg (95%CI, −1.30 to 0.23) and −0.06 kg (95%CI, −0.66 to 0.53), respectively. Compared with the normal protein group, the higher protein group lost less lean mass when protein intake was expressed as a percentage of energy intake (WMD 0.45 kg; 95%CI=0.20–0.71) (Figure 5) or grams per kilogram per day (WMD 0.83 kg; 95%CI=0.47–1.19) (Figure 6) and lost more fat mass when protein intake was expressed as a percentage of energy intake (WMD −0.57 kg; 95%CI=−0.98 to −0.15) (Figure 7), with a trend when expressed as grams per kilogram per day (WMD −0.53 kg; 95%CI=−1.08 to 0.03) (Figure 8).
Figure 3.
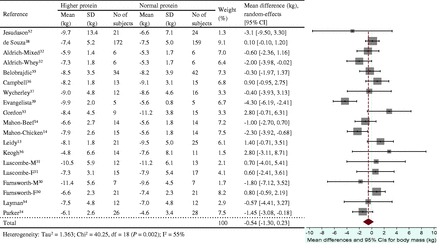
Effect of protein intake (percent total energy from protein) on energy restriction–induced changes in body mass. A random-effects model was used for body mass index, since heterogeneity was observed in pooled data. Abbreviations: F, female; M, male; SD, standard deviation.
Figure 4.
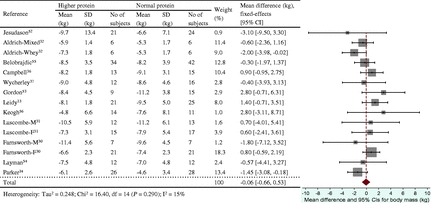
Effect of protein intake (g/kg/d) on energy restriction–induced changes in body mass. A fixed-effects model was used for lean mass, since no heterogeneity was observed in pooled data. Abbreviations: F, female; M, male; SD, standard deviation.
Figure 5.
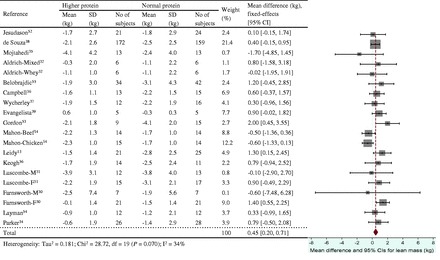
Effect of protein intake (percent total energy from protein) on energy restriction–induced changes in lean mass. A fixed- effects model was used for fat mass, since no heterogeneity was observed in pooled data. Abbreviations: F, female; M, male; SD, standard deviation.
Figure 6.
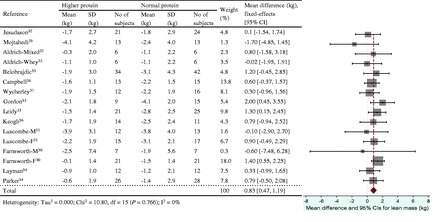
Effect of protein intake (g/kg/d) on energy restriction–induced changes in lean mass. A fixed-effects model was used for body mass index, since no heterogeneity was observed in pooled data. Abbreviations: F, female; M, male; SD, standard deviation
Figure 7.
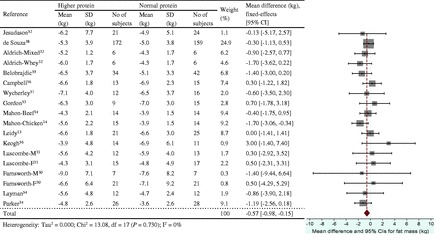
Effect of protein intake (percent total energy from protein) on energy restriction–induced changes in fat mass. A fixed-effects model was used for lean mass, since no heterogeneity was observed in pooled data. Abbreviations: F, female; M, male; SD, standard deviation.
Figure 8.
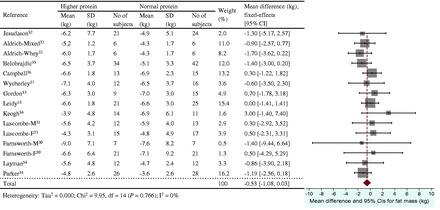
Effect of protein intake (g/kg/d) on energy restriction–induced changes in fat mass. A fixed-effects model was used for fat mass, since no heterogeneity was observed in pooled data. Abbreviations: F, female; M, male; SD, standard deviation.
DISCUSSION
Guidelines for successful and healthful weight loss among overweight and obese older adults emphasize consuming higher dietary protein when dieting.12 However, the scientific foundation supporting the potential benefit of higher dietary protein intake to minimize the loss of lean mass, including skeletal muscle mass, during diet-induced weight loss requires systematic review. This section considers the effects of the higher protein diet on body composition during weight loss, the description of the higher protein diet, the changes in lean mass vs skeletal muscle mass during weight loss, and the strengths and limitations of the current systematic review and meta-analysis.
Effects of energy-restricted high-protein diets on body mass, lean mass, and fat mass
Results from this systematic review and meta-analysis of findings from RCTs consistently indicate that older men and women better retain lean mass while losing body mass during periods of diet-induced energy restriction when they consume higher protein vs normal protein diets. Qualitatively, about one-half (48%–50%) of the normal protein groups lost ≥30% of body mass as lean mass, compared with 21% to 22% of the higher protein groups; furthermore, only 9% to 14% of the normal protein groups lost <20% of body mass as lean mass, compared with 39% to 42% of the higher protein groups. These observations complement and support previous research in young and middle-aged adults.13,17–19 Quantitatively, the current meta-analysis determined that older adults who consumed higher protein diets (expressed as a percentage of energy intake) during energy restriction preserved about the same amount of lean mass (WMD 0.45 kg; 95%CI=0.20–0.71 kg) as participants older than 18 years (WMD 0.43 kg; 95%CI=0.09–0.78 kg) in a previous analysis.20 When protein intake was expressed as grams per kilogram per day, higher protein-diet-related lean mass retention was also comparable for older adults (WMD 0.83 kg; 95%CI=0.47–1.19 kg) and younger adults who consumed >1.05 g/kg/d vs ≤1.05 g/kg/d (WMD 0.60 kg; 95%CI=0.16–1.05 kg).22 These findings are significant because older adults typically present lower initial lean mass than younger adults, and older adults are also more likely to lose lean mass during weight loss.15
Complementary to lean mass retention, higher protein diets also increased fat mass loss. The analyses for older adults showed that 76% to 78% of the higher protein groups lost ≥70% of body mass as fat mass, compared with 52% to 57% of the normal protein groups, while only 22% to 24% of the higher protein groups lost <70% of body mass as fat mass, compared with 43% to 48% of the normal protein groups; these findings are consistent with those from a previous meta-analysis of results from studies conducted in younger adults.20 The greater fat mass loss with higher protein diets may be related to higher protein-diet–induced increases in whole-body energy expenditure, including resting energy expenditure and thermic effect of feeding.58,59 In addition, higher protein diets may increase fat oxidation in overweight and obese subjects.60 Because few articles included in this review reported these results, findings specific to energy expenditure should be interpreted with caution. Only 3 articles31–33 reported changes in resting energy expenditure, 2 articles31,33 reported changes in thermic effect of feeding, and no articles reported changes in fat oxidation during weight-loss interventions. Two articles reported that resting energy expenditure and thermic effect of feeding were reduced after energy restriction, with no difference in resting energy expenditure change between higher protein and normal protein groups, but a significantly smaller reduction of thermic effect of feeding in higher protein group compared with normal protein group was observed. The smaller reduction in thermic effect of feeding with higher protein vs normal protein diets31,33 is consistent with other research.61–63 While higher protein diets apparently influence both fat mass loss and thermic effect of feeding, more research is needed to establish associations between these two parameters and to assess cause-and-effect relationships. Nonetheless, these results collectively indicate that consuming higher dietary protein during weight loss improves body composition by helping retain lean mass and reduce fat mass.
Description of higher protein intake
The positive effects of higher protein diets on lean mass retention and fat mass reduction during weight loss were observed when higher protein intakes were defined as either ≥25% of the daily total energy intake or ≥1.0 g/kg/d. However, there were modest differences in the number of intervention groups included in these two analyses because not all interventions classified as higher protein on the basis of percentage of energy intake had protein intakes ≥1.0 g/kg/d: 2 higher protein groups in 1 study14 consumed <1.0 g/kg/d (0.86 and 0.93 g/kg/d). From a metabolic perspective, it seems preferable to assess the impact of protein intake on outcomes of interest on the basis of the quantity consumed (g/kg/d) rather than a relative proportion of energy intake (percentage of daily energy intake) because the quantity of protein consumed contributes to amino acid bioavailability. Consistent with this perspective, lean mass retention was greater when higher protein groups were classified using grams per kilogram per day (Figure 6) vs percentage of daily energy intake (Figure 5): WMDs (95%CIs) were 0.83 (0.47–1.19) kg and 0.45 (0.20–0.71) kg, respectively. Researchers should be encouraged to provide sufficient and detailed dietary and body mass information for macronutrient intakes to be expressed both quantitatively and in proportion to energy intake before (baseline) and at the start and end of weight-loss interventions.
Changes in lean mass compared with changes in skeletal muscle mass
In adults, body composition changes with advancing age: overall lean mass is reduced, which is mainly due to reduced skeletal muscle mass, while nonmuscle lean mass, such as organs and connective tissues, is retained.64 The fact that differential changes in lean mass with higher protein vs normal protein diets during weight loss seem to occur in young20,22 as well as older adults is meaningful because older adults present lower initial lean mass than younger adults in general. New RCTs are needed to directly assess the effects of higher protein vs normal protein intakes on energy restriction–induced changes in body composition (including skeletal muscle mass) in young and older adults, especially older adults with sarcopenic obesity.
While changes in lean mass measured using DXA are often attributed to changes in skeletal muscle mass, this inference should be made with caution. While computed tomography and magnetic resonance imaging are considered more suitable tools for measurement of skeletal muscle mass,23,66 only 1 of 20 studies included in this systematic review used magnetic resonance imaging to measure skeletal muscle mass, whereas all 20 studies utilized DXA to assess lean mass. Fortunately, strong correlations exist between DXA-derived estimates of lean mass and computed tomography– and/or magnetic resonance imaging–derived estimates of skeletal muscle mass, especially for lower-limb lean mass23,67,68 in middle-aged and older adults. These findings support the reliability of DXA as a surrogate measure of skeletal muscle mass. There were, however, discrepancies with changes in regional (arms, legs, and trunk) lean mass measured by DXA and in skeletal muscle mass derived by magnetic resonance imaging during weight loss.69 Generally, the use of DXA for monitoring changes in whole-body composition after weight loss is effective and practical, but caution is warranted when investigating regional lean mass changes after weight loss.
Strengths and limitations of the study
The findings of this review are limited by inconsistencies in experimental design, intervention duration, and level of energy restriction for weight loss among the selected studies. Although primary and secondary reviewers thoroughly and independently reviewed articles, the potential influence of publication bias may still exist. In addition, this review is limited to changes in soft tissue body composition (lean mass and fat mass) and does not address the potential impact of protein intake on energy restriction–induced changes in skeletal bone or indices of health and functional well-being. Nonetheless, this work makes a unique contribution as the first systematic review and meta-analysis to use both qualitative and quantitative assessments to document the impact of higher protein intake on diet-induced changes in body mass and body composition in adults 50 years and older.
The assessment of the impact of protein intake on changes in body mass and body composition on the basis of the quantity of protein consumed (g/kg/d) vs a relative proportion of energy intake (percentage of daily energy intake) is novel and of importance for dietitians and other healthcare providers who work with older adults to help them lose weight. While counseling people to consume protein on the basis of grams per kilogram per day is recommended, reasonably comparable results were obtained when protein intake was consumed on the basis of percentage of energy intake. If the latter method is used to recommend protein intakes, it is important to make sure that total protein intakes are above the recommended dietary allowance of 0.8 g/kg/d, and preferably above 1.0 g/kg/d. It is also important to be mindful that the acceptable macronutrient distribution range for protein (10%–35% of total energy intake) is only applicable to states of energy balance. In energy restriction states, crudely the percentage of energy consumed as protein should be increased by about 5% to retain the same quantity of protein in the diet.
CONCLUSION
In summary, the findings of this systematic review and meta-analysis provide support that men and women aged 50 years and older better retain lean mass while losing fat mass when they consume energy-restricted higher-protein rather than normal-protein diets. Information gained from this review strengthens the scientific foundation for older overweight and obese adults to consume protein intakes ≥1.0 g/kg/d to help preserve lean mass as part of a successful weight-loss intervention.
Acknowledgments
Author contributions. The authors’ responsibilities were as follows: J.E.K., L.P.S., M.B.S., and W.W.C. designed the research; J.E.K. and L.E.O. conducted the research; J.E.K. and L.P.S. analyzed the data; J.E.K. and W.W.C. wrote the manuscript and had primary responsibility for the final content of the manuscript. All authors read and approved the final manuscript. None of the authors had any professional, personal, or financial conflicts of interest.
Funding. This study was supported by a Purdue University Ingestive Behavior Research Center Post-Doctoral Fellowship (J.E.K.) and a Charles C. Chappelle Graduate Fellowship (L.E.O.).
Declaration of interest. The authors have no relevant interests to declare.
Supporting Information
The following Supporting Information is available through the online version of this article at the publisher’s website.
Table S1. Risk of bias and methodological assessment of articles compiled in a systematic review about the impact of higher protein intake on dietary energy restriction–induced changes in body composition
Table S2. Body mass, lean mass, and fat mass changes in higher protein intake and normal protein intake groups during dietary energy restriction–induced weight loss
References
- 1.Ding J, Kritchevsky SB, Newman AB, et al. Effects of birth cohort and age on body composition in a sample of community-based elderly. Am J Clin Nutr. 2007;85:405–410. [DOI] [PubMed] [Google Scholar]
- 2.Baumgartner RN, Stauber PM, McHugh D, et al. Cross-sectional age differences in body composition in persons 60+ years of age. J Gerontol A Biol Sci Med Sci. 1995;50:M307–M316. [DOI] [PubMed] [Google Scholar]
- 3.Bunout D, de la Maza MP, Barrera G, et al. Association between sarcopenia and mortality in healthy older people. Australas J Ageing. 2011;30:89–92. [DOI] [PubMed] [Google Scholar]
- 4.Flegal KM, Carroll MD, Ogden CL, et al. Prevalence and trends in obesity among US adults, 1999–2008. JAMA. 2010;303:235–241. [DOI] [PubMed] [Google Scholar]
- 5.Ogden CL, Carroll MD, Kit BK, et al. Prevalence of Obesity Among Adults: United States, 2011–2012. Hyattsville, MD: National Center for Health Statistics; NCHS Data Brief No. 131. http://www.cdc.gov/nchs/data/databriefs/db131.pdf. Published October 2013. Accessed January 21, 2015. [Google Scholar]
- 6.Orpana HM, Berthelot JM, Kaplan MS, et al. BMI and mortality: results from a national longitudinal study of Canadian adults. Obesity (Silver Spring). 2010;18:214–218. [DOI] [PubMed] [Google Scholar]
- 7.Malnick SD, Knobler H. The medical complications of obesity. Q J Med. 2006;99:565–579. [DOI] [PubMed] [Google Scholar]
- 8.Schmidt MI, Watson RL, Duncan BB, et al. Clustering of dyslipidemia, hyperuricemia, diabetes, and hypertension and its association with fasting insulin and central and overall obesity in a general population. Metabolism. 1996;45:699–706. [DOI] [PubMed] [Google Scholar]
- 9.Zamboni M, Mazzali G, Fantin F, et al. Sarcopenic obesity: a new category of obesity in the elderly. Nutr Metab Cardiovasc Dis. 2008;18:388–395. [DOI] [PubMed] [Google Scholar]
- 10.Sitnick M, Bodine SC, Rutledge JC. Chronic high fat feeding attenuates load-induced hypertrophy in mice. J Physiol. 2009;587(pt 23):5753–5765. [DOI] [PMC free article] [PubMed] [Google Scholar]
- 11.Schiaffino S, Dyar KA, Ciciliot S, et al. Mechanisms regulating skeletal muscle growth and atrophy. FEBS J. 2013;280:4294–4314. [DOI] [PubMed] [Google Scholar]
- 12.Villareal DT, Apovian CM, Kushner RF, et al. Obesity in older adults: technical review and position statement of the American Society for Nutrition and NAASO, The Obesity Society. Obes Res. 2005;13:1849–1863. [DOI] [PubMed] [Google Scholar]
- 13.Leidy HJ, Carnell NS, Mattes RD, et al. Higher protein intake preserves lean mass and satiety with weight loss in pre-obese and obese women. Obesity (Silver Spring). 2007;15:421–429. [DOI] [PubMed] [Google Scholar]
- 14.Mahon AK, Flynn MG, Stewart LK, et al. Protein intake during energy restriction: effects on body composition and markers of metabolic and cardiovascular health in postmenopausal women. J Am Coll Nutr. 2007;26:182–189. [DOI] [PMC free article] [PubMed] [Google Scholar]
- 15.Weinheimer EM, Sands LP, Campbell WW. A systematic review of the separate and combined effects of energy restriction and exercise on fat-free mass in middle-aged and older adults: implications for sarcopenic obesity. Nutr Rev. 2010;68:375–388. [DOI] [PubMed] [Google Scholar]
- 16.Ballor DL, Katch VL, Becque MD, et al. Resistance weight training during caloric restriction enhances lean body weight maintenance. Am J Clin Nutr. 1988;47: 19–25. [DOI] [PubMed] [Google Scholar]
- 17.Houston DK, Nicklas BJ, Ding J, et al. Dietary protein intake is associated with lean mass change in older, community-dwelling adults: the Health, Aging, and Body Composition (Health ABC) Study. Am J Clin Nutr. 2008;87:150–155. [DOI] [PubMed] [Google Scholar]
- 18.Layman DK, Evans E, Baum JI, et al. Dietary protein and exercise have additive effects on body composition during weight loss in adult women. J Nutr. 2005; 135:1903–1910. [DOI] [PubMed] [Google Scholar]
- 19.Tang M, Armstrong CL, Leidy HJ, et al. Normal vs. high-protein weight loss diets in men: effects on body composition and indices of metabolic syndrome. Obesity (Silver Spring). 2013;21:E204–E210. [DOI] [PubMed] [Google Scholar]
- 20.Wycherley TP, Moran LJ, Clifton PM, et al. Effects of energy-restricted high-protein, low-fat compared with standard-protein, low-fat diets: a meta-analysis of randomized controlled trials. Am J Clin Nutr. 2012;96:1281–1298. [DOI] [PubMed] [Google Scholar]
- 21.Moher D, Liberati A, Tetzlaff J, et al. Preferred reporting items for systematic reviews and meta-analyses: the PRISMA statement. Int J Surg. 2010;8:336–341. [DOI] [PubMed] [Google Scholar]
- 22.Krieger JW, Sitren HS, Daniels MJ, et al. Effects of variation in protein and carbohydrate intake on body mass and composition during energy restriction: a meta-regression 1. Am J Clin Nutr. 2006;83:260–274. [DOI] [PubMed] [Google Scholar]
- 23.Chen Z, Wang Z, Lohman T, et al. Dual-energy X-ray absorptiometry is a valid tool for assessing skeletal muscle mass in older women. J Nutr. 2007;137:2775–2780. [DOI] [PubMed] [Google Scholar]
- 24.Mahon AK, Flynn MG, Iglay HB, et al. Measurement of body composition changes with weight loss in postmenopausal women: comparison of methods. J Nutr Health Aging. 2007;11:203–213. [PMC free article] [PubMed] [Google Scholar]
- 25.McCrory MA, Gomez TD, Bernauer EM, et al. Evaluation of a new air displacement plethysmograph for measuring human body composition. Med Sci Sports Exerc. 1995;27:1686–1691. [PubMed] [Google Scholar]
- 26.Neovius M, Udden J, Hemmingsson E. Assessment of change in body fat percentage with DXA and eight-electrode BIA in centrally obese women. Med Sci Sports Exerc. 2007;39:2199–2203. [DOI] [PubMed] [Google Scholar]
- 27.Gallagher D, Kovera AJ, Clay-Williams G, et al. Weight loss in postmenopausal obesity: no adverse alterations in body composition and protein metabolism. Am J Physiol Endocrinol Metab. 2000;279:E124–E131. [DOI] [PubMed] [Google Scholar]
- 28.Heyward VH. Practical body composition assessment for children, adults, and older adults. Int J Sport Nutr. 1998;8:285–307. [DOI] [PubMed] [Google Scholar]
- 29.Roubenoff R, Baumgartner RN, Harris TB, et al. Application of bioelectrical impedance analysis to elderly populations. J Gerontol A Biol Sci Med Sci. 1997;52:M129–M136. [DOI] [PubMed] [Google Scholar]
- 30.Farnsworth E, Luscombe ND, Noakes M, et al. Effect of a high-protein, energy-restricted diet on body composition, glycemic control, and lipid concentrations in overweight and obese hyperinsulinemic men and women. Am J Clin Nutr. 2003;78:31–39. [DOI] [PubMed] [Google Scholar]
- 31.Luscombe-Marsh ND, Noakes M, Wittert GA, et al. Carbohydrate-restricted diets high in either monounsaturated fat or protein are equally effective at promoting fat loss and improving blood lipids. Am J Clin Nutr. 2005;81: 762–772. [DOI] [PubMed] [Google Scholar]
- 32.Aldrich ND, Reicks MM, Sibley SD, et al. Varying protein source and quantity do not significantly improve weight loss, fat loss, or satiety in reduced energy diets among midlife adults. Nutr Res. 2011;31:104–112. [DOI] [PMC free article] [PubMed] [Google Scholar]
- 33.Moran LJ, Luscombe-Marsh ND, Noakes M, et al. The satiating effect of dietary protein is unrelated to postprandial ghrelin secretion. J Clin Endocrinol Metab. 2005;90:5205–5211. [DOI] [PubMed] [Google Scholar]
- 34.Parker B, Noakes M, Luscombe N, et al. Effect of a high-protein, high-monounsaturated fat weight loss diet on glycemic control and lipid levels in type 2 diabetes. Diabetes Care. 2002;25:425–430. [DOI] [PubMed] [Google Scholar]
- 35.Mojtahedi MC, Thorpe MP, Karampinos DC, et al. The effects of a higher protein intake during energy restriction on changes in body composition and physical function in older women. J Gerontol A Biol Sci Med Sci. 2011;66: 1218–1225. [DOI] [PubMed] [Google Scholar]
- 36.Campbell WW, Tang M. Protein intake, weight loss, and bone mineral density in postmenopausal women. J Gerontol A Biol Sci Med Sci. 2010;65:1115–1122. [DOI] [PMC free article] [PubMed] [Google Scholar]
- 37.Wycherley TP, Noakes M, Clifton PM, et al. A high-protein diet with resistance exercise training improves weight loss and body composition in overweight and obese patients with type 2 diabetes. Diabetes Care. 2010;33:969–976. [DOI] [PMC free article] [PubMed] [Google Scholar]
- 38.de Souza RJ, Bray GA, Carey VJ, et al. Effects of 4 weight-loss diets differing in fat, protein, and carbohydrate on fat mass, lean mass, visceral adipose tissue, and hepatic fat: results from the POUNDS LOST trial. Am J Clin Nutr. 2012;95:614–625. [DOI] [PMC free article] [PubMed] [Google Scholar]
- 39.Evangelista LS, Heber D, Li Z, et al. Reduced body weight and adiposity with a high-protein diet improves functional status, lipid profiles, glycemic control, and quality of life in patients with heart failure: a feasibility study. J Cardiovasc Nurs. 2009;24:207–215. [DOI] [PMC free article] [PubMed] [Google Scholar]
- 40.Heymsfield SB, Lohman TG, Wang Z, et al. Human Body Composition. 2nd ed Champaign, IL: Human Kinetics; 2005. [Google Scholar]
- 41.Heaney RP. The bone-remodeling transient: implications for the interpretation of clinical studies of bone mass change. J Bone Miner Res. 1994;9:1515–1523. [DOI] [PubMed] [Google Scholar]
- 42.Shapses SA, Riedt CS. Bone, body weight, and weight reduction: what are the concerns? J Nutr. 2006;136:1453–1456. [DOI] [PMC free article] [PubMed] [Google Scholar]
- 43.Higgins J, Green S, eds. Cochrane Handbook for Systematic Reviews of Interventions. Version 5.1.0. Updated March 2011. The Cochrane Collaboration Chichester, UK: John Wiley & Sons Ltd; http://handbook.cochrane.org/. Accessed September 16, 2013. [Google Scholar]
- 44.Campbell WW, Leidy HJ. Dietary protein and resistance training effects on muscle and body composition in older persons. J Am Coll Nutr. 2007;26:696S–703S. [DOI] [PubMed] [Google Scholar]
- 45.Berner LA, Becker G, Wise M, et al. Characterization of dietary protein among older adults in the United States: amount, animal sources, and meal patterns. J Acad Nutr Diet. 2013;113:809–815. [DOI] [PubMed] [Google Scholar]
- 46.Sukumar D, Ambia-Sobhan H, Zurfluh R, et al. Areal and volumetric bone mineral density and geometry at two levels of protein intake during caloric restriction: a randomized, controlled trial. J Bone Miner Res. 2011;26:1339–1348. [DOI] [PMC free article] [PubMed] [Google Scholar]
- 47.Brinkworth GD, Noakes M, Keogh JB, et al. Long-term effects of a high- protein, low-carbohydrate diet on weight control and cardiovascular risk markers in obese hyperinsulinemic subjects. Int J Obes Relat Metab Disord. 2004;28:661–670. [DOI] [PubMed] [Google Scholar]
- 48.Jesudason DR, Pedersen E, Clifton PM. Weight-loss diets in people with type 2 diabetes and renal disease: a randomized controlled trial of the effect of different dietary protein amounts. Am J Clin Nutr. 2013;98:494–501. [DOI] [PubMed] [Google Scholar]
- 49.Goldstein DJ. Beneficial health effects of modest weight loss. Int J Obes Relat Metab Disorders. 1992;16:397–415. [PubMed] [Google Scholar]
- 50.Steinbeck K. Obesity: the science behind the management. Intern Med J. 2002;32:237–241. [DOI] [PubMed] [Google Scholar]
- 51.Vidal J. Updated review on the benefits of weight loss. Int J Obes Relat Metab Disorders 2002;26(suppl 4):S25–S28. [DOI] [PubMed] [Google Scholar]
- 52.Jesudason D, Nordin BC, Keogh J, et al. Comparison of 2 weight-loss diets of different protein content on bone health: a randomized trial. Am J Clin Nutr. 2013;98:1343–1352. [DOI] [PubMed] [Google Scholar]
- 53.Gordon MM, Bopp MJ, Easter L, et al. Effects of dietary protein on the composition of weight loss in post-menopausal women. J Nutr Health Aging. 2008;12:505–509. [DOI] [PMC free article] [PubMed] [Google Scholar]
- 54.Layman DK, Boileau RA, Erickson DJ, et al. A reduced ratio of dietary carbohydrate to protein improves body composition and blood lipid profiles during weight loss in adult women. J Nutr. 2003;133:411–417. [DOI] [PubMed] [Google Scholar]
- 55.Belobrajdic DP, Frystyk J, Jeyaratnaganthan N, et al. Moderate energy restriction-induced weight loss affects circulating IGF levels independent of dietary composition. Eur J Endocrinol. 2010;162:1075–1082. [DOI] [PubMed] [Google Scholar]
- 56.Keogh JB, Luscombe-Marsh ND, Noakes M, et al. Long-term weight maintenance and cardiovascular risk factors are not different following weight loss on carbohydrate-restricted diets high in either monounsaturated fat or protein in obese hyperinsulinaemic men and women. Br J Nutr. 2007;97:405–410. [DOI] [PubMed] [Google Scholar]
- 57.Heymsfield SB, Gonzalez MC, Shen W, et al. Weight loss composition is one-fourth fat-free mass: a critical review and critique of this widely cited rule. Obes Rev. 2014;15:310–321. [DOI] [PMC free article] [PubMed] [Google Scholar]
- 58.Garrow JS, Summerbell CD. Meta-analysis: effect of exercise, with or without dieting, on the body composition of overweight subjects. Eur J Clin Nutr. 1995;49:1–10. [PubMed] [Google Scholar]
- 59.Westerterp-Plantenga MS, Nieuwenhuizen A, Tome D, et al. Dietary protein, weight loss, and weight maintenance. Annu Rev Nutr. 2009;29:21–41. [DOI] [PubMed] [Google Scholar]
- 60.Halton TL, Hu FB. The effects of high protein diets on thermogenesis, satiety and weight loss: a critical review. J Am Coll Nutr. 2004;23:373–385. [DOI] [PubMed] [Google Scholar]
- 61.Batterham M, Cavanagh R, Jenkins A, et al. High protein meals may benefit fat oxidation and energy expenditure in individuals with higher body fat. Nutr Diet. 2008;65:246–252. http://ro.uow.edu.au/cgi/viewcontent.cgi?article=1110&context=hbspapers. Accessed May 8, 2015. [Google Scholar]
- 62.Acheson KJ, Blondel-Lubrano A, Oguey-Araymon S, et al. Protein choices targeting thermogenesis and metabolism. Am J Clin Nutr. 2011;93:525–534. [DOI] [PubMed] [Google Scholar]
- 63.Luscombe ND, Clifton PM, Noakes M, et al. Effect of a high-protein, energy- restricted diet on weight loss and energy expenditure after weight stabilization in hyperinsulinemic subjects. Int J Obes Relat Metab Disorders. 2003;27: 582–590. [DOI] [PubMed] [Google Scholar]
- 64.Johnston CS, Day CS, Swan PD. Postprandial thermogenesis is increased 100% on a high-protein, low-fat diet versus a high-carbohydrate, low-fat diet in healthy, young women. J Am Coll Nutr. 2002;21:55–61. [DOI] [PubMed] [Google Scholar]
- 65.Cohn SH, Vartsky D, Yasumura S, et al. Compartmental body composition based on total-body nitrogen, potassium, and calcium. Am J Physiol. 1980;239: E524–E530. [DOI] [PubMed] [Google Scholar]
- 66.Mitsiopoulos N, Baumgartner RN, Heymsfield SB, et al. Cadaver validation of skeletal muscle measurement by magnetic resonance imaging and computerized tomography. J Appl Physiol (1985). 1998;85:115–122. [DOI] [PubMed] [Google Scholar]
- 67.Shih R, Wang Z, Heo M, et al. Lower limb skeletal muscle mass: development of dual-energy X-ray absorptiometry prediction model. J Appl Physiol (1985). 2000;89:1380–1386. [DOI] [PubMed] [Google Scholar]
- 68.Visser M, Fuerst T, Lang T, et al. Validity of fan-beam dual-energy X-ray absorptiometry for measuring fat-free mass and leg muscle mass. J Appl Physiol (1985). 1999;87:1513–1520. [DOI] [PubMed] [Google Scholar]
- 69.Pourhassan M, Schautz B, Braun W, et al. Impact of body-composition methodology on the composition of weight loss and weight gain. Eur J Clin Nutr. 2013;67:446–454. [DOI] [PubMed] [Google Scholar]


