

Abstract
The consumption of fructose, a major constituent of the modern diet, has raised increasing concern about the effects of fructose on health. Research suggests that excessive intake of fructose (>50 g/d) causes hyperuricemia, insulin resistance, mitochondrial dysfunction, de novo lipogenesis by the liver, and increased production of reactive oxygen species (ROS) in muscle. In a number of tissues, uric acid has been shown to stimulate the production of ROS via activation of transforming growth factor β1 and NADPH (nicotinamide adenine dinucleotide phosphate) oxidase 4. The role of uric acid in fructose-induced production of ROS in skeletal muscle, however, has not been investigated. This review examines the evidence for fructose-induced production of ROS in skeletal muscle, highlights proposed mechanisms, and identifies gaps in current knowledge.
Keywords: fructose, mitochondrial dysfunction, reactive oxygen species, transforming growth factor, uric acid
INTRODUCTION
In recent decades there has been an increase in the consumption of fructose, primarily from diets containing sucrose (50% fructose and 50% glucose) and high-fructose corn syrup, which has a higher fructose content (typically 55% fructose).1,2 To date, high-fructose corn syrup represents approximately 40% of all the added sweeteners used by manufacturers of soft drinks and fruit juices, probably because of its relatively low cost.3–5 High-fructose corn syrup is also found in various processed foods, including canned soups, cereals, desserts, flavored dairy products (yogurt), and candies.6,7 Studies indicate that consumption of soft drinks and fruit juices worldwide has risen fivefold since 1950. Data from the National Health and Nutrition Examination Survey obtained between 2005 and 2010 showed that approximately 13% of total caloric intake by adults comes from added sugars.8 At least one-third of the calories from added sugars are from beverages, both in adults (33%) and in children and adolescents (40%).9 Increased fructose consumption has been observed in developing countries as well: a survey conducted in South Africa revealed that the most commonly consumed added sugar in the diet came from table sugar, squash concentrates (fruit-flavored syrups), jams, cookies, carbonated soft drinks, sweets, and breakfast cereals,10 all of which contain fructose. According to some authors, one of the factors contributing to increased fructose consumption in developing countries has been the increase in absolute income levels due to urban in-migration over the past 3 decades, which has enabled more people to access and afford foods high in fructose.11,12
Rippe and Angelopoulos13 recently suggested that disease and the consumption of fructose-containing sugars at levels within the normal range of human consumption are not uniquely related. However, risk factors for disease may develop if fructose consumption exceeds 20% of energy per day, particularly in hypercaloric settings. Recent systematic reviews and meta-analyses have shown that low doses of fructose, less than 36 g/d, benefits glycemic control without worsening cardiometabolic risk,14,15 and at this amount it may even have beneficial effects on blood pressure.16 Therefore, it is important to note that the negative effects of fructose described in this review pertain to the consumption of fructose at above-physiological levels and at high concentrations seen in industrially processed foods. Consumption of other foods containing naturally occurring fructose, such as fruits and vegetables, has been shown to have beneficial health effects in humans.17,18 Several studies have reported that diets rich in fruits and vegetables increase antioxidant capacity and protect against oxidative stress, while diets containing excess fructose from processed foods have been shown to have adverse effects.19,20
In experimental animals, high dietary fructose intake causes increased generation of reactive oxygen species (ROS) in the mitochondria in a variety of tissues, including the liver, kidney, small intestine, and skeletal muscle.21–26 In animal and in vitro studies, excess intracellular ROS cause DNA damage and activate the apoptosis pathways, which results in organ damage.27 Evidence from animal and clinical studies further suggests that overproduction of ROS is associated with mitochondrial dysfunction, which is an early feature of type II diabetes, obesity, cardiovascular disease, and kidney disorders.2,28–36 This review summarizes published research on the effects of fructose on ROS production and mitochondrial dysfunction in various tissues of the body, with emphasis on skeletal muscle, the tissue that contributes the most to insulin resistance and type II diabetes.37 Furthermore, the review identifies gaps in current knowledge and attempts to shed light on the mechanisms of fructose-induced ROS production in skeletal muscle.
METABOLISM OF FRUCTOSE IN SKELETAL MUSCLE
There is a paucity of basic scientific data that explicitly show the metabolism of fructose in skeletal muscle and whether it is similar to the metabolism of fructose in the liver. What is known is that fructose is taken up into skeletal muscle cells through glucose transporter 538,39 and, upon uptake into skeletal muscle cells, causes mitochondrial dysfunction, apoptosis, oxidative stress, and accumulation of acylcarnitine species.37,40,41 Zierath et al.42 investigated whether fructose can be used directly by skeletal muscle as a metabolic substrate. They exposed human skeletal muscle cells to various concentrations of fructose (0.1–1.0 mM) for 2 hours and measured oxidation of fructose, incorporation of fructose into glycogen, and lactate formation from fructose. The results indicated that fructose can be transported into human skeletal muscle via a carrier-mediated system and contributes 10% to 30% of synthesized glycogen and a greater percentage (79%) of lactate. Others have shown that fructose also increased ROS production, lipid accumulation, and mitochondrial dysfunction in skeletal muscle.40,43 Therefore, although the exact enzymatic metabolism of fructose in skeletal muscle has not been fully investigated, its endpoints resemble those in the liver.
Comparison of the metabolic effects of fructose and glucose
The metabolic effects of fructose have been compared to that of glucose in a number of studies. Stanhope and Havel36 conducted a clinical study in which obese participants consumed 25% of their daily energy requirements in the form of glucose- or fructose-sweetened beverages along with their usual diet for 10 weeks. At the end of the study, the group that consumed fructose had an 8.6% increase in abdominal fat, whereas the group that consumed glucose showed only a 4.8% increase. After 10 weeks, postprandial levels of triglycerides and de novo lipogenesis were, respectively, 78.6% and 75.4% higher in the fructose group but only 15.2% and 27.3% higher in the glucose group. Apolipoprotein B concentrations and small, dense low-density lipoprotein concentrations were also increased in participants consuming fructose, but not in those consuming glucose. Collectively, these results indicate that consumption of fructose, as opposed to glucose, promotes the development of an atherogenic lipid profile. In line with this, other human studies showed that fructose is a more potent stimulus than glucose in inducing early features of the metabolic syndrome. For example, in obese male and female participants who consumed fructose-sweetened beverages (providing 25% of energy requirements) for 10 weeks, 24-hour profiles of plasma uric acid and gamma-glutamyl transferase showed elevated levels, which are characteristic early signs of the metabolic syndrome.44 These features were absent in the control group, who consumed glucose-sweetened beverages instead. Likewise, levels of retinol-binding protein 4, an adipokine linked to increased visceral adiposity and hepatic insulin resistance, were also elevated in the fructose group, but not in the glucose group.45
A randomized crossover study performed in healthy human subjects investigated the cardiovascular effects of consuming 500-mL drinks containing 60 g of either fructose or glucose.46 Heart rate, arterial blood pressure, and cardiac output were measured 30 minutes before and 2 hours after each drink was consumed. Both drinks increased heart rate and cardiac output, but fructose, and not glucose, significantly increased blood pressure. The divergent blood pressure response by fructose and glucose was explained by the observation that glucose, but not fructose, decreased peripheral resistance, which protected against blood pressure increase. Thus, comparing the metabolic effects of fructose and glucose, it is clear that fructose is of greater pathologic nature and is therefore the subject of more intense scientific investigation. Animal models of fructose-fed rats and experiments with rat skeletal muscle cells have been employed in attempts to tease out the adverse effects of fructose in the body and the potential effects of fructose on skeletal muscle. As fructose is a metabolic molecule, its adverse effects on skeletal muscle have long been thought to be mediated via the energy-producing mitochondria.
EVIDENCE OF FRUCTOSE-INDUCED PRODUCTION OF MITOCHONDRIAL ROS IN SKELETAL MUSCLE
Mitochondria are known as the powerhouses of a cell because they provide energy via the burning of fuels such as fats and sugar-derived substrates.47 Mitochondria have also been shown to be a major site of ROS production in various tissues, including skeletal muscle.47 Reactive oxygen species are formed when electrons leak from the electron transfer system and reduce unbound oxygen within the mitochondria.48 In a healthy cell, ROS are well regulated by the antioxidant defense system, allowing them to function as signaling molecules in essential cellular processes such as gene transcription and protein synthesis.49,50 However, when the ROS produced exceed the regulatory capabilities of the antioxidant defense system, they destroy lipids, DNA, and proteins and initiate apoptotic signals that lead to cell death, as illustrated in Figure 1.51 High fructose consumption in both human and animal studies has been reported to increase mitochondrial ROS production in skeletal muscle.37,52,53 In one study, human participants consumed 3 g of fructose per kilogram of body weight per day as a 20% fructose solution for 9 weeks.54 Muscle protein homogenate analysis from these participants showed that the fructose diet increased levels of thiobarbituric acid–reactive substances (markers of oxidative stress) and protein carbonylation (marker of protein oxidation).54 The study further demonstrated that fructose reduced mitochondrial respiration and downregulated mitochondrial genes, suggesting that fructose-induced ROS production might play a crucial role in mitochondrial dysfunction in skeletal muscle.
Figure 1.
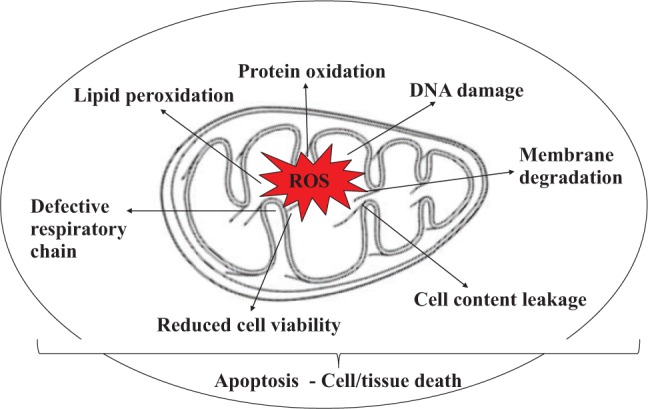
Effects of reactive oxygen species (ROS) accumulation on cellular functions. ROS induce DNA damage, protein oxidation, and lipid peroxidation, which cause mitochondrial dysfunction via impaired mitochondrial respiration and reduced ATP production.
Another study assessed the role of oxidative stress in the development of mitochondrial abnormalities in mice that were fed a high-fructose/high-sucrose diet (HFHSD).55 After 16 weeks of feeding, levels of hydrogen peroxide and protein carbonylation in muscle were higher in HFHSD-fed mice than in the control mice. In addition, the ratio of mitochondrial DNA to nuclear DNA in skeletal muscle was significantly lower in the HFHSD-fed mice. Messenger RNA levels of cytochrome c oxidase and peroxisome proliferator-activated receptor-γ coactivator 1α were also significantly lower in the skeletal muscle of the HFHSD-fed mice. Overall, these results suggest that a HFHSD diet increases ROS production within the mitochondria of skeletal muscle and causes simultaneous mitochondrial alterations. A recent in vitro study by Jaiswal et al.37 investigated the effects of 15 mM fructose on L6 skeletal muscle tubes (24-hour fructose exposure) and found increased mitochondrial ROS and reduced antioxidant enzymes. There were also significant declines in mitochondrial DNA content, adenosine triphosphate (ATP) synthesis, mitochondrial membrane potential, and activities of mitochondrial respiratory complexes. Results from all these studies indicate that fructose leads to excessive ROS production in the skeletal muscle and has deleterious effects on skeletal muscle mitochondria. The mechanisms underlying these adverse effects of fructose in skeletal muscle have not been fully investigated. However, since fructose has potent lipogenic effects in the liver, the role of excess lipids in ROS production in muscle has been extensively investigated.
Role of fructose-induced lipogenesis in production of ROS in skeletal muscle
Upon ingestion, fructose is transported by glucose transporter 5 in the epithelial cells lining the jejunum and is released into the portal circulation, where 50% to 75% is taken up and metabolized by hepatocytes and the remainder is taken up into other organs such as the kidney, testis, adipocytes, and skeletal muscle.56,57 As reviewed extensively elsewhere,58–60 fructose consumption increases de novo lipogenesis in hepatocytes. In one study, rats given 10% fructose in drinking water for 10 weeks were found to have increased liver triglycerides and cholesterol levels.52 The study established that fructose-induced hepatic de novo lipogenesis was mediated by increased activities of hepatic fatty acid synthase, ATP citrate lyase, and acetyl coenzyme A carboxylase and by reduced levels of the fat oxidation enzyme, enoyl–coenzyme A hydratase 1. De novo lipogenesis in the liver is accompanied by an increased release of lipids into the general circulation. Faeh et al.61 reported that consumption of a high-fructose diet by humans for 6 days increased plasma triglyceride concentrations by 79%, which caused increased uptake by adipocytes and ectopic tissues such as skeletal muscle.
Accumulating data indicate that excessive intramyocellular lipids increase the production of ROS and reactive nitrogen species.62–64 Furthermore, lipid infusion or administration of a high-fat diet to healthy humans and rodents causes mitochondrial dysfunction and reduces ATP synthesis, oxygen consumption, and oxidative phosphorylation.65–68 These findings were validated by in vitro studies in which treatment of cultured skeletal muscle cells with palmitic acid increased ROS production, impaired fatty acid oxidation, and decreased expression of peroxisome proliferator-activated receptor-γ coactivator 1α.69–71 Other studies have shown that saturated fatty acids directly induce mitochondrial dysfunction in C2C12 skeletal muscle cells, as evidenced by reduced ATP synthesis and mitochondrial polarization.72 In concert, these studies show that fructose-induced ROS production in skeletal muscle may be caused by the toxic lipogenic effects of fructose. Lambertucci et al.64 demonstrated, using primary skeletal muscle cultures, that fatty acids such as palmitate induce superoxide production, in part, via activation of NADPH (nicotinamide adenine dinucleotide phosphate) oxidase (NOX). NOX is a multisubunit enzyme that catalyzes the reduction of molecular oxygen to produce superoxide using NADH (nicotinamide adenine dinucleotide) or NADPH as the electron donor.73 Results from the above studies indicate that fructose-induced lipogenesis not only has toxic effects but also alters events at the molecular level in skeletal muscle.
URIC ACID AND TRANSFORMING GROWTH FACTOR-β1 IN FRUCTOSE-INDUCED PRODUCTION OF ROS
In vitro studies conducted in hepatocytes and other types of cells suggest that, besides increasing ROS production through its lipogenic effects, fructose can also increase ROS production via other mechanisms.74–76 As mentioned earlier, ingested fructose is taken up primarily by hepatocytes and is rapidly phosphorylated to form fructose-1-phosphate by ketohexokinase.77 The ketohexokinase reaction uses ATP rapidly and lowers ATP and phosphate levels inside hepatocytes.6,78 The decrease in intracellular phosphate activates adenosine monophosphate (AMP) deaminase, which stimulates flux through the purine degradation pathway to increase uric acid production (Figure 2).79,80 Both human and animal studies have shown that serum uric acid levels increase rapidly after ingestion of fructose.75,81 Jia et al.75 found that serum uric acid levels and oxidative stress increased in mice fed a high-fat, high-fructose diet for 16 weeks. An in vitro study in which adipocytes were treated with varying concentrations of uric acid for 30 minutes demonstrated dose-dependent increases in ROS production that occurred via Nox4 activation.76
Figure 2.
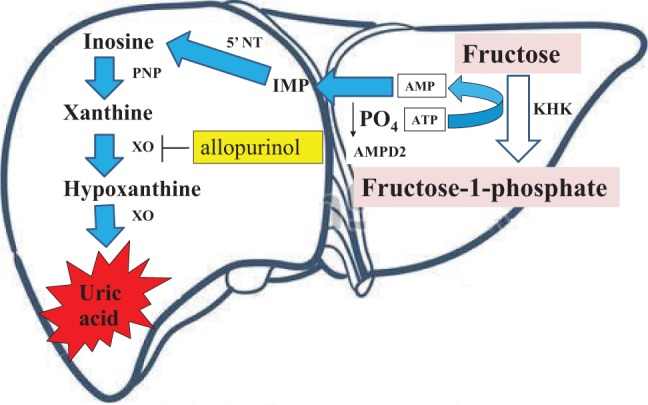
Fructose-induced activation of the purine pathway. Fructose is rapidly phosphorylated in the hepatocyte by ketohexokinase (KHK) to fructose-1-phosphate, which uses adenosine triphosphate (ATP) as a phosphate donor. Intracellular phosphate (PO4) levels decrease, stimulating the activity of adenosine monophosphate (AMP) deaminase 2 (AMPD2). AMPD2 converts AMP to inosine monophosphate (IMP). IMP is metabolized to inosine by 5′ nucleotidase (5′ NT), which is further degraded to xanthine by purine nucleoside phosphorylase (PNP). Xanthine is converted to hypoxanthine by xanthine oxidase (XO), ultimately generating uric acid. This pathway may be inhibited by the XO inhibitor, allopurinol.
Lanaspa et al.43 treated hepatocytes with fructose and observed a dose-dependent increase in uric acid production. Further experiments showed that uric acid also induced mitochondrial ROS production in a dose-dependent manner. To elucidate whether uric acid–induced ROS production occurred via Nox4, they silenced the Nox4 gene using interfering RNA and observed diminished ROS production. Similar findings were reported in another study conducted in human aortic cells that were exposed to uric acid for 48 hours.82 Uric acid caused a 200% increase in the level of intracellular ROS, but this increase was inhibited by apocynin (a Nox4 inhibitor). The same study also reported a 43% reduction in intracellular ATP concentration and a 50% reduction in mitochondrial DNA. Collectively, these studies indicate that fructose exposure or ingestion increases uric acid, which in turn activates NOX4 to increase ROS production.
Recent studies in humans, animals, and various cell lines have also reported a link between uric acid levels and transforming growth factor (TGF)-β1, a multifunctional cytokine that regulates cell proliferation and differentiation.83–86 Talaat and El-Sheikh81 conducted a 2-year cross-sectional study in patients with chronic kidney disease and demonstrated that hyperuricemia increases TGF-β1 excretion. Likewise, kidney epithelial cells isolated from diabetic rats were shown to have increased levels of TGF-β1, which depended on mitogen-activated protein kinase signaling when cultured in 5 mM uric acid.87 Rat glomerular mesangial cells exposed to uric acid (0.05–0.4 mmol/L) for 24 to 48 hours had upregulated levels of TGF-β1 mRNA that were dependant on both concentration and exposure time. These studies demonstrated that uric acid increases ROS production not only via activation of Nox4 but also by upregulating TGF-β1 (Figure 3).
Figure 3.

Proposed pathway of fructose-induced ROS production in skeletal muscle. NADPH oxidase-4 (Nox4)-induced oxidative stress in response to fructose-induced production of uric acid, which upregulates transforming growth factor (TGF)-β1. TGF-β1 induces Nox4 activation and Nox4-dependent mitochondrial ROS generation. Inhibition of uric acid production by allopurinol, together with inhibition of TGF-β1 signaling TGF-β1-specific receptor inhibitor and Nox4 with small interfering RNA (siRNA), abrogates induction of Nox4 and subsequent ROS production.
Evidence indicating the existence of a signaling pathway linking TGF-β1, Nox4, and ROS initiated by fructose exposure or ingestion is therefore accumulating. For example, treatment of a mouse osteoblastic cell line88 and kidney fibroblasts83 with TGF-β1 (5 ng/mL) caused time-dependent increases in ROS production. In addition, suppression of the Nox4 gene with small interfering RNA prevented ROS production by TGF-β189; suggesting that, like uric acid, TGF-β1 also stimulates ROS production via Nox4 activation. Further evidence of this pathway was verified when primary cultures of rat and human hepatocytes exposed to TGF-β1 displayed increased levels of Nox4, ROS, caspase activation, apoptosis, and cell death, all of which were attenuated by targeted knockdown of a Nox4 gene.74 Similar findings have been reported in lung mesenchymal cells and differentiated myofibroblasts.89 As with uric acid, TGF-β1–induced ROS production is also associated with mitochondrial dysfunction in podocytes.90 It seems reasonable to hypothesize, on the basis of these experiments, that fructose may cause increased ROS production in skeletal muscle by a cascade of events involving increased uric acid levels, TGF-β1 upregulation, and Nox4 activation.
There is sufficient evidence that fructose-induced uric acid release from hepatocytes contributes to oxidative stress in extrahepatic tissues.52,91 Uric acid is taken up by adipocytes through an organic anion transporter, after which oxidative stress is induced via activation of NOX. This generates oxidization of lipids and production of inflammatory mediators such as monocyte chemoattractant protein 1.52,91 Animal and in vitro studies have shown that uric acid also affects vascular tissue by reducing endothelial nitric oxide, impairing endothelial function, and generating oxidants.82,92,93 As indicated above, most studies of the effects of fructose on uric acid, Nox4, and ROS have been conducted in hepatocytes, whereas the effects of uric acid and TGF-β1 on Nox4 and ROS have been conducted in a variety of cell types, including lung mesenchymal cells, mouse osteoblastic cells, podocytes, and kidney cells. It appears that no study has rigorously investigated these signaling pathways in skeletal muscle. Future studies could therefore investigate the existence of such a pathway upon fructose exposure in an intact system or a single cell type.
OTHER POSSIBLE MECHANISMS OF ROS GENERATION IN SKELETAL MUSCLE CELLS
Reactive oxygen species are generated in the mitochondria not only by the electron transport system and Nox4 but also by other enzymes such as xanthine oxidoreductase/oxidase, nitric oxide synthase, lipoxygenases, glucose oxidase, myeloperoxidase, and cyclooxygenases.94 Many in vitro and animal studies have shown that fructose increases ROS production via activation of xanthine oxidase, since inhibition of this enzyme by allopurinol attenuates the ROS-producing effects of fructose.43,52,53,69,75,78,95 Xanthine oxidase not only produces ROS via uric acid but also catalyzes the reduction of oxygen to superoxide96 and is present in the cytosol of skeletal muscle cells.97 The substrate for lipoxygenase is arachidonic acid, which is released upon activation of phospholipase A2.98 Kelley et al.99 fed rats a high-fructose diet for 14 days and observed that treatment with a lipoxygenase inhibitor reversed oxidative stress in the liver. They concluded that fructose increases ROS production via activation of lipoxygenase. Because increased activities of phospholipase A2 and lipoxygenase have been shown to promote ROS production in skeletal muscle mitochondria,98,100,101 it is reasonable to hypothesize that fructose may influence the activities of these enzymes in skeletal muscle as well.
Furthermore, Shinozaki et al.102 observed that increased ROS levels in fructose-fed rats are associated not only with increased NOX activity but also with elevated levels of angiotensin II. The mechanism by which fructose increases angiotensin II is still not known. However, it is well established that angiotensin II, acting through angiotensin II type 1 receptor, stimulates NOX to generate ROS. Others have shown that angiotensin II administration increases ROS in skeletal muscle, and blockade of the receptor with losartan attenuates the effect in vitro.103,104 The above observations raise suspicion that fructose may induce ROS production in skeletal muscle via additional mechanisms that involve angiotensin, xanthine oxidoreductase/oxidase, and lipoxygenase.
CONCLUSION
Excessive consumption of fructose increases ROS production in skeletal muscle, leading to impaired cellular function. The underlying mechanisms, however, are not fully known. Studies conducted in liver cells have shown that fructose-induced ROS production occurs via uric acid production and Nox4 activation. In other types of cells, uric acid has been shown to activate Nox4 via upregulation of TGF-β1. Since fructose increases the production of uric acid, which circulates throughout the body, its detrimental effects in skeletal muscle might likewise be attributed to TGF-β1 and Nox4. Further investigations are recommended to test this hypothesis in skeletal muscle.
Acknowledgments
Funding. The authors are grateful to the National Research Foundation of South Africa for funding. The funder had no role in the design, performance, or final approval of the review.
Declaration of interest. The authors have no relevant interests to declare.
References
- 1.Bray GA, Popkin BM. Dietary fat intake does affect obesity! Am J Clin Nutr. 1998;68:1157–1173. [DOI] [PubMed] [Google Scholar]
- 2.Elliott SS, Keim NL, Stern JS, et al. Fructose, weight gain, and the insulin resistance syndrome. Am J Clin Nutr. 2002;76:911–922. [DOI] [PubMed] [Google Scholar]
- 3.Putnam JJ, Allshouse JE. Food Consumption, Prices, and Expenditures, 1970–93. Washington, DC, USA: US Department of Agriculture, Economic Research Service; 1994. [Google Scholar]
- 4.Bray GA, Nielsen SJ, Popkin BM. Consumption of high-fructose corn syrup in beverages may play a role in the epidemic of obesity. Am J Clin Nutr. 2004;79:537–543. [DOI] [PubMed] [Google Scholar]
- 5.Basciano H, Federico L, Adeli K. Fructose, insulin resistance, and metabolic dyslipidemia. Nutr Metabol. 2005;2:5–18. [DOI] [PMC free article] [PubMed] [Google Scholar]
- 6.Johnson RJ, Perez-Pozo SE, Sautin YY, et al. Hypothesis: could excessive fructose intake and uric acid cause type 2 diabetes? Endocr Rev. 2009;30:96–116. [DOI] [PMC free article] [PubMed] [Google Scholar]
- 7.Duffey KJ, Popkin BM. High-fructose corn syrup: is this what's for dinner? Am J Clin Nutr. 2008;88:1722S–1732S. [DOI] [PMC free article] [PubMed] [Google Scholar]
- 8.Ervin RB, Ogden CL. Consumption of added sugars among US adults, 2005–2010. NCHS Data Brief. 2013;122:1–8. [PubMed] [Google Scholar]
- 9.Ervin RB, Kit BK, Carroll MD, et al. Consumption of Added Sugar among US Children and Adolescents, 2005–2008. Hyattsville, MD, USA: National Center for Health Statistics; 2012. NCHS Data Brief. no. 87. [Google Scholar]
- 10.Steyn NP, Temple NJ. Evidence to support a food-based dietary guideline on sugar consumption in South Africa. BMC Public Health. 2012;12:502–509. [DOI] [PMC free article] [PubMed] [Google Scholar]
- 11.Kok P, Collinson M. Migration and Urbanisation in South Africa. Pretoria, South Africa: Statistics South Africa; 2006. Report 03-04-02. [Google Scholar]
- 12.Reddy SP, Resnicow K, James S, et al. Rapid increases in overweight and obesity among South African adolescents: comparison of data from the South African National Youth Risk Behaviour Survey in 2002 and 2008. Am J Public Health. 2012;102:262–268. [DOI] [PMC free article] [PubMed] [Google Scholar]
- 13.Rippe JM, Angelopoulos TJ. Fructose-containing sugars and cardiovascular disease. Adv Nutr. 2015;6:430–439. [DOI] [PMC free article] [PubMed] [Google Scholar]
- 14.Sievenpiper JL, Chiavaroli L, de Souza RJ, et al. ‘Catalytic’ doses of fructose may benefit glycaemic control without harming cardiometabolic risk factors: a small meta-analysis of randomised controlled feeding trials. Br J Nutr. 2012;108:418–423. [DOI] [PMC free article] [PubMed] [Google Scholar]
- 15.Chiavaroli L, de Souza RJ, Ha V, et al. Effect of fructose on established lipid targets: a systematic review and meta-analysis of controlled feeding trials. J Am Heart Assoc. 2015;4:1–23. [DOI] [PMC free article] [PubMed] [Google Scholar]
- 16.Madero M, Castellanos FER, Jalal D, et al. A pilot study on the impact of a low fructose diet and allopurinol on clinic blood pressure among overweight and prehypertensive subjects: a randomized placebo controlled trial. J Am Soc Hypertens. 2015;9:837–844. [DOI] [PubMed] [Google Scholar]
- 17.Ford ES, Mokdad AH. Fruit and vegetable consumption and diabetes mellitus incidence among US adults. Prev Med. 2001;32:33–39. [DOI] [PubMed] [Google Scholar]
- 18.Miller AB, Altenburg HP, Bueno-de-Mesquita B, et al. Fruits and vegetables and lung cancer: findings from the European Prospective Investigation into Cancer and Nutrition. Int J Cancer. 2004;108:269–276. [DOI] [PubMed] [Google Scholar]
- 19.Cao G, Russell RM, Lischner N, et al. Serum antioxidant capacity is increased by consumption of strawberries, spinach, red wine or vitamin C in elderly women. J Nutr. 1998;128:2383–2390. [DOI] [PubMed] [Google Scholar]
- 20.Miller ER, Appel LJ, Risby TH. Effect of dietary patterns on measures of lipid peroxidation: results from a randomized clinical trial. Circulation. 1998;98:2390–2395. [DOI] [PubMed] [Google Scholar]
- 21.Busserolles J, Rock E, Gueux E, et al. Short-term consumption of a high-sucrose diet has a pro-oxidant effect in rats. Br J Nutr. 2002;87:337–342. [DOI] [PubMed] [Google Scholar]
- 22.Coffee EM, Yerkes L, Ewen EP, et al. Increased prevalence of mutant null alleles that cause hereditary fructose intolerance in the American population. J Inherit Metab Dis. 2010;33:33–42. [DOI] [PMC free article] [PubMed] [Google Scholar]
- 23.Delbosc S, Paizanis E, Magous R, et al. Involvement of oxidative stress and NADPH oxidase activation in the development of cardiovascular complications in a model of insulin resistance, the fructose-fed rat. Atherosclerosis. 2005;179:43–49. [DOI] [PubMed] [Google Scholar]
- 24.Kunde SS, Roede JR, Vos MB, et al. Hepatic oxidative stress in fructose-induced fatty liver is not caused by sulfur amino acid insufficiency. Nutrients. 2011;3:987–1002. [DOI] [PMC free article] [PubMed] [Google Scholar]
- 25.Mellor K, Ritchie RH, Meredith G, et al. High-fructose diet elevates myocardial superoxide generation in mice in the absence of cardiac hypertrophy. Nutrition. 2010;26:842–848. [DOI] [PubMed] [Google Scholar]
- 26.Nyby MD, Abedi K, Smutko V, et al. Vascular angiotensin type 1 receptor expression is associated with vascular dysfunction, oxidative stress and inflammation in fructose-fed rats. Hypertens Res. 2007;30:451–457. [DOI] [PubMed] [Google Scholar]
- 27.Ogrunc M, Di Micco R, Liontos M, et al. Oncogene-induced reactive oxygen species fuel hyperproliferation and DNA damage response activation. Cell Death Differ. 2014;21:998–1012. [DOI] [PMC free article] [PubMed] [Google Scholar]
- 28.Kim J, Seok YM, Jung K-J, et al. Reactive oxygen species/oxidative stress contributes to progression of kidney fibrosis following transient ischemic injury in mice. Am J Renal Physiol. 2009;297:F461–F470. [DOI] [PubMed] [Google Scholar]
- 29.Matough FA, Budin SB, Hamid ZA, et al. The role of oxidative stress and antioxidants in diabetic complications. Sultan Qaboos Univ Med J. 2012;12:5–18. [DOI] [PMC free article] [PubMed] [Google Scholar]
- 30.Nishikawa T, Araki E. Impact of mitochondrial ROS production in the pathogenesis of diabetes mellitus and its complications. Antioxid Redox Sign. 2007;9:343–353. [DOI] [PubMed] [Google Scholar]
- 31.Bugger H. Molecular mechanisms for myocardial mitochondrial dysfunction in the metabolic syndrome. Clin Sci. 2008;114:195–210. [DOI] [PubMed] [Google Scholar]
- 32.Ceriello A, Motz E. Is oxidative stress the pathogenic mechanism underlying insulin resistance, diabetes, and cardiovascular disease? The common soil hypothesis revisited. Arterioscler Thromb Vasc Biol. 2004;24:816–823. [DOI] [PubMed] [Google Scholar]
- 33.Ferder L, Ferder MD, Inserra F. The role of high-fructose corn syrup in metabolic syndrome and hypertension. Curr Hypertens Rep. 2010;12:105–112. [DOI] [PubMed] [Google Scholar]
- 34.Ludwig DS, Peterson KE, Gortmaker SL. Relation between consumption of sugar-sweetened drinks and childhood obesity: a prospective, observational analysis. Lancet. 2001;357:505–508. [DOI] [PubMed] [Google Scholar]
- 35.Schulze MB, Manson JE, Ludwig DS, et al. Sugar-sweetened beverages, weight gain, and incidence of type 2 diabetes in young and middle-aged women. J Am Med Assoc. 2004;292:927–934. [DOI] [PubMed] [Google Scholar]
- 36.Stanhope KL, Havel PJ. Endocrine and metabolic effects of consuming beverages sweetened with fructose, glucose, sucrose, or high-fructose corn syrup. Am J Clin Nutr. 2008;88:1733S–1737S. [DOI] [PMC free article] [PubMed] [Google Scholar]
- 37.Jaiswal N, Maurya C, Arha D, et al. Fructose induces mitochondrial dysfunction and triggers apoptosis in skeletal muscle cells by provoking oxidative stress. Apoptosis. 2015:1–18. [DOI] [PubMed] [Google Scholar]
- 38.Darakhshan F, Hajduch E, Kristiansen S, et al. Biochemical and functional characterization of the GLUT5 fructose transporter in rat skeletal muscle. Biochem J. 1998;336:361–366. [DOI] [PMC free article] [PubMed] [Google Scholar]
- 39.Stuart CA, Yin D, Howell ME, et al. Hexose transporter mRNAs for GLUT4, GLUT5, and GLUT12 predominate in human muscle. Am J Physiol Endocrinol Metabol. 2006;291:E1067–E1073. [DOI] [PubMed] [Google Scholar]
- 40.Crescenzo R, Bianco F, Falcone I, et al. Increased hepatic de novo lipogenesis and mitochondrial efficiency in a model of obesity induced by diets rich in fructose. Eur J Nutr. 2013;52:537–545. [DOI] [PubMed] [Google Scholar]
- 41.Warren BE, Lou P-H, Lucchinetti E, et al. Early mitochondrial dysfunction in glycolytic muscle, but not oxidative muscle, of the fructose-fed insulin-resistant rat. Am J Physiol Endocrinol Metabol. 2014;306:E658–E667. [DOI] [PMC free article] [PubMed] [Google Scholar]
- 42.Zierath J, Nolte L, Wahlstrom E, et al. Carrier-mediated fructose uptake significantly contributes to carbohydrate metabolism in human skeletal muscle. Biochem J. 1995;311:517–521. [DOI] [PMC free article] [PubMed] [Google Scholar]
- 43.Lanaspa MA, Sanchez-Lozada LG, Choi Y-J, et al. Uric acid induces hepatic steatosis by generation of mitochondrial oxidative stress: potential role in fructose-dependent and -independent fatty liver. J Biol Chem. 2012;287:40732–40744. [DOI] [PMC free article] [PubMed] [Google Scholar]
- 44.Yamada J, Tomiyama H, Yambe M, et al. Elevated serum levels of alanine aminotransferase and gamma glutamyltransferase are markers of inflammation and oxidative stress independent of the metabolic syndrome. Atherosclerosis. 2006;189:198–205. [DOI] [PubMed] [Google Scholar]
- 45.Yang Q, Graham TE, Mody N, et al. Serum retinol binding protein 4 contributes to insulin resistance in obesity and type 2 diabetes. Nature. 2005;436:356–362. [DOI] [PubMed] [Google Scholar]
- 46.Brown CM, Dulloo AG, Yepuri G, et al. Fructose ingestion acutely elevates blood pressure in healthy young humans. Am J Regul, Integr Comp Physiol. 2008;294:R730–R737. [DOI] [PubMed] [Google Scholar]
- 47.Patti M-E, Corvera S. The role of mitochondria in the pathogenesis of type 2 diabetes. Endocrine Rev. 2010;31:364–395. [DOI] [PMC free article] [PubMed] [Google Scholar]
- 48.Martins AR, Nachbar RT, Gorjao R, et al. Mechanisms underlying skeletal muscle insulin resistance induced by fatty acids: importance of the mitochondrial function. Lipids Health Dis. 2012;11:1–11. [DOI] [PMC free article] [PubMed] [Google Scholar]
- 49.Clempus RE, Griendling KK. Reactive oxygen species signaling in vascular smooth muscle cells. Cardiovasc Res. 2006;71:216–225. [DOI] [PMC free article] [PubMed] [Google Scholar]
- 50.Hamanaka RB, Chandel NS. Mitochondrial reactive oxygen species regulate cellular signaling and dictate biological outcomes. Trends Biochem Sci. 2010;35:505–513. [DOI] [PMC free article] [PubMed] [Google Scholar]
- 51.Desai KM, Chang T, Wang H, et al. Oxidative stress and aging: is methylglyoxal the hidden enemy? Can J Physiol Pharmacol. 2010;88:273–284. [DOI] [PubMed] [Google Scholar]
- 52.Lanaspa MA, Sanchez-Lozada LG, Cicerchi C, et al. Uric acid stimulates fructokinase and accelerates fructose metabolism in the development of fatty liver. PLoS One. 2012;7:e47948–e47958. [DOI] [PMC free article] [PubMed] [Google Scholar]
- 53.Lanaspa MA, Tapia E, Soto V, et al. Uric acid and fructose: potential biological mechanisms. Seminars in Nephrology, Elsevier 2011;31:426–432. [DOI] [PubMed] [Google Scholar]
- 54.Hokayem M, Blond E, Vidal H, et al. Grape polyphenols prevent fructose-induced oxidative stress and insulin resistance in first-degree relatives of type 2 diabetic patients. Diabetes Care. 2013;36:1454–1461. [DOI] [PMC free article] [PubMed] [Google Scholar]
- 55.Bonnard C, Durand A, Peyrol S, et al. Mitochondrial dysfunction results from oxidative stress in the skeletal muscle of diet-induced insulin-resistant mice. J Clin Invest. 2008;118:789–800. [DOI] [PMC free article] [PubMed] [Google Scholar]
- 56.Van den Berghe G. Fructose: metabolism and short-term effects on carbohydrate and purine metabolic pathways. Prog Biochem Pharmacol. 1985;21:1–32. [PubMed] [Google Scholar]
- 57.Tappy L, Lê K-A. Metabolic effects of fructose and the worldwide increase in obesity. Physiol Rev. 2010;90:23–46. [DOI] [PubMed] [Google Scholar]
- 58.Lam YY, Ha CW, Campbell CR, et al. Increased gut permeability and microbiota change associate with mesenteric fat inflammation and metabolic dysfunction in diet-induced obese mice. PLoS One. 2012;7:e34233–e34243. [DOI] [PMC free article] [PubMed] [Google Scholar]
- 59.McDevitt RM, Bott SJ, Harding M, et al. De novo lipogenesis during controlled overfeeding with sucrose or glucose in lean and obese women. Am J Clin Nutr. 2001;74:737–746. [DOI] [PubMed] [Google Scholar]
- 60.Samuel VT. Fructose induced lipogenesis: from sugar to fat to insulin resistance. Trends Endocrinol Metabol. 2011;22:60–65. [DOI] [PubMed] [Google Scholar]
- 61.Faeh D, Minehira K, Schwarz J-M, et al. Effect of fructose overfeeding and fish oil administration on hepatic de novo lipogenesis and insulin sensitivity in healthy men. Diabetes. 2005;54:1907–1913. [DOI] [PubMed] [Google Scholar]
- 62.Carvalho-Filho MA, Ueno M, Hirabara SM, et al. S-nitrosation of the insulin receptor, insulin receptor substrate 1, and protein kinase B/Akt: a novel mechanism of insulin resistance. Diabetes. 2005;54:959–967. [DOI] [PubMed] [Google Scholar]
- 63.Duval C, Müller M, Kersten S. PPARα and dyslipidemia. Biochim Biophys Acta. 2007;1771:961–971. [DOI] [PubMed] [Google Scholar]
- 64.Lambertucci RH, Hirabara SM, Silveira LdR, et al. Palmitate increases superoxide production through mitochondrial electron transport chain and NADPH oxidase activity in skeletal muscle cells. J Cell Physiol. 2008;216:796–804. [DOI] [PubMed] [Google Scholar]
- 65.Brehm A, Krssak M, Schmid AI, et al. Increased lipid availability impairs insulin-stimulated ATP synthesis in human skeletal muscle. Diabetes. 2006;55:136–140. [PubMed] [Google Scholar]
- 66.Chanseaume E, Malpuech-Brugère C, Patrac V, et al. Diets high in sugar, fat, and energy induce muscle type–specific adaptations in mitochondrial functions in rats. J Nutr. 2006;136:2194–2200. [DOI] [PubMed] [Google Scholar]
- 67.Sparks LM, Xie H, Koza RA, et al. A high-fat diet coordinately downregulates genes required for mitochondrial oxidative phosphorylation in skeletal muscle. Diabetes. 2005;54:1926–1933. [DOI] [PubMed] [Google Scholar]
- 68.Szendroedi J, Chmelik M, Schmid AI, et al. Abnormal hepatic energy homeostasis in type 2 diabetes. Hepatology. 2009;50:1079–1086. [DOI] [PubMed] [Google Scholar]
- 69.Desco M-C, Asensi M, Márquez R, et al. Xanthine oxidase is involved in free radical production in type 1 diabetes protection by allopurinol. Diabetes. 2002;51:1118–1124. [DOI] [PubMed] [Google Scholar]
- 70.Erdei N, Tóth A, Pásztor ET, et al. High-fat diet-induced reduction in nitric oxide-dependent arteriolar dilation in rats: role of xanthine oxidase-derived superoxide anion. Am J Heart Circ Physiol. 2006;291:H2107–H2115. [DOI] [PubMed] [Google Scholar]
- 71.Pimenta A, Gaidhu M, Habib S, et al. Prolonged exposure to palmitate impairs fatty acid oxidation despite activation of AMP-activated protein kinase in skeletal muscle cells. J Cell Physiol. 2008;217:478–485. [DOI] [PubMed] [Google Scholar]
- 72.Hirabara SM, Curi R, Maechler P. Saturated fatty acid-induced insulin resistance is associated with mitochondrial dysfunction in skeletal muscle cells. J Cell Physiol. 2010;222:187–194. [DOI] [PubMed] [Google Scholar]
- 73.Ago T, Kuroda J, Pain J, et al. Upregulation of NOX-4 by hypertrophic stimuli promotes apoptosis and mitochondrial dysfunction in cardiac myocytes. Circ Res. 2010;106:1253–1264. [DOI] [PMC free article] [PubMed] [Google Scholar]
- 74.Carmona-Cuenca I, Roncero C, Sancho P, et al. Upregulation of the NADPH oxidase NOX-4 by TGF-β in hepatocytes is required for its pro-apoptotic activity. J Hepatol. 2008;49:965–976. [DOI] [PubMed] [Google Scholar]
- 75.Jia G, Habibi J, Bostick BP, et al. Uric acid promotes left ventricular diastolic dysfunction in mice fed a Western diet. Hypertension. 2014;65:531–539. [DOI] [PMC free article] [PubMed] [Google Scholar]
- 76.Sautin YY, Nakagawa T, Zharikov S, et al. Adverse effects of the classic antioxidant uric acid in adipocytes: NADPH oxidase-mediated oxidative/nitrosative stress. Am J Cell Physiol. 2007;293:C584–C596. [DOI] [PubMed] [Google Scholar]
- 77.Mayes PA. Intermediary metabolism of fructose. Am J Clin Nutr. 1993;58:754S–765S. [DOI] [PubMed] [Google Scholar]
- 78.Johnson RJ, Nakagawa T, Sanchez-Lozada LG, et al. Sugar, uric acid, and the etiology of diabetes and obesity. Diabetes. 2013;62:3307–3315. [DOI] [PMC free article] [PubMed] [Google Scholar]
- 79.van den Berghe G, Bronfman M, Vanneste R, et al. The mechanism of adenosine triphosphate depletion in the liver after a load of fructose. A kinetic study of liver adenylate deaminase. Biochem J. 1977;162:601–609. [DOI] [PMC free article] [PubMed] [Google Scholar]
- 80.Khitan Z, Kim DH. Fructose: a key factor in the development of metabolic syndrome and hypertension. J Nutr Metab. 2013;2013:1–13. [DOI] [PMC free article] [PubMed] [Google Scholar]
- 81.Talaat KM, El-Sheikh AR. The effect of mild hyperuricemia on urinary transforming growth factor beta and the progression of chronic kidney disease. Am J Nephrol. 2006;27:435–440. [DOI] [PubMed] [Google Scholar]
- 82.Sánchez-Lozada LG, Lanaspa MA, Cristóbal-García M, et al. Uric acid-induced endothelial dysfunction is associated with mitochondrial alterations and decreased intracellular ATP concentrations. Exp Nephrol. 2012;121:e71–e78. [DOI] [PMC free article] [PubMed] [Google Scholar]
- 83.Bondi CD, Manickam N, Lee DY, et al. NAD(P)H oxidase mediates TGF-β1–induced activation of kidney myofibroblasts. J Am Soc Nephrol. 2010;21:93–102. [DOI] [PMC free article] [PubMed] [Google Scholar]
- 84.Lin H-M, Lee J-H, Yadav H, et al. Transforming growth factor-β/Smad3 signaling regulates insulin gene transcription and pancreatic islet β-cell function. J Biol Chem. 2009;284:12246–12257. [DOI] [PMC free article] [PubMed] [Google Scholar]
- 85.Remy I, Montmarquette A, Michnick SW. PKB/Akt modulates TGF-β signalling through a direct interaction with Smad3. Nat Cell Biol. 2004;6:358–365. [DOI] [PubMed] [Google Scholar]
- 86.Sturrock A, Cahill B, Norman K, et al. Transforming growth factor-β1 induces Nox4 NAD(P)H oxidase and reactive oxygen species-dependent proliferation in human pulmonary artery smooth muscle cells. Am J Lung Cell Mol Physiol. 2006;290:L661–L673. [DOI] [PubMed] [Google Scholar]
- 87.Kim S-M, Choi Y-W, Seok H-Y, et al. Reducing serum uric acid attenuates TGF-β1-induced profibrogenic progression in type 2 diabetic nephropathy. Exp Nephrol. 2011;121:e109–e121. [DOI] [PubMed] [Google Scholar]
- 88.Ohba M, Shibanuma M, Kuroki T, et al. Production of hydrogen peroxide by transforming growth factor-β1 and its involvement in induction of egr-1 in mouse osteoblastic cells. J Cell Biol. 1994;126:1079–1088. [DOI] [PMC free article] [PubMed] [Google Scholar]
- 89.Hecker L, Vittal R, Jones T, et al. NADPH oxidase-4 mediates myofibroblast activation and fibrogenic responses to lung injury. Nat Med. 2009;15:1077–1081. [DOI] [PMC free article] [PubMed] [Google Scholar]
- 90.Stieger N, Worthmann K, Teng B, et al. Impact of high glucose and transforming growth factor–β on bioenergetic profiles in podocytes. Metabolism. 2012;61:1073–1086. [DOI] [PubMed] [Google Scholar]
- 91.Baldwin W, McRae S, Marek G, et al. Hyperuricemia as a mediator of the proinflammatory endocrine imbalance in the adipose tissue in a murine model of the metabolic syndrome. Diabetes. 2011;60:1258–1269. [DOI] [PMC free article] [PubMed] [Google Scholar]
- 92.Kanbay M, Segal M, Afsar B, et al. The role of uric acid in the pathogenesis of human cardiovascular disease. Heart. 2013;99:759–766. [DOI] [PubMed] [Google Scholar]
- 93.Sánchez-Lozada LG, Soto V, Tapia E, et al. Role of oxidative stress in the renal abnormalities induced by experimental hyperuricemia. Am J Renal Physiol. 2008;295:F1134–F1141. [DOI] [PMC free article] [PubMed] [Google Scholar]
- 94.Swindle EJ, Metcalfe DD. The role of reactive oxygen species and nitric oxide in mast cell-dependent inflammatory processes. Immunol Rev. 2007;217:186–205. [DOI] [PubMed] [Google Scholar]
- 95.Cirillo P, Gersch M, Mu W, et al. Ketohexokinase-dependent proinflammatory effect of fructose in human proximal tubular cells. J Am Soc Nephrol. 2009;20:545–553. [DOI] [PMC free article] [PubMed] [Google Scholar]
- 96.El-Bassossy HM, Watson ML. Xanthine oxidase inhibition alleviates the cardiac complications of insulin resistance: effect on low grade inflammation and the angiotensin system. J Transl Med. 2015;13:82–92. [DOI] [PMC free article] [PubMed] [Google Scholar]
- 97.Gomez-Cabrera MC, Borras C, Pallardo FV, et al. Decreasing xanthine oxidase-mediated oxidative stress prevents useful cellular adaptations to exercise in rats. J Physiol. 2005;567:113–120. [DOI] [PMC free article] [PubMed] [Google Scholar]
- 98.Nethery D, Callahan L, Stofan D, et al. PLA2 dependence of diaphragm mitochondrial formation of reactive oxygen species. J Appl Physiol. 2000;89:72–80. [DOI] [PubMed] [Google Scholar]
- 99.Kelley GL, Allan G, Azhar S. High dietary fructose induces a hepatic stress response resulting in cholesterol and lipid dysregulation. Endocrinology. 2004;145:548–555. [DOI] [PubMed] [Google Scholar]
- 100.Wang H, Li J, Follett PL, et al. 12-Lipoxygenase plays a key role in cell death caused by glutathione depletion and arachidonic acid in rat oligodendrocytes. Eur J Neurosci. 2004;20:2049–2058. [DOI] [PubMed] [Google Scholar]
- 101.Zuo L, Christofi FL, Wright VP, et al. Lipoxygenase-dependent superoxide release in skeletal muscle. J Appl Physiol. 2004;97:661–668. [DOI] [PubMed] [Google Scholar]
- 102.Shinozaki K, Ayajiki K, Nishio Y, et al. Evidence for a causal role of the renin-angiotensin system in vascular dysfunction associated with insulin resistance. Hypertension. 2004;43:255–262. [DOI] [PubMed] [Google Scholar]
- 103.Miatello R, Risler N, Castro C, et al. Aortic smooth muscle cell proliferation and endothelial nitric oxide synthase activity in fructose-fed rats. Am J Hypertens. 2001;14:1135–1141. [DOI] [PubMed] [Google Scholar]
- 104.Wei Y, Sowers JR, Nistala R, et al. Angiotensin II-induced NADPH oxidase activation impairs insulin signaling in skeletal muscle cells. J Biol Chem. 2006;281:35137–35146. [DOI] [PubMed] [Google Scholar]