Abstract
Herein we present the first experimental observation of the isolated nucleoside uridine, placed in the gas phase by laser ablation and characterized by Fourier transform microwave techniques. Free from the bulk effects of their native environments, anti/C2’-endo-g+ conformation has been revealed as the most stable form of uridine. Intramolecular hydrogen bonds involving uracil and ribose moieties have been found to play an important role in the stabilization of the nucleoside.
Keywords: microwave spectroscopy, nucleoside, laser ablation, conformational analysis, hydrogen bonding
Although some studies[1] have addressed the fundamental question “Why did nature choose the furanose and not the pyranose form of ribose in RNA?”, the question remains open. The chemical determinants by which nature selected furanosyl oligonucleotides have been reported elsewhere,[2] but base pairing strengths were not the critical selection criterion used. In fact, all families of oligonucleotides which contain pentopyranosyl units as sugar building blocks are found to be much stronger Watson-Crick base pairing systems than RNA. Structural arguments based on the intramolecular interactions between the uracil base and ribose moieties, which may contribute to stabilize the furanose versus the pyranose form, could be invoked. One obstacle to unveiling these intramolecular interactions arises from the ability of these basic structures to form strong intermolecular hydrogen bonds with polar solvents, which normally mask their intrinsic molecular properties. To date, no experiment has yet shown a nucleotide under isolation conditions to reveal its intramolecular interactions.
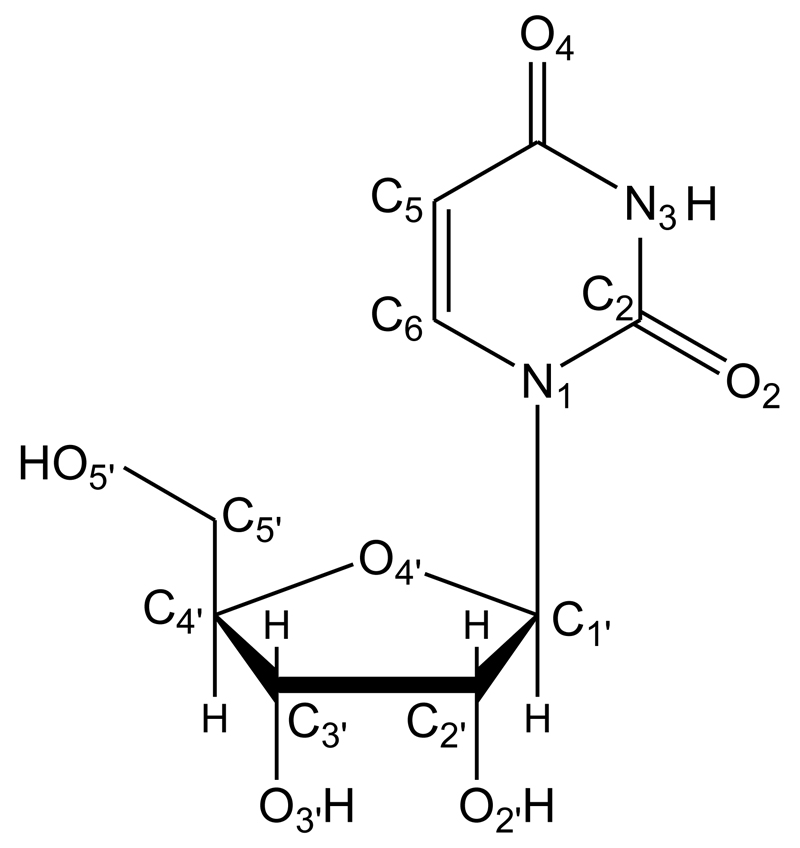
Fourier transform microwave spectroscopy is extremely sensitive to molecular geometry and has been proved to be a definitive tool in conformational analysis.[3] Coupled with laser ablation techniques it is being used to remove biological molecules from the solid state and to interrogate them in the cold, isolated environment of a supersonic expansion.[4] Using this powerful strategy, uracil[5] and thymine[6] nitrogen bases have been found to be in the diketo form (the canonical form), whereas isolated ribose[7] and 2-deoxyribose[8] have been unveiled in their pyranose forms, which are not present in the biologically relevant RNA and DNA. The good results achieved in these studies have boosted the present investigation of ribonucleoside uridine (C9H12N2O6), in which ribose and uracil join via a C1’-N1 glycosidic bond (see Scheme 1). An experiment exploring the conformational landscape of uridine should represent an exceptional source of reference data for a comprehensive analysis of the intramolecular interactions that contribute to stabilizing the furanose form in RNA.
Scheme 1.
Atom numbering and chemical structure of the nucleoside uridine.
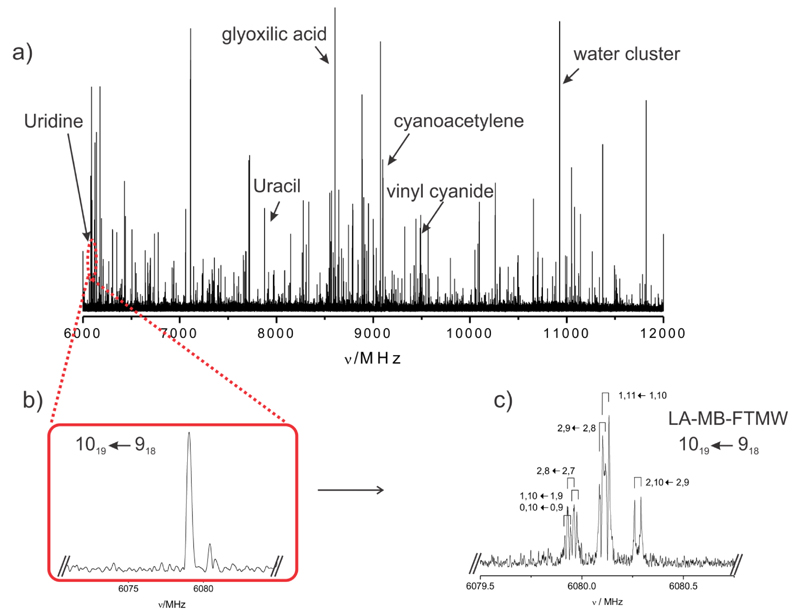
Uridine (m.p. 165°C) is a thermally fragile molecule and cannot be transferred intact into the vapor phase by using conventional heating methods. In an attempt to provide rotational signatures of the isolated uridine structures free from environmental disturbance, we have used a recently constructed broadband chirped pulse Fourier-transform microwave (CP-FTMW) spectrometer equipped with laser ablation vaporization system.[9] In the experimental procedure, finely powdered uridine was mixed with a small amount of a commercial binder and pressed into cylindrical rods which were ablated using the third harmonic (355 nm) of a picosecond laser. The vaporized products were seeded in Ne and expanded adiabatically into the vacuum chamber of the spectrometer and then probed by broadband chirped pulsed microwave spectroscopy. A high power excitation pulse of 300 W was used to polarize the molecules from 6 to 12 GHz. Up to 120 000 individual free induction decays at a 2 Hz repetition rate were averaged in the time domain and Fourier transformed to obtain the broadband frequency domain spectrum shown in Fig. 1a. Immediately significant photofragmentation effects were revealed in the congested rotational spectrum which appears to be dominated by the lines belonging to uracil[5] as well as some common decomposition lines (acetic acid, cyanoacetylene, glyoxylic acid, vinyl cyanide, glyceraldehide and water complexes) found in previous of sugars[10] and nitrogen bases studies.[11] Attempts addressed to minimize photofragmentation effects by changing laser ablation conditions resulted unfruitful. Hence, uridine can only be observed provided its rotational spectrum can be disentangled from those of other species present in the supersonic expansion.
Figure 1.
a) Broadband spectrum of uridine in the 6-12 GHz frequency region with some of the photofragmentation lines indicated. b) A section of the broadband spectrum showing a not resolved 1019-918 transition of uridine. c) The 1019-918 rotational transition of uridine showing its hyperfine structure completely resolved by LA-MB-FTMW spectrometer.
We tackled this complex problem by following a systematic approach involving several steps. In the first of these, the lines of the photofragmented species were identified and removed from the spectrum. The remaining unassigned lines were then considered and further investigated by performing further assays. Many of these lines were seen to present a not well resolved hyperfine structure arising from nuclear quadrupole coupling interactions such that they might be attributed to uridine (see Fig. 1b). Like uracil, uridine possesses two 14N nuclei (at N1 and N3 of scheme 1) with a nuclear quadrupole moment I = 1, which interacts with the electric field gradient created by the rest of the molecule at the nuclei. The 14N nuclear quadrupole coupling splits the rotational energy levels decreasing the overall intensity of each rotational transition and giving rise to a very complex hyperfine structure.[12] Lines were then classified in groups depending on whether or not they are present when laser ablation was turned off, their optimal microwave polarization power and the existence of nuclear quadrupole hyperfine structure. The microwave polarization power is correlated with the magnitude of the electric dipole moment components. Lines within each group were exhaustively tested in an attempt to establish linkages which would identify lines arising from the same carrier, uridine. In a final stage, this kind of spectral taxonomy approach allowed us to assign a total of 71 rotational transitions (see Table S1 of the Supporting Information) corresponding to a-, b- and c- type R-branch progressions with the quantum number J ranging from 4 to 17 of a rotameric species of uridine. A rigid rotor analysis conducted to a preliminary set of values for the rotational constants (see Table S2 of the Supporting Information). At this point we took advantage of the higher resolution of our traditional narrowband LA-MB-FTMW[13] spectrometer to fully resolve the nuclear quadrupole hyperfine structure, as shown in Fig 1c for the 101,9-91,8 rotational transition. 47 nuclear quadrupole hyperfine components (see Table S3 of the Supporting Information) belonging to 9 different rotational transitions were analyzed using a Watson’s A-reduced semirigid rotor Hamiltonian in the Ir-representation[14] supplemented with a term to account for the nuclear quadrupole coupling contribution.[12] The quadrupole coupling Hamiltonian was set up in the coupled basis set (I1I2IJF), I1 + I2 = I, I + J = F. The energy levels involved in each transition are thus labeled with the quantum numbers J, K-1, K+1, I, F. The rotational constants A, B, C and the diagonal elements of the nuclear quadrupole coupling tensor (χaa, χbb, and χcc) for the two 14N nuclei are accurately determined and summarized in the first column of Table 1. The simultaneous observation of uracil and uridine in the spectrum allowed us to optimize the experimental conditions to minimize photofragmentation. Despite this fact, new attempts failed when assigning lines attributable to other species.
Table 1.
Experimental rotational parameters for the observed species of uridine compared to those predicted ab initio[a] for the most stable conformer.
| Experimental | Anti/C2’-endo-g+[h] | |
|---|---|---|
| A[b] /MHz | 885.98961 (14)[g] | 901.2 |
| B /MHz | 335.59622 (35) | 340.6 |
| C /MHz | 270.11210 (20) | 276.6 |
| DJ/kHz | 0.0115 (10) | - |
| | μa |[c] /D | Observed | 2.1 |
| | μb | /D | Observed | 3.7 |
| | μc | /D | Observed | 0.9 |
| 14N(1) | ||
| χaa[d]/MHz | 1.540 (42) | 1.50 |
| χbb /MHz | 1.456 (72) | 1.43 |
| χcc /MHz | -2.996 (72) | -2.93 |
| 14N(3) | ||
| χaa /MHz | 1.719 (40) | 1.74 |
| χbb /MHz | 1.261 (70) | 1.11 |
| χcc /MHz | -2.979 (70) | -2.85 |
| σ[e]/kHz | 2.7 | - |
| N[f] | 47 | - |
Ab initio calculations (MP2-6-311++G(d,p)).
A, B, C are the rotational constants, and DJ the distortion constant. Conversion factor: 505379.1 MHz u Å2.
μa, μb and μc are the electric dipole moment components.
χaa, χbb, and χcc are elements of the 14N nuclear quadrupole coupling tensor.
rms deviation of the fit.
Number of transitions fitted.
Standard error in parentheses in units of the last digit.
Anti (90-270°) refers to the glycosyl torsion angle χ = <(O4’–C1’–N1–C2), which determines the orientation of the base with respect to the sugar. C2’-endo describes the sugar puckering, usually determined by the torsion angle δ = <(O3’–C3’–C4’–C5’) The symbols g+, g- and t describe the torsion angle γ = <(C3’–C4’–C5’–O5’) of about 60°, -60° or 180°, respectively, which determines de orientation of the O5’ atom with respect to the ribose ring.
The procedure for converting the spectroscopic uridine data into the corresponding conformational structure begins with the generation of a set of feasible conformers that may be possible in theory. Taking into consideration previous calculations,[15] a conformational search was carried out on all plausible configurations of uridine. Once a set of candidate structures were identified by force field and semi-empirical methods, we then employed higher-level MP2/6-311++G(d,p) calculations[16] to geometrically optimize the five different structures below 1000 cm-1 and to calculate the corresponding spectroscopic constants (see Table S4 of the Supporting Information). Identifying the observed species of uridine is based upon the quantitative match between the experimental rotational constants (see Table 1) and those ab initio calculated for the aforementioned conformers (see Table S4 and Figure S1 of Supporting Information). An initial comparison strongly indicates that the conformation of the uridine molecule corresponds to that of conformer Anti/C2’-endo-g+ (see second column in Table 1), predicted to be the global minimum, although experimental values are also consistent with those predicted for Syn/C2’-endo-g+, Syn/C3’-endo-g+ conformers.
A more straightforward way to distinguish unambiguously between these three plausible conformers is to take into account the information extracted from the nuclear quadrupole hyperfine structure of rotational transitions. The 14N nuclei introduce hyperfine rotational probes at defined sites of uracil and act as a reporter of the chemical environment of N1 and N3 quadrupolar nuclei. It is therefore a precious tool in conformational identification since the experimentally determined diagonal elements of the nuclear quadrupole coupling tensor (χaa, χbb, and χcc) for the 14N1 and 14N3 are sensitive to the magnitude and direction of the electric field gradient at the 14N nuclei, the latter relating directly to the relative orientation of the uracil and ribose rings. The experimental values are only consistent with those predicted for anti configurations, and are also in very good agreement with those of Anti/C2’-endo-g+ conformation, which is thus conclusively identified in our experiment. Additionally, the observation of a-, b- and c-type spectra and the corresponding intensities of the rotational transitions are in accordance with the predicted dipole moment components for this conformer.
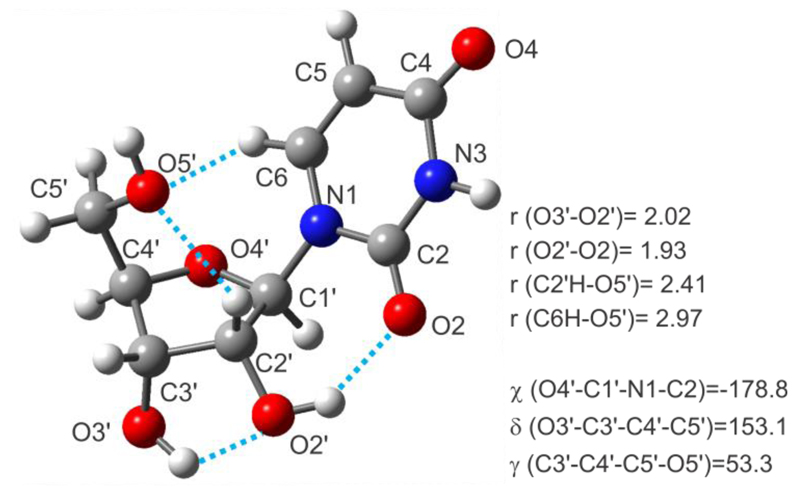
Computed rotational constants for Anti/C2’-endo-g+ conformation listed in the second column of Table 1 shows maximum deviations from experimental values of ca. 2%. Hence, the ab initio structure depicted in Figure 2 (cartesian coordinates in Table S5 of the Supporting Information) can be taken as a good description of the actual structure for the isolated uridine. This prevailing structure of uridine is stabilized by two cooperative hydrogen bonds O3’H···O2’H···O2, which form a five and a seven-membered ring. The counterclockwise arrangement of the hydroxyl groups at O3’ and O2’ favors the interaction with the O2 oxygen of uracil. Two additional C6H···O5’ and C2’H···O5’ weak hydrogen bonds seem to play an important role in the overall stabilization of this structure.[17] It is worth noting that the preference for a gauche configuration of the hydroxymethyl group of ribose allows the aforementioned weak interactions to be established.
Figure 2.
The observed Anti/C2’-endo-g+ conformer of uridine showing the intramolecular hydrogen bond distances (in Å) and values (in degrees) for the χ, δ, γ dihedral angles (see footnote in Table 1).
The preference for furanoses in RNA might be due to the observed intramolecular hydrogen bond networks which overstabilize this species. Furthermore, the existence of an exocyclic hydroxymethyl group (at C-5’) in the furanose form, not present in the pyranose form, allows some additional interactions with uracil, which would not occur in pyranosyl nucleosides, to be established.
Even though uridine size molecules may take current experimental techniques to their limits, we have demonstrated the ability of laser ablation combined with high resolution microwave spectroscopy to extract relevant structural information on large solid biomolecules such as uridine. As we move to larger molecules, smaller values of the rotational constants might become the major source of spectral congestion. For the moment, our goal is to explore the real capabilities of our current techniques in the study of naturally occurring systems. In any case, the problem of photofragmentation must be addressed from an experimental point of view.
Experimental Section
A commercial sample of uridine (m.p.: 165°C) was vaporized using the third (355 nm) harmonic of a 20 picosecond Nd:YAG laser (15mJ/pulse) and conducted by a flow of Ne (stagnation pressures of about 15 bar) to expand adiabatically into the vacuum chamber and be probed by either broadband CP-FTMW[9] or/and LA-MB-FTMW[13] spectroscopies.
Supplementary Material
Acknowledgments
** This research was supported by Ministerio de Ciencia e Innovación (Grants CTQ 2010-19008, CTQ 2013-40717-P and Consolider Ingenio 2010 CSD 2009-00038) and Junta de Castilla y León (Grant VA175U13). C.C. thanks the Junta de Castilla y León for the postdoctoral contract (grant number CIP13/01).
References
- [1].Pitsch S, Wendeborn S, Krishnamurthy R, Holzner A, Minton M, Bolli M, Miculca C, Windhab N, Micura R, Stanek M, Jaun B, et al. Helvetica Chimica Acta. 2003;86:4270. [Google Scholar]
- [2].Beier M, Reck F, Wagner T, Krishnamurthy R, Eschenmoser A. Science. 1999;283:699. doi: 10.1126/science.283.5402.699. [DOI] [PubMed] [Google Scholar]
- [3].Schermann JP. Spectroscopy and Modelling of Biomolecular Building Blocks. Elsevier; Amsterdam: 2008. [Google Scholar]
- [4].Alonso JL, Lozoya MA, Peña I, López JC, Cabezas C, Mata S, Blanco S. Chem Sci. 2014;5:515–522. [Google Scholar]
- [5].Vaquero V, Sanz ME, López JC, Alonso JL. J Phys Chem A. 2007;111:3443–3445. doi: 10.1021/jp071642c. [DOI] [PubMed] [Google Scholar]
- [6].López JC, Peña MI, Sanz ME, Alonso JL. J Chem Phys. 2007;126:191103A. doi: 10.1063/1.2735569. [DOI] [PubMed] [Google Scholar]
- [7].Cocinero EJ, Lesarri A, Écija P, Basterretxea FJ, Grabow J-U, Fernández JA, Castaño F. Angew Chem. 2012;124:3173. doi: 10.1002/anie.201107973. [DOI] [PubMed] [Google Scholar]
- [8].Peña I, Cocinero EJ, Cabezas C, Lesarri A, Mata S, Écija P, Daly AM, Cimas A, Bermúdez C, Basterretxea FJ, Blanco S, et al. Angew Chem Int Ed. 2013;52:11840–11845. doi: 10.1002/anie.201305589. [DOI] [PubMed] [Google Scholar]
- [9].Mata S, Peña I, Cabezas C, López JC, Alonso JL. J Mol Spectrosc. 2012;280:91–96. [Google Scholar]
- [10].Bermúdez C, Peña I, Cabezas C, Daly AM, Alonso JL. ChemPhysChem. 2013;14:893–895. doi: 10.1002/cphc.201300057. [DOI] [PubMed] [Google Scholar]
- [11].a) Alonso JL, Peña I, López JC, Vaquero V. Angew Chem Int Ed. 2009;48:6141–6143. doi: 10.1002/anie.200901462. [DOI] [PubMed] [Google Scholar]; b) Alonso JL, Vaquero V, Peña I, López JC, Mata S, Caminati W. Angew Chem. 2013;125:2387–2390. doi: 10.1002/anie.201207744. [DOI] [PubMed] [Google Scholar]
- [12].Gordy W, Cook RL. Microwave Molecular Spectra. 3rd. Wiley; New York: 1984. [Google Scholar]
- [13].Peña I, Sanz ME, López JC, Alonso JL. J Am Chem Soc. 2012;134:2305. doi: 10.1021/ja2101449. [DOI] [PubMed] [Google Scholar]
- [14].Watson JKG. In: Vibrational Spectra and Structure. Durig JR, editor. Vol. 6. Elsevier; New York: 1977. pp. 1–78. [Google Scholar]
- [15].a) Zhang L, Li H, Hu X, Jalbout AF. Chem Phys. 2007;337:110–118. [Google Scholar]; b) Leulliot N, Ghomi M, Salmani G, Berthier G. J Phys Chem A. 1999;103:8716–8724. [Google Scholar]
- [16].Gaussian 09, Revision A.1. Frisch MJ, et al. Gaussian Inc; Wallingford CT: 2009. [Google Scholar]
- [17].Hocquet Alexandre, Leulliot Nicolas, Ghomi Mahmoud. J Phys Chem B. 2000;104:4560–4568. and references therein. [Google Scholar]
Associated Data
This section collects any data citations, data availability statements, or supplementary materials included in this article.


