Abstract
Epithelial organs are made of a well-polarized monolayer of epithelial cells, and their morphology is maintained strictly for their proper functioning. The roles of lipids are not only to generate the membrane, but also to provide the specific domains for signal transduction, or to transmit signals as second messengers. By using a liquid chromatography-electrospray ionization mass spectrometry (LC-MS)/MS method, we here analyzed sphingolipids in MDCK cysts under various conditions. Our result showed that, compared to the three-dimensional cyst, the two-dimensional MDCK sheet is relatively enriched in sphingolipids. During cystogenesis, the contents of sphingomyelin (SM) and lactocylceramide (LacCer)—but, none those of ceramide, hexocylceramide, or GM3—are altered depending on their acyl chains. While the total SM is decreased more efficiently by SMS-1 knockdown than by SMS-2 knockdown, depletion of SMS-2, but not SMS-1, inhibits cyst growth. Finally upon the switching on of activated K-Ras expression which induces luminal cell filling, ceramide and LacCer are increased. Our parallel examinations of the microarray data for mRNA of sphingolipid metabolic enzymes failed to fully explain the remodelling of the sphingolipids of MDCK cysts. However, these results should be useful to investigate the cell-type- and structure-specific lipid metabolism.
Keywords: K-Ras, MDCK, mass spectrometry, organoid, sphingolipids
The plasma membrane is made up of a variety of lipids, primarily phospholipids and cholesterol (Chol). The phospholipids include of phosphatidylcholine (PC), phosphatidylethanolamine (PE), phosphatidylserine (PS), and phosphatidylinositol (PI) and phosphatidic acid (PA), all of which have glycerol as a backbone. In contrast, sphingomyelin (SM) is a unique phospholipid with a sphingosine backbone, which induces tight intermolecular associations between the amide linkage and the OH group. Based on the difference in biophysical and biochemical properties between SM and the other phospholipids, the concept of lipid rafts has been proposed: SM together with Chol forms a well-packed liquid-ordered domain, or lipid raft, in the plasma membrane, where signalling molecules are accumulated for efficient signal transduction from the extracellular stimuli (1). Therefore, it has been proposed that the SM contents of various cells may explain their cellular functions.
To measure the lipid molar ratio in various biological samples such as tissues and cells, isotopic labelling followed by lipid extraction and separation by chromatography have been utilized. However, great care is required to obtain lipids of all species due to their different biochemical properties. Recent progress in liquid chromatography-electrospray ionization mass spectrometry (LC-MS) has enabled the determination of sphingolipid molecular species (2). We also developed an approach for the comprehensive analysis of sphingolipids, glycerophospholipids and diacylglycerol (DAG) molecular species in a biological sample, without alkaline hydrolysis (3).
There are several enzymes involved in the synthesis and degradation of SM (4). Thus metabolic pathway of SM is complex. One of these enzymes, sphingomyelin synthase (SMS), is a critical regulator for the maintenance of SM content in mammals (5). Two SMS genes, SMS-1 and SMS-2, have been cloned and their cellular localizations have been characterized. SMS-1 is found in the trans-Golgi apparatus, whereas SMS-2 is predominantly found at the plasma membrane. Knockout mice of SMS-1 (SMS1-KO mice) exhibited moderate neonatal lethality, reduced body weight and loss of fat tissues mass, suggesting that they might have metabolic abnormalities (6). In support this idea, it has been reported that SMS1-KO mice exhibited loss of epididymal white adipose tissue (WAT) mass (7). In addition, SMS1-KO mice showed severe deficiencies in insulin secretion (6). In contrast, SMS2 KO mice display no obvious abnormalities, grow into adult hood and breed normally under a conventional diet and environment (8). However, it has also been reported that SMS-2 null mice exhibit an attenuated inflammatory response in macrophages (8) and reduced SM levels in plasma and liver (9). These results indicate that SMS-1 and SMS-2, the SMs at the Golgi-apparatus and the plasma membrane, respectively, make different contributions to the functioning of cells and organs.
MDCK (Madin-Darby Canine Kidney) cells, a cell line derived from renal tubes (10, 11), has been utilized as a model system of epithelial cells. MDCK cells show different morphology depending on their confluence: When cultured as an individual cell, MDCK cells show a fibroblastic shape with spontaneous migration (12). However, after culturing for several days to weeks, the confluent MDCK cells become cuboidal in shape with cell–cell adherence and apico-basal polarity. It has been reported that, in a 2-dimensional culture, epithelial morphogenesis was accompanied by a major shift from SM to glycosphingolipid, together with an increase in plasmalogen, PE and Chol content (13).
In cancer biology, a caveat has been raised that the environment in a culture dish is different from the internal environment, in which cells are surrounded by soft matrices and form steric structures (14). Therefore, three-dimensional cell culture in a gel has been developed to reconstitute the in vivo microenvironment, allowing investigation of the morphogenesis of multicellular tissue architecture (11). A single MDCK cell seeded in an extracellular matrix-rich gel grows to form a cyst that comprises a monolayer of polarized cells surrounding a fluid-filled lumen, which is similar to the epithelial structure in our body. The MDCK-cyst system has been used not only for studying epithelial cell biology, but also as an in vitro model system to reconstitute cancers. For example, K-Ras proteins operate as molecular switches in signal transduction pathways downstream of tyrosine kinases, and active mutations of these proteins have frequently been observed in cancer patients. Using a conditional expression system to rapidly switch on activated K-Ras in MDCK cysts, we previously found that activated K-Ras induced aberrant cyst morphology by filling the lumen with cells (15), resulting in a full lumen like that in hyperplasia or adenoma in vivo.
In this study, we examined the lipid contents of MDCK cells in various situations, including the two- and three-dimensional structures, and non-transformed and transformed in the three-dimensional structure. In addition to the lipid contents and their molecular species, we examined the expression patterns of metabolic enzymes for sphingolipids by microarray to provide a global understanding of enzymes and their products.
Experimental Procedures
Plasmids and establishment of cell lines
pSuper.retro.puro vector (Oligoengine, Seattle, WA) was used for short hairpin RNA (shRNA) as described previously (16). The shRNA sequences targeting SMS-1, SMS-2 and firefly luciferase were 5′- GAATGTGCAAGGAATCGTA -3′, 5′- GAATATTCACCTCGTCACT-3′ and 5′- GATTATGTCCGGTTATGTA-3′, respectively. The retroviral expression vectors pCX4puro-TIR1-9myc or pCX4neoDX-TIR1-9myc and pCX4bsr-3HA-AID-KRasV12 were generated in the previous study (15). Plasmids for Fucci, the lentiviral expression vector p2AFucci2_pCSII-CMV were provided by Dr. Atsushi Miyawaki, RIKEN. The apical and basolateral markers mCherry-GPI and GFP-Syntaxin4, respectively, were described previously (17).
Viruses were produced in BOSC23 cells that were transfected with the expression vectors, the envelope plasmid pCMV-VSV-G-Rsv-Rev (provided by Hiroyuki Miyoshi and Atsushi Miyawaki, RIKEN), and the packaging plasmid pGP (18) for retrovirus production, and HIVgp (provided by Hiroyuki Miyoshi and Atsushi Miyawaki, RIKEN) for lentivirus production. Virus-containing media was concentrated by RetroX or LentiX (Clontech, Mountain View, CA). After infection, cells were treated with corresponding antibiotics.
Cell culture and cystogenesis
MDCK cells were purchased from RIKEN BioResource Center (No. RCB0995), and maintained in minimal essential medium (MEM) containing Earle’s balanced salt solution (Invitrogen, Carlsbad, CA) supplemented with 10% fetal bovine serum (FBS; Equitech-Bio, Woburn, MA), 3% L-Gln, 0.1% non-essential amino acids, 1 mM sodium pyruvate, 100 units/ml penicillin and 100 µg/ml streptomycin, in a 5% CO2 humidified incubator at 37°C. For conditional degradation of AID-tagged proteins, the cells were treated with 50 µM synthetic auxin 1-naphthaleneacetic acid (NAA) in culture medium.
Cysts were generated as previously described (17, 19, 20) with modification. Briefly, 1.0 × 10⁴ MDCK cells were mixed with 80 µl of Matrigel (BD Biosciences, Bedford, MA), and placed on a glass coverslip (13 mm in diameter). After polymerization of Matrigel for 20 min at 37°C, cells were supplied with culture medium containing 2% Matrigel for the indicated periods. To collect cysts for lipid and microarray analysis, cysts cultured for indicated periods were incubated with 1.25 mM EDTA/PBS on ice for 1 hour to depolymerize the Matrigel, followed by washing three times with PBS.
Live cell imaging
Cells plated on 35 mm glass-bottom dishes (Asahi Techno Glass, Tokyo, Japan) were imaged on an LCV110 VivaView-Incubator-Fluorescence-Microscope (Olympus, Tokyo, Japan). Cells were maintained at 37°C with 5% CO2 for the duration of imaging (5–7 days). Each stage position was imaged every 20–60 min using a 40× DIC objective lens. GFP fluorescence was imaged using the NIBA filter, mCherry fluorescence was imaged using the WIG filter and the exposure time was 500 ms when the binning of the CCD camera was set to 2 µ 2. Images were processed using the MetaMorph software (Molecular Devices, Sunnyvale, CA).
Lipid analysis
To quantify the protein concentration, cells or cysts were lysed in 1× SDS sample buffer [62.5 mM Tris-HCl (pH6.8), 12% glycerol, 2% SDS, 0.004% BPB and 10% 2-mercaptoethanol]. After sonication, proteins were separated by SDS-PAGE on 5–20% Nagaiki precast gels (Oriental Instruments, Ltd., Tokyo, Japan), and transferred to PVDF membranes (Immobilon, Millipore). After blocking with Odyssey blocking buffer (LI-COR, Lincoln, NE) for 1 h, the membranes were blotted with anti-actin antibody (Cell Signaling Technology Japan, K.K, Tokyo, Japan) diluted 1:2,000 in a solution of Odyssey blocking buffer and Tris-buffered saline, followed by incubation with the secondary antibodies IRDye 800CW or IRDye 680 (LI-COR). The membranes were then scanned with an Odyssey IR scanner and analyzed with MetaMorph software.
Internal standard solutions were prepared as described previously (3), except that 50 pmol of LacCer (d18:1/12:0) and 5,000 pmol of cholesterol-d7 [Chol(D7)] were added to the original internal standard solution. For measurements of plasmalogen PE, an external standard solution containing 50 pmol each of PE (28:0) and PE (p18:0/18:1) was prepared. Pretreatment and measurement of the external standard solution was performed simultaneously with the samples, and the derived [peak area of PE (p18:0/18:1)/peak area of PE (28:0)] value was used as the corrective coefficient for the quantitation of plasmalogen PE. Lipid extractions were performed as described previously (3), with several modifications.
Cell pellets were sonicated for 10 s with 0.1 ml methanol/butanol (1:1) to inactivate the associated enzymes using an ultrasonic bath. After the addition of 0.05 ml standard lipid mixture, 0.05 ml of 0.5 M phosphate buffer (pH 6.0) and 0.2 ml of water, the samples were shaken with 0.7 ml of butanol and sonicated for 3 min in an ultrasonic bath. After centrifugation, the upper layer was collected. The original suspension was re-extracted by the addition of 0.35 ml each of ethyl acetate and hexane, followed by centrifugation. The resulting extract was combined with the first butanol extract. After the addition of 0.7 ml methanol, 10% (0.21 ml) of this solution was dried under reduced pressure at 40°C, and dissolved in 20 µl of liquid chromatography mobile phase B and 30 µl of mobile phase A. This sample was used to analyze Cer, SM, HexCer, LacCer, PE, PC and Chol levels. The remaining 90% (1.8 ml) of the extract was fractionated on a DEAE-cellulose column (500-µl bed volume packed in a 1 ml polypropylene pipet tip). After washing with 2 ml of methanol, the column-bound lipids were eluted with 1 ml methanol/28% aqueous ammonia/formic acid (1,000:33:22). The organic solvent was evaporated from the eluate under reduced pressure at 50°C, after which the dried materials were dissolved with 50 µl of mobile phase A. The resulting sample was used for the analyses of acidic lipids (i.e. S1P, Cer1P, GM3, PS, PG, PI and PA).
The Ultimate 3000 LC system (Thermo-Fisher Scientific, Waltham, MA) used in the study was controlled with Chromeleon software. The LC system was coupled on-line to a TSQ Vantage mass spectrometer (Thermo-Fisher Scientific) equipped with an electrospray ionization source. The MS system was controlled using the Xcalibur software. Lipids were measured using LC-MS/MS as described previously (3), except that the collision energy was set to 30 V for Cer, SM, HexCer, LacCer, PE and PC. The mass transitions were additionally set to 702.5/364.2, 724.5/364.2, 728.6/390.2, 730.6/392.2, 748.5/364.2, 750.5/390.2, 752.6/392.2, 774.5/390.2 and 776.6/392.2 for plasmalogen PE in the positive ion mode. Chol was measured using another set of LC-atmospheric pressure chemical ionization-MS/MS conditions. Briefly, the collision energy was set to 20 V, and the mass transitions were set to 369.3/147.1 for Chol and 376.3/147.1 for Chol (D7) in the positive ion mode. Each molecular species was identified based on the MS/MS spectrum and the LC retention times, and the quantities present were calculated from the peak areas of the measured lipids, compared with those of the internal standards. The protein concentrations in the residue after lipid extraction were determined using a BCA Protein Assay Kit (Thermo-Fisher Scientific). Each level of measured lipids was normalized to the protein content.
RNA extraction and quantitative real-time Polymerase Chain Reaction (RT-PCR)
Total RNA was purified with an RNeasy Micro Kit (QIAGEN, Hilden, Germany) and was reverse-transcribed using a ReverTra Ace qPCR RT Master Mix (Toyobo, Japan) according to the manufacturer’s protocol. The mRNA expressions of SMS1, SMS2 and GAPDH mRNAs were analyzed by using SYBR Green Realtime PCR Master Mix (Toyobo, Japan) with a DNA Engine Opticon 2 system (MJ Research, Waltham, MA). The primers used for quantitative RT-PCR were summarized in Supplementary dataset S1.
Microarray analysis
For Affymetrix microarray, labelled cRNA were synthesized from sample RNA using a MessageAmp II-Biotin Enhanced Kit (Ambion). Target hybridizations were performed on a CanGene-1_0-st GeneChip (Affymetrix, High Wycombe, UK) according to the manufacturer’s protocol. The hybridized cRNA were washed and stained in a GeneChip Fluidics Station 450, and signals were detected using a GeneChip Scanner 3000 (Affymetrix). Digitalized image data were processed using the GeneChip Operating Software (GCOS). For Agilent microarray, Cy3-labeled cRNA was synthesized using a Low Input Quick Amp Labeling Kit (Agilent Technologies, Santa Clara, CA). Labeled cRNA were hybridized to a Canine (V2) Gene Expression Microarray (Agilent Technologies) according to the manufacturer’s protocol. Arrays were scanned with a G2565BA Microarray Scanner (Agilent Technologies). Fold increases in the signal intensities of selected genes were calculated by using GeneSpring GX software (Agilent Technologies).
Results
Sphingolipid metabolic pathway of MDCK cells in two and three dimensions
Although there has been a series of papers on the lipid contents in those in two-dimensional MDCK cell sheet, there have been no analyses of lipids in MDCK cysts. Therefore, this study was the first to compare the lipid molar ratio of MDCK cells grown on a plastic dish and those grown in Matrigel. MDCK cells grown under both conditions were cultured for 10 days to induce polarization, and lipids were extracted and analyzed as described in the Experimental Procedures. As shown in Fig. 1A, the percentages of some lipids were different between MDCK cells grown under the two- and three-dimensional conditions. Ceramide (Cer) and phosphatidic acid (PA) were slightly, but significantly, decreased in the three-dimensional cyst. The amounts of the major glycolipids, that is monohexosylceramide (HexCer) and GM3, were approximately two-fold fewer in the three-dimensional cyst, compared to the two-dimensional sheet (the right graph). When molecular species of lipids were examined, SM and Cer with 18:1/22:1, 18:1/22:0, 18:1/24:1, 18:1/24:0 were significantly decreased in the three-dimensional cyst. Similar changes were observed in glycolipids such as HexCer, LacCer and GM3. These results suggest that the stiffness of the matrix regulates different pathways for species-specific lipid metabolism, and that such change in species may contribute to the morphology of the cell grown in the two- and three-dimensional environment.
Fig. 1.
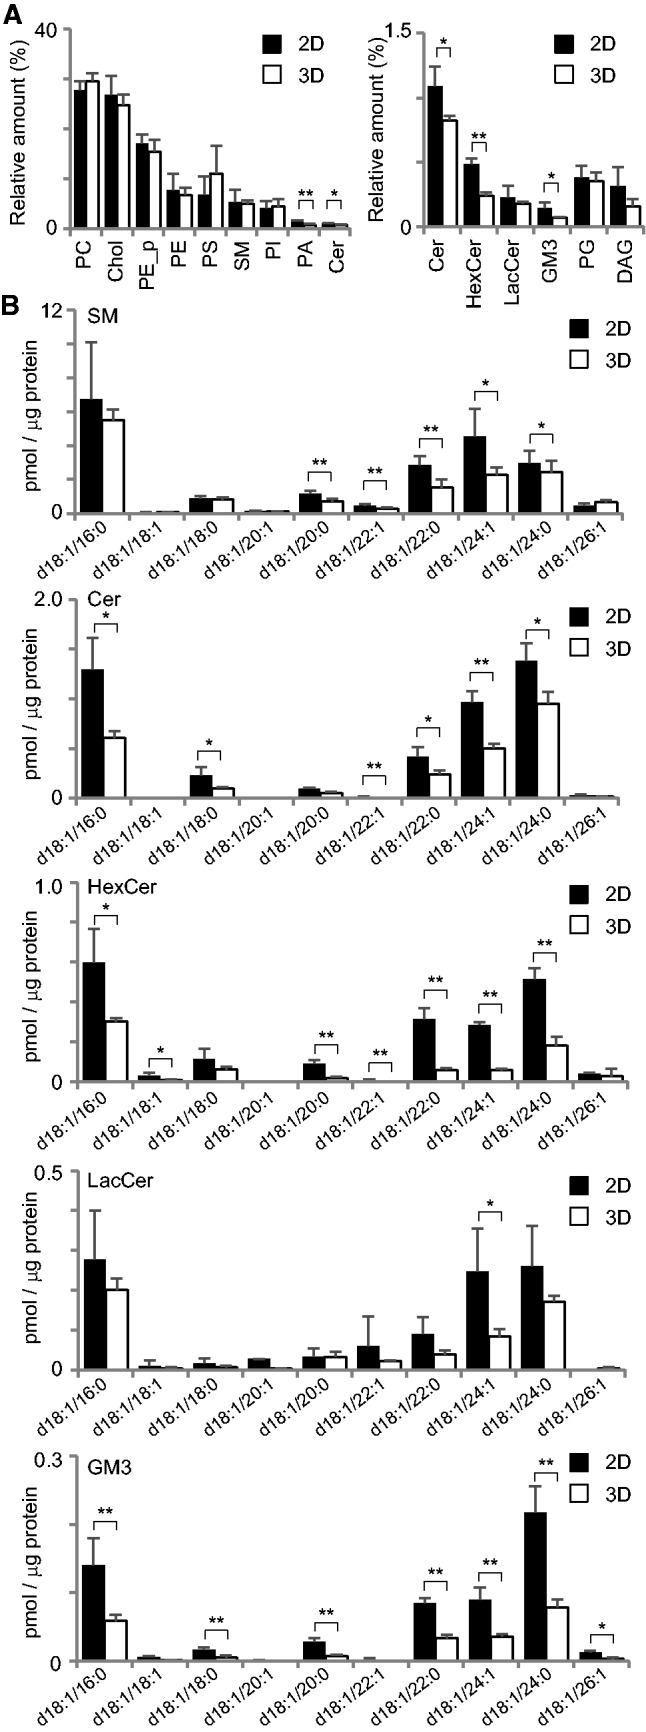
Lipidome of MDCK cells in the two- and three-dimensional culture. (A) Lipid class compositions of MDCK cells that were cultured in two-dimensional sheet and three-dimensional cyst. The content of individual lipid classes was determined by summing up absolute abundances of all identified species and is expressed as the mol%. Lipid classes: phosphatidylcholine (PC), cholesterol (Chol), ethanolamine plasmalogen (PE_p), phosphatidylethanolamine (PE), phosphatidylserine (PS), sphingomyelin (SM), phosphatidylinositol (PI), phosphatidic acid (PA), ceramide (Cer), phosphatidylglycerol (PG), hexocylceramide (HexCer), lactocylceramide (LacCer) and diacylglycerol (DAG). (B) The contents of sphingolipids species in two- and three-dimensional cultured MDCK cells. LC-MS/MS was utilized to quantify sphingolipids levels from MDCK cysts. Sphingolipids with a d18:1 backbone with fatty acids from 16 to 26 carbons were assessed. Molecular species of sphingolipids were quantified from the lysate of MDCK cysts. The values represent the mean of five experiments, and error bars indicate the standard deviation. *P < 0.05 and **P < 0.01. ND, not detected. The raw data are shown as Supplementary dataset S2.
Sphingolipid metabolic pathway of MDCK cells in the early and late stages of cystogenesis
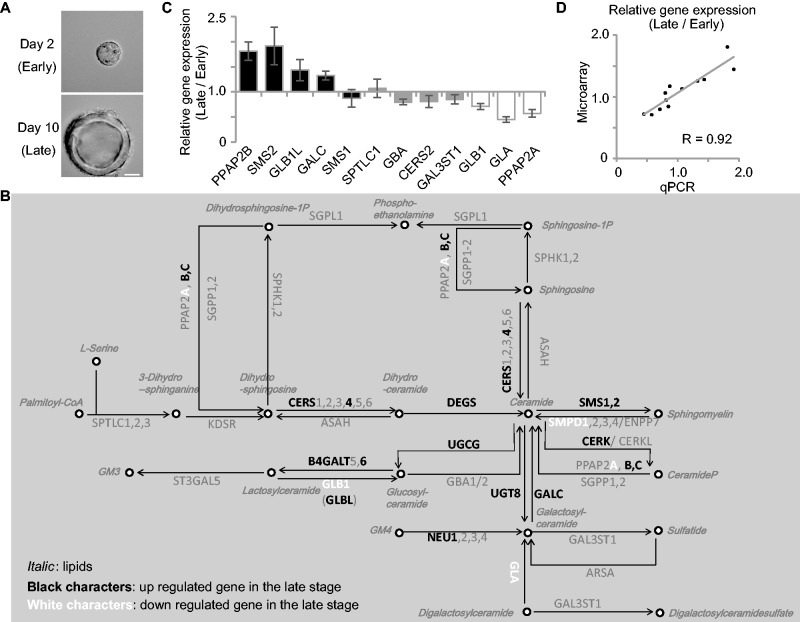
We next examined the sphingolipid metabolic pathways during cystogenesis by microarray analysis. As shown in Fig. 2A, at 2 days (upper panel) and 10 days (lower panel) after embedding in Matrigel, mRNAs were extracted from MDCK cells and their expression levels were examined by microarray. Figure 2B shows the metabolic pathways of sphingolipids. In this map, the lipids are expressed in italics and genes regulating lipid conversion were shown in block (the raw data are summarized as Supplementary dataset S3). Among them, the genes up- and downregulated more than 1.3-fold in the late stages compared to the early stages are shown in white and black, respectively. It is noteworthy that we found upregulation of several genes involved in the producing Cer, such as CERS4, DEGS and GALC. We also observed upregulation of SMS-1 and -2, and CERK, UGCG and UTG8, which convert Cer to produce SM, phosphorylated ceramide, GluCer and GalCer, respectively. To certify the accuracy of the microarray data, we performed quantitative RT-PCR analysis of 12 genes, including PPAP2B, SMS2, GLB1L, SMS1, SPTLC1, GBA, CERS2, GAL3ST1, GLB1, GLA and PPAP2A. As shown in Fig. 2C, the amount of mRNA detected by RT-PCR showed similar increase/decrease patterns those detected by the microarray. The relative expression of these 12 genes measured by RT-PCR and microarray were showed parallel correlation (Fig. 2D). These data suggest that during the cystogenesis, the levels of Cer, SM and glycolipids are increased. To confirm this, the lipid contents were analyzed by LC-MS/MS. As shown in Fig. 3A, SM and Cer were increased in the cysts at the late stages. Since both Cer and SM generate liquid-ordered domain with Chol (21), the results of the Cer and SM enrichment in the mature cysts suggested that lipid rafts were increased during the cystogenesis. In addition, we examined the molecular species of the sphingolipids (Fig. 3B). Focusing on the major sphingolipids with d18:1/16:0, SM, HexCer and GM3 were decreased in the late stages, while LacCer was increased. This increase of LacCer with d18:1/16:0 may have been due to an increase of B4GALT6, which converts GlcCer to LacCer (Fig. 2B). When the sphingolipids with 18:1/22:0 and 18:1/24:1 were compared, SM, Cer and LacCer were increased, while HexCer and GM3 were decreased. Since the gene expression data indicate the up-regulation both of SMS-1 and SMS-2 (Fig. 2B), these enzymes might convert Cer with 18:1/22:0 and d18:1/24:0, but not Cer with 18:1/16:0, to SM during cyst maturation. Interestingly, glycolipids, such as GM3 and HexCer were all decreased in the cysts in the late stages, while LacCer, with 18:1/24:0 was increased. As mentioned above, B4GALT6 might be responsible for LacCer upregulation during cyst maturation.
Fig. 2.
Sphingolipid metabolic pathway of MDCK cells in the early and late stages of cystogenesis. (A) DIC images of the MDCK cells 3D-cultured in Matrigel for 2 and 10 days. The scale bar represents 20 μm. (B) Results of the microarray analysis of sphingolipid metabolic pathway-related genes. The KEGG metabolic pathway ‘Sphingolipid metabolism’ (map00600) was labelled for the relative expression level (late stage cyst/early stage cyst). The genes listed in black and white characters indicate up- and down-regulated genes in the late stage cyst, with a 1.3-fold threshold. The numbers in the metabolic map were obtained from the average of three experiments. The raw data are shown as Supplementary dataset S3. (C) The relative expression of genes indicated below was quantified by RT-PCR. The values represent the mean of triplicate determinations, and error bars indicate the standard deviation. (D) The values of relative expression of 12 genes detected in RT-PCR (denoted as qPCR, X-axis) and those in the microarray (Affymetrix, Y-axis) were plotted. The approximate line is shown with correlation coefficient (R = 0.92).
Fig. 3.
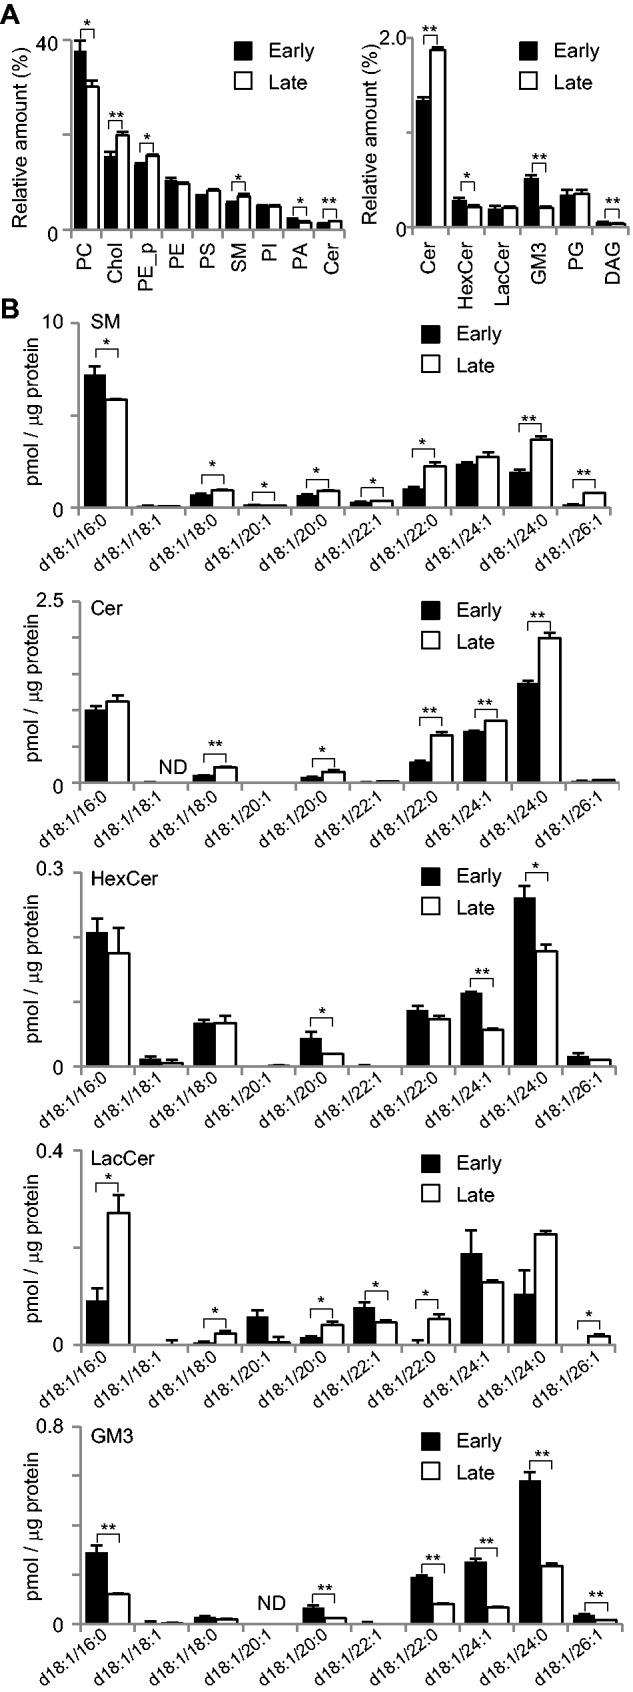
Lipidome of the early and late stages of MDCK cystogenesis. (A) MDCK cells were cultured in Matrigel for 2 days as early stage or 10 days as late stage. The cysts were subjected to LC-MS/MS for quantitative comparison of individual lipid classes. The MDCK cysts in the early and late stage were subjected to LC-MS/MS for quantitative comparison of individual lipid classes. The contents of individual lipid classes were determined by summing up the absolute abundances of all identified species and are expressed as the mol%. Cysts in the early stage are indicated with filled bars and cysts in the late stage with open bars. Abbreviations are the same as in Fig. 1. (B) The contents of sphingolipid species in MDCK cells cultured for 2 and 10 days. LC-MS/MS was utilized to quantify sphingolipids levels from MDCK cysts. Sphingolipids with a d18:1 backbone with fatty acids from 16 to 26 carbons were assessed. Molecular species of sphingolipids were quantified from the lysate of MDCK cysts. The values represent the mean of triplicate determinations, and error bars indicate the standard deviation. *P < 0.05 and **P < 0.01. ND, not detected.
SMS2, but not SMS1 knockdown reduced cyst growth
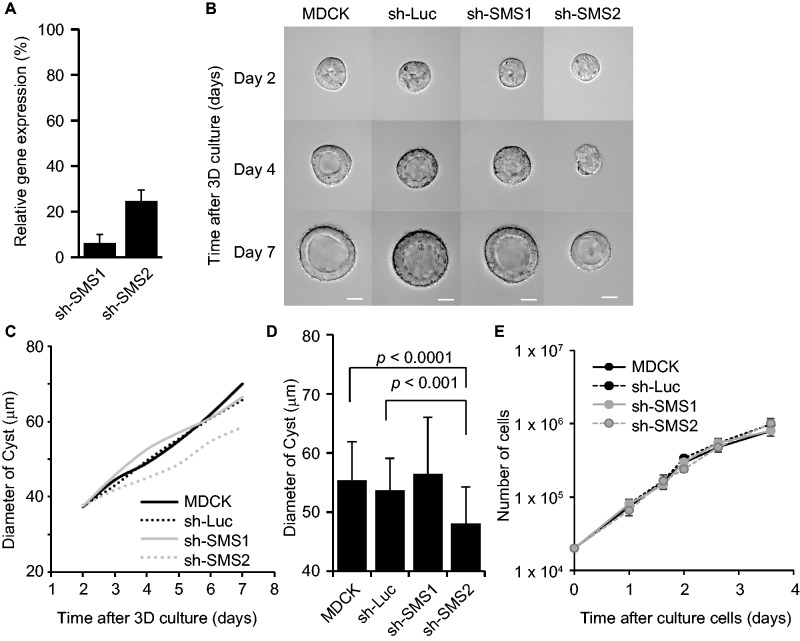
The data above indicate that SM produced by SMS-1 and -2 contributes to cystogenesis. To know the function of SMS-1 and SMS-2, which is upregulated during cystogenesis, we generated shRNA constructs to knockdown the SMS-1 and -2. The MDCK cells expressing the shRNAs against SMS-1 and SMS-2 showed reductions in gene expression of 6% and 25%, respectively, compared to the control shRNA against firefly luciferase (Fig. 4A). These shRNA-expressing MDCK cells were embedded in Matrigel and observed with a microscope equipped with a CO2 incubator. As shown in Fig. 4B, MDCK cells with shSMS-2 showed retarded growth. Quantification of the diameter of these cysts supported the conclusion the knockdown of SMS-2 reduced the size of the cysts, compared to those formed by the parental MDCK cells, or MDCK-shLuc cells. In contrast, MDCK-shSMS1 cysts grew in a manner similar to parental MDCK and MDCK-shLuc cysts. At the 5th day, the diameters of the cysts of MDCK-shSMS-2 cysts were significantly smaller than the diameters of cysts of the parental MDCK and MDCK-shLuc cells (Fig. 4D). Interestingly, in the two-dimensional sheet, SMS-2 knock down had no effect to cell growth (Fig. 4E). MDCK cysts expressing the cell-cycle marker Fucci showed relative cell cycle progression at the 6th day upon SMS-2 knockdown (Supplementary Fig. S4), suggesting that effect of SMS-2-knockdown may be overcome by other growth signalling pathways. The expression of polarity markers in the MDCK cysts revealed that the apico-basal polarity was maintained in SMS-2- knockdown cysts (Supplementary Fig. S5).
Fig. 4.
Effect of sphingomyelin synthase knockdown for the MDCK Cyst growth. (A) MDCK cells were transfected with pSuper-cSMS1, cSMS2 or luciferase, a shRNA vector, and selected by puromycin. The knockdown efficiency was confirmed by quantitative real-time PCR. The values represent the mean of triplicate determinations, and error bars indicate the standard deviation. (B) Time-lapse imaging of SMS-deficient MDCK cells in Matrigel was performed as described above. The scale bars represent 20 μm. (C) The analysis of cyst growth for SMS knockdown MDCK cells. The diameter of each cyst in (B) was measured by Metamorph software. The averaged time courses are shown. Results are shown for parental cells (MDCK: n = 32), control cells (sh-Luc: n = 32), SMS1-deficient cells (sh-SMS1: n = 39) and SMS2-deficient cells (sh-SMS2: n = 39). (D) The results of the measurement of cysts on day 5 (from C) are shown. Error bars indicate the standard deviation and P-values were calculated using the t-test. (E) The analysis of cell growth in the two-dimensional sheet for SMS knockdown MDCK cells. Various cells were seeded onto plastic dish and the cell numbers were counted at the indicated periods.
To confirm the SM decrease in these SMSs knockdown MDCK cells, lipids in various MDCK cysts at day10 were analyzed by LC/MS-MS. As shown in Fig. 5A, the relative amount of SM was decreased in MDCK-shSMS-1, but not in MDCK-shSMS-2 cysts. The analysis of molecular species of SM indicated that SM with d18:1/16:0 was decreased significantly in the MDCK-shSMS-1 cyst, and slightly in the MDCK-shSMS-2 cyst. A similar trend was observed in other molecular species such as SM with d18:1/20:0, d18:1/24:0 and d18:1/26:1, suggesting that there were no differences in substrate specificities between SMS-1 and -2, and that SM produced by SMS-2 is necessary for cyst growth.
Fig. 5.
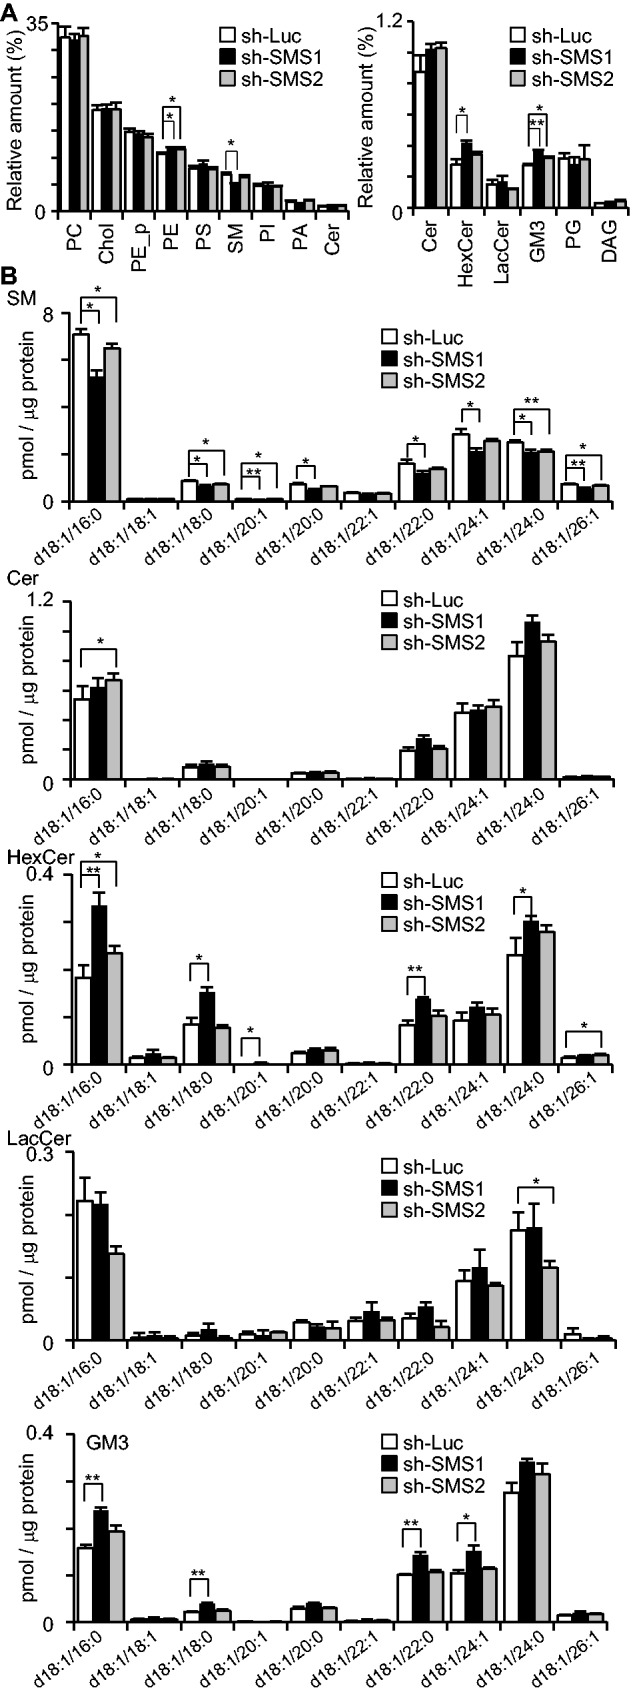
Lipidome of sphingomyelin synthase-knockdown MDCK cysts. (A) MDCK cells were infected with virus containing shRNA against cSMS1, cSMS2 or luciferase (Luc) and selected by puromycin. These cells were cultured on Matrigel for 7 days and were subjected to LC-MS/MS for quantitative comparison of individual lipid classes. The contents of individual lipid classes were determined by summing up the absolute abundances of all identified species and are expressed as the mol%. sh-Luc MDCK cells are indicated with open bars, sh-SMS1 MDCK cells with black bars, and sh-SMS2 cells with gray bars. Abbreviations are the same as in Fig. 1. (B) The contents of sphingolipids species in sphingomyelin synthase-knockdown MDCK cysts. LC-MS/MS was utilized to quantify the sphingolipids levels from MDCK cysts. Sphingolipids with a d18:1 backbone with fatty acids from 16 to 26 carbons were assessed. Molecular species of sphingolipids were quantified from the lysate of MDCK cysts. The values represent the mean of triplicate determinations, and error bars indicate the standard deviation. *P < 0.05 and **P < 0.01.
Sphingolipid metabolic pathway of MDCK cells upon the active K-Ras expression
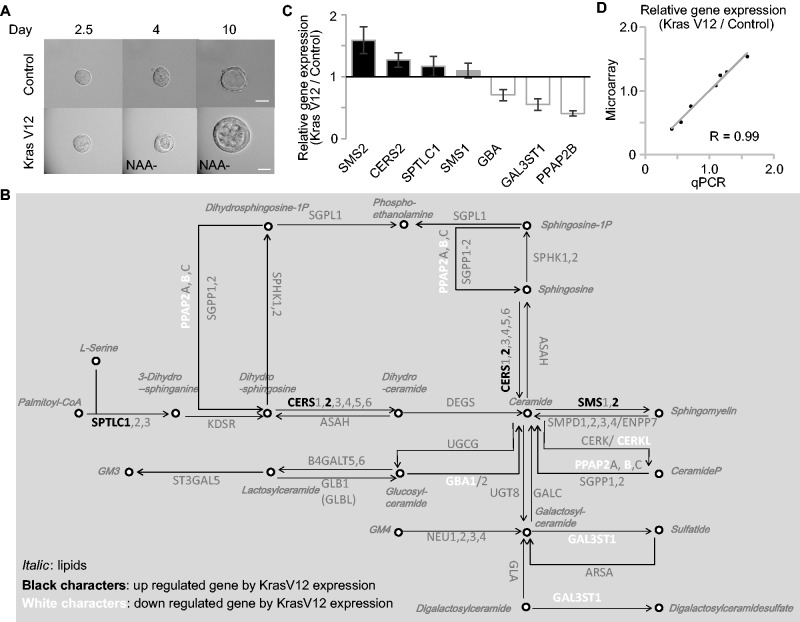
Finally, the lipid metabolism upon transformation was analyzed. K-Ras is one of the major oncogenes, of which mutations were observed in various cancers, such as pancreas, colon and lung cancers. To reconstitute the cancer in vitro, we previously established an auxin inducible degron (AID) system to express a constitutively active form of K-Ras protein in the mature MDCK cysts (22). In the presence of 1-naphthaleneacetic acid (NAA), a synthetic auxin, TIR1 plant F-box protein binds to the AID protein, leading to poly-ubiquitination of AID proteins and thereby degradation of the AID protein by the proteasome (15). MDCK cells expressing TIR1 and AID-KRasV12 were cultured in Matrigel to form cysts, and AID-KRasV12 was expressed by 1-NAA deprivation. To understand the initial effect of K-Ras V12, MDCK-KRasV12 cells were first cultured in the Matrigel with NAA for five days to form cysts, then further cultured with or without NAA in the Matrigel for an additional one day. As shown in Fig. 6A, we confirmed that cells filled the lumen of the K-RasV12-expressing MDCK cysts, but not the lumen of the MDCK cysts with NAA. mRNAs were extracted from the MDCK cysts with or without KRasV12, and subjected to RT-PCR and microarray analysis. Figure 6B indicates the changes in the expression of various enzymes. SPTLC1, CERS2 and SMS-2 were upregulated by the active K-Ras expression. Quantitative RT-PCR analysis of the SPTLC1, CERS2 and SMS-2 genes reproduced the microarray data (Fig. 6C). We also compared the relative expression of 7 genes in RT-PCR to find that gene expression detected in RT-PCR and microarray showed parallel correlation (Fig. 6D). Lipids were extracted and examined to find Chol and PE_p was slightly increased upon the active K-Ras expression (Fig. 7A). Analysis of the molecular species of sphingolipids suggested that Cer with d18:1/24:0 as the major Cer was increased by the active K-Ras expression in the mature cysts (Fig. 7B). GM3 and LacCer with d18:1/24:0 were also increased. Although the mRNA of SMS-2 was upregulated (Fig. 6C), we observed a slight, but not significant, increase of SM with d18:1/16:0 and d18:1/22:0.
Fig. 6.
Sphingolipid metabolic pathways of MDCK cells upon the active K-Ras expression. (A) MDCK-KrasV12 cells, which expressed the TIR1 and AID-KRasV12 gene, were cultured on Matrigel with 50 µM NAA for 4 days and further cultured with or without NAA for 6 days. K-RasV12 proteins were induced by NAA depletion from culture media. Cysts in Matrigel were imaged by time-lapse incubator microscopy for 7–8 days. The scale bars represent 20 μm. (B) Results of microarray analysis of Sphingolipid metabolic pathway-related genes. The KEGG metabolic pathway ‘Sphingolipid metabolism’ (map00600) was labeled for the relative gene expression level (KrasV12 induced MDCK cyst/control MDCK cyst). The genes listed in black and white characters indicate up- and down-regulated genes in the KrasV12-induced MDCK cyst. The microarray data are presented with a 1.3-fold threshold. See also Supplementary Dataset S2. (C) MDCK-KrasV12 cells were cultured on Matrigel with 50 µM NAA for 5 days and further cultured with or without NAA for 1 day. The relative expression of seven genes indicated below were quantified by RT-PCR. The values represent the mean of triplicate determinations, and error bars indicate the standard deviation. (D) The values of relative expression of 7 genes detected in RT-PCR (denoted as qPCR, X-axis) and those in the microarray (Affymetrix, Y-axis) were plotted. The approximate line is shown with correlation coefficient (R = 0.99).
Fig. 7.
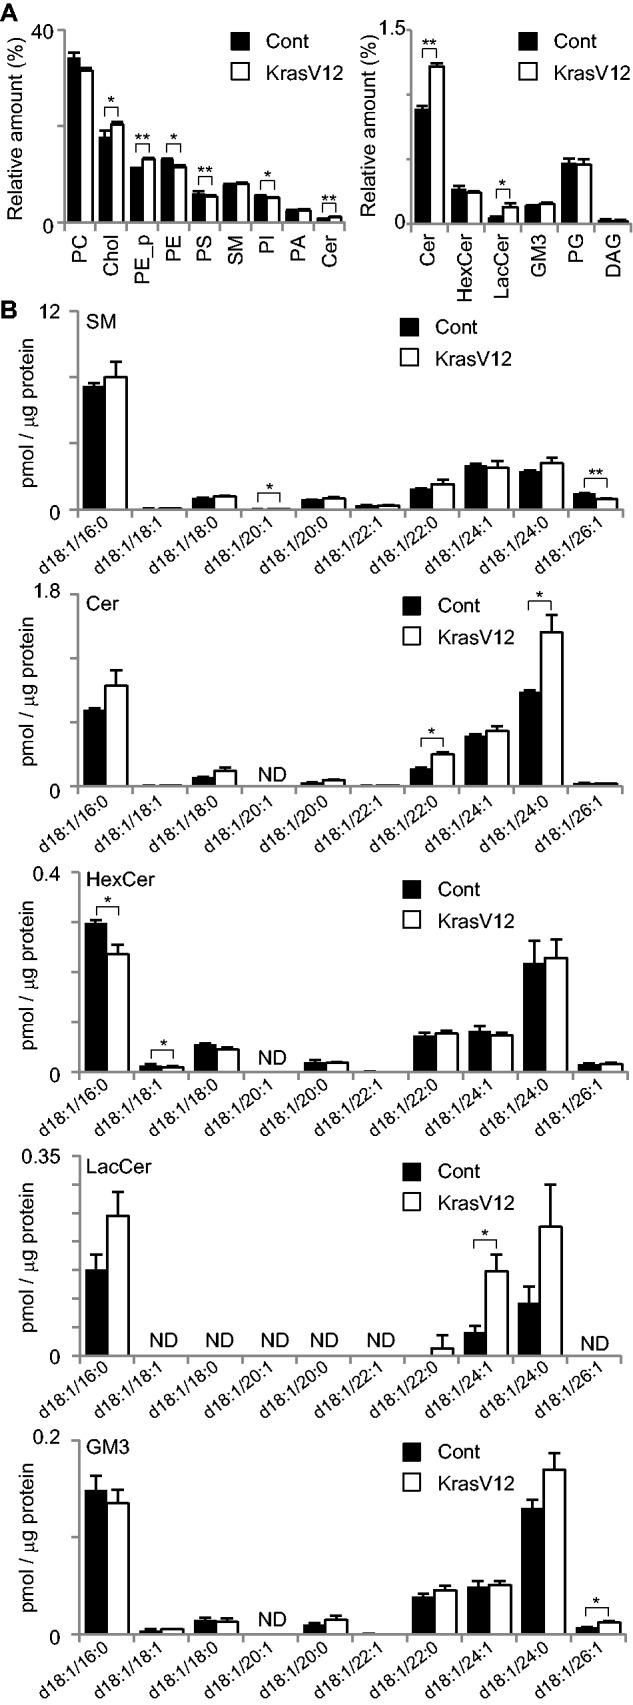
Lipidome of MDCK cells upon the active K-Ras expression. (A) MDCK-KrasV12 cells were cultured on Matrigel with 50 µM NAA for 5 days and further cultured with or without NAA for 1 days. MDCK-KrasV12 cysts were subjected to LC-MS/MS for quantitative comparison of individual lipid classes. The content of individual lipid classes was determined by summing up the absolute abundances of all identified species and is expressed as the mol%. MDCK-KrasV12 cells suppressed K-RasV12 expression by NAA as control (filled bars) and K-RasV12 induced MDCK-KrasV12 cells (open bars). Abbreviations are the same as in Fig. 1. (B) The contents of sphingolipids speciess in MDCK-KrasV12 cysts. LC-MS/MS was utilized to quantify sphingolipid levels from MDCK cysts. Sphingolipids with a d18:1 backbone with fatty acids from 16 to 26 carbons were assessed. The molecular species of sphingolipids were quantified from the lysate of MDCK-KrasV12 cysts. The values represent the mean of triplicate determinations, and error bars indicate the standard deviation. *P < 0.05 and **P < 0.01.
Discussion
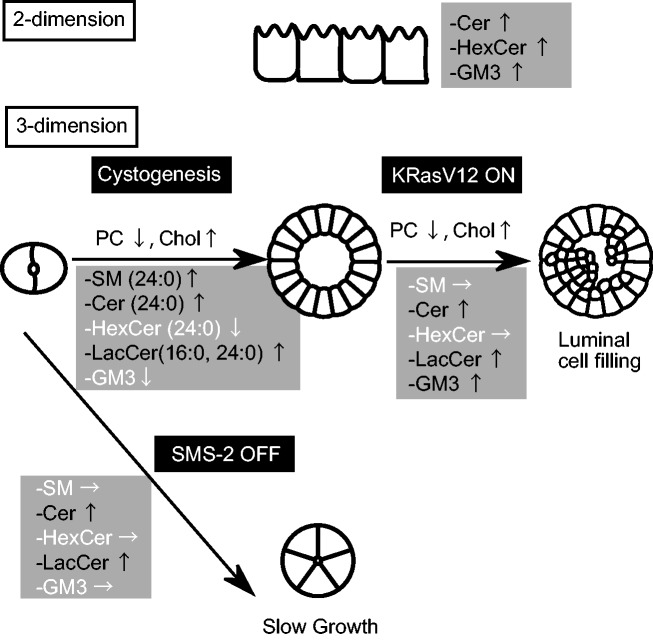
In this study, we analyzed the contents of various lipids and the mRNA expressions of various genes regulating sphingolipid metabolism in order to understand how sphingolipid metabolism is remodelled in response to different biological and pathological conditions in cysts (Fig. 8).
Fig. 8.
Schematic summary of sphingolipid metabolism in this study.
In the comparison between two- and three-dimensional epithelial structures, we found that sphingolipids were relatively enriched in the two-dimensional sheet (Fig. 1). This augmentation was global; that is, most of the molecular species of SM, Cer and glycolipids showed the same trend of higher concentration in the 2-dimensional sheet. In striking contrast, during cystogenesis the SM and LacCer contents showed molecular species-specific changes, while Cer, HexCer and GM3 did not (Fig. 3B). It has been reported that the elastic modules of polystyrene substrates used for monolayer culture are 2.78 × 10⁹ Pa, while those of the reconstituted basement membrane are 175 Pa in average (14). Considering that MDCK cells secrete laminin to their basal side in three-dimensional culture (23), it is plausible that the secretion of such a matrix, or cytokines and growth factors, may contribute to the expression of metabolic genes for these lipids during the cystogenesis. Such changes in the microenvironment may induce genes with specific substrate specificity. In fact we found that some genes were increased during cystogenesis (Fig. 2B), but this result did not fully explain the lipid metabolism. For example, although we found that it was increased in the late stages, the substrate specificity of ceramide synthase (CerS) 4 remained unknown. Since CerS2 and CerS5 use long acyl chain CoAs, whereas CerS2 and CerS3 are involved in the synthesis of very long acyl chain sphingolipids (24), a biochemical analysis will be needed to identify the genes responsible for lipid metabolism. Other possibilities are that the substrate specificities of enzymes are altered upon matrix or growth factor stimulation, or that the localization and structural changes of lipids are altered during cystogenesis.
The result that SMS-2, but not SMS-1, knockdown, inhibited organoid growth suggests that SM in the plasma membrane has specific roles (Fig. 4). The drawback of mass spectrometry, including when using the present method, is that it cannot detect the localization of the lipids. Lipid-specific probes are useful to detect lipids in the cells, but at this time, we only have a limited number of probes. Cholera toxin subunit B has been widely utilized to detect the GM1 on the plasma membrane. In a similar manner, Lysenin, a pore-forming toxin derived from coelomic fluid of the earthworm Eisenia foetida, has been utilized as a probe for a cluster of SM (25). Using this toxin, it has been shown that clustered SM is enriched in the basolateral membrane of MDCK II cells (26), and in the apical membranes of mouse mammary gland cells (27). Although the toxin was modified for live imaging of the lipid distribution in living cells (28), a method for applying Lysenin to cysts has not been established. We tried to express non-toxic Lysenin in the cells with or without membrane-localization signals and found that sequestering of SM to the probe at the Golgi apparatus leads to cell death (unpublished data). Further development of the lipid-specific probes or advances in tools such as imaging mass spectrometry will lead to fuller clarification of the localization of specific lipids in the three-dimensional structure.
Since SMS-2 is required for cyst growth (Fig. 6), and SMS-2 mRNA was upregulated upon active K-Ras expression, we expected that the SM produced by SMS-2 would play an important role for the luminal cell filling induced by the active K-Ras expression. However, SM was not increased upon the active K-Ras expression (Fig. 7), and knockdown of SMS-2 in the active K-RasV12-expressing cysts did not inhibit the luminal cell filling (Supplementary Fig. S6), denying this possibility. Instead, slight increases in Cer and LacCer were observed (Fig. 7). How these lipids participate in the luminal cell filling remains to be solved. A series of reports has suggested that Cer and LacCer play divergent roles in cell growth, depending on the cell- or tissue-context. For example, Cer produced by sphingosine kinase-1 is required for MDCK cell growth (29). LacCer induced ROS generation and activation of ERK1/2 in cardiomyocytes (30), Ras activation in human aortic smooth muscle cells (31), and PLA2a activation via direct binding (32). We speculate that various lipids and several signaling pathways are involved in the active K-Ras-induced phenotypes. Although Raf is located downstream of Ras, the Raf-mutated cancers show a more aggressive phenotype than those with Ras mutation (33). In previous study, Chol was decreased upon the activation of Raf in MDCK cells cultured in a two-dimensional sheet, while PC, PE, DAG and SM were increased (13). Even though the methods of culturing and lipid analysis differed between this previous system and our present one, such a difference in lipid contents could play a role in the aggressiveness of cancers both in vitro and in vivo.
In summary, we here tried to elucidate the mechanisms underlying sphingolipid metabolism using both mass spectrometry and microarray analysis, since both data on the lipid concentrations and protein expression/activity are required to generate a metabolic map in silico (12). Although changes in mRNA expression cannot fully account for the changes in lipid contents observed in response to various biological events, we believe that these data will provide a platform for further studies to predict epithelial cell fate under various conditions.
Supplementary Data
Supplementary Data are available at JB Online.
Funding
This work was supported by Program for the Strategic Research Foundation at Private Universities (Lipid World for Clinical Application) from the Ministry of Education, Culture, Sports, Science and Technology of Japan, and by a Grant-in-Aid for Scientific Research on Innovative Areas from the Japan Society for the Promotion of Science (JSPS).
Conflict of Interest
None declared.
Glossary
Abbreviations
- AID
auxin inducible degron
- Cer
ceramide
- Chol
cholesterol
- DAG
diacylglycerol
- Fucci
fluorescent ubiquitination-based cell cycle indicator
- GFP
green fluorescent protein
- GM1
Galβ1,3GalNAcβ1,4(Neu5Acα2,3)Galβ1,4Glcβ1,1′-ceramide
- GM3
NeuAcα2-3Galβl-4Glcβl-1 ceramide
- GPI
glycosylphosphatidylinositol
- HexCer
hexocylceramide
- HIV
human immunodeficiency virus
- LacCer
lactocylceramide (LacCer, Galβ1-4Glcβl-l ceramide)
- LC-MS
liquid chromatography-electrospray ionization mass spectrometry
- Luc
luciferase
- MDCK
Madin–Darby Canine Kidney
- NAA
1-naphthaleneacetic acid
- PA
phosphatidic acid
- PBS
phosphate-buffered saline
- PC
phosphatidylcholine
- PE
phosphatidylethanolamine
- PE_p
ethanolamine plasmalogen PG, phosphatidylglycerol
- PI
phosphatidylinositol
- PS
phosphatidylserine
- SM
sphingomyelin
- SMS
sphingomyelin synthase
- VSV
vesicular stomatitis virus
References
- 1.Simons K., Sampaio J. L. (2011) Membrane organization and lipid rafts. Cold Spring Harb. Perspect. Biol. , 3, a004697. [DOI] [PMC free article] [PubMed] [Google Scholar]
- 2.Momin A.A., Park H.F., Portz B.J., Haynes C.A., Shaner R.L., Kelly S.L, Jordan I.K, Merrill A.H., Jr. (2011) A method for visualization of “omic” datasets for sphingolipid metabolism to predict potentially interesting differences. J. Lipid Res. 52, 1073–1083 [DOI] [PMC free article] [PubMed] [Google Scholar]
- 3.Ogiso H., Taniguchi M., Araya S., Aoki S., Wardhani L.O., Yamashita Y., Ueda Y., Okazaki T. (2014) Comparative analysis of biological sphingolipids with glycerophospholipids and diacylglycerol by LC-MS/MS. Metabolites 4, 98–114 [DOI] [PMC free article] [PubMed] [Google Scholar]
- 4.Hannun Y.A., Obeid L.M. (2008) Principles of bioactive lipid signalling: lessons from sphingolipids. Nat. Rev. Mol. Cell Biol. 9, 139–150 [DOI] [PubMed] [Google Scholar]
- 5.Taniguchi M., Okazaki T. (2014) The role of sphingomyelin and sphingomyelin synthases in cell death, proliferation and migration from cell and animal models to human disorders. Biochim. Biophys. Acta (BBA) 1841, 692–703 [DOI] [PubMed] [Google Scholar]
- 6.Yano M., Watanabe K., Yamamoto T., Ikeda K., Senokuchi T., Lu M., Kadomatsu T., Tsukano H., Ikawa M., Okabe M., Yamaoka S., Okazaki T., Umehara H., Gotoh T., Song W.J., Node K., Taguchi R., Yamagata K., Oike Y. (2011) Mitochondrial dysfunction and increased reactive oxygen species impair insulin secretion in sphingomyelin synthase 1-null mice. J. Biol. Chem. 286, 3992–4002 [DOI] [PMC free article] [PubMed] [Google Scholar]
- 7.Yano M., Yamamoto T., Nishimura N., Gotoh T., Watanabe K., Ikeda K., Garan Y., Taguchi R., Node K., Okazaki T., Oike Y. (2013) Increased oxidative stress impairs adipose tissue function in sphingomyelin synthase 1 null mice. PLoS One 8, e61380. [DOI] [PMC free article] [PubMed] [Google Scholar]
- 8.Hailemariam T.K., Huan C., Liu J., Li Z., Roman C., Kalbfeisch M., Bui H.H., Peake D.A., Kuo M.S., Cao G., Wadgaonkar R., Jiang X.C. (2008) Sphingomyelin synthase 2 deficiency attenuates NFκB activation. Arterioscler. Thromb. Vasc.Biol. 28, 1519–1526 [DOI] [PubMed] [Google Scholar]
- 9.Liu J., Zhang H., Li Z., Hailemariam T.K., Chakraborty M., Jiang K., Qiu D., Bui H.H., Peake D.A., Kuo M.S., Wadgaonkar R., Cao G., Jiang X.C. (2009) Sphingomyelin synthase 2 is one of the determinants for plasma and liver sphingomyelin levels in mice. Arterioscler. Thromb. Vasc. Biol. 29, 850–856 [DOI] [PMC free article] [PubMed] [Google Scholar]
- 10.Hall H.G., Farson D.A., Bissell M.J. (1982) Lumen formation by epithelial cell lines in response to collagen overlay: a morphogenetic model in culture. Proc. Natl. Acad. Sci. USA 79, 4672–4676 [DOI] [PMC free article] [PubMed] [Google Scholar]
- 11.O'Brien L.E., Zegers M.M., Mostov K.E. (2002) Opinion: Building epithelial architecture: insights from three-dimensional culture models. Nat. Rev. Mol. Cell Biol. 3, 531–537 [DOI] [PubMed] [Google Scholar]
- 12.Nishioka T., Aoki K., Hikake K., Yoshizaki H., Kiyokawa E., Matsuda M. (2008) Rapid turnover rate of phosphoinositides at the front of migrating MDCK cells. Mol. Biol. Cell 19, 4213–4223 [DOI] [PMC free article] [PubMed] [Google Scholar]
- 13.Sampaio J.L., Gerl M.J., Klose C., Ejsing C.S., Beug H., Simons K., Shevchenko A. (2011) Membrane lipidome of an epithelial cell line. Proc. Natl. Acad. Sci. USA 108, 1903–1907 [DOI] [PMC free article] [PubMed] [Google Scholar]
- 14.Paszek M.J., Zahir N., Johnson K.R., Lakins J.N., Rozenberg G.I., Gefen A., Reinhart-King C.A., Margulies S.S., Dembo M., Boettiger D., Hammer D., Weaver V.M. (2005) Tensional homeostasis and the malignant phenotype. Can. Cell 8, 241–254 [DOI] [PubMed] [Google Scholar]
- 15.Sakurai A., Matsuda M., Kiyokawa E. (2012) Activated Ras protein accelerates cell cycle progression to perturb MDCK cystogenesis. J. Biol. Chem. 287, 31703–31711 [DOI] [PMC free article] [PubMed] [Google Scholar]
- 16.Hara S., Kiyokawa E., Iemura S., Natsume T., Wassmer T., Cullen P. J., Hiai H., Matsuda M. (2008) The DHR1 domain of DOCK180 binds to SNX5 and regulates cation-independent mannose 6-phosphate receptor transport. Mol. Biol. Cell 19, 3823–3835 [DOI] [PMC free article] [PubMed] [Google Scholar]
- 17.Yagi S., Matsuda M., Kiyokawa E. (2012) Suppression of Rac1 Activity at the apical membrane of MDCK cells is essential for cyst structure maintenance. EMBO Rep. 13, 237–243 [DOI] [PMC free article] [PubMed] [Google Scholar]
- 18.Akagi T., Shishido T., Murata K., Hanafusa H. (2000) v-Crk activates the phosphoinositide 3-kinase/AKT pathway in transformation. Proc. Natl. Acad. Sci. USA 97, 7290–7295 [DOI] [PMC free article] [PubMed] [Google Scholar]
- 19.Martin-Belmonte F., Gassama A., Datta A., Yu W., Rescher U., Gerke V., Mostov K. (2007) PTEN-mediated apical segregation of phosphoinositides controls epithelial morphogenesis through Cdc42. Cell , 128, 383–397 [DOI] [PMC free article] [PubMed] [Google Scholar]
- 20.Pollack A.L., Runyan R.B., Mostov K.E. (1998) Morphogenetic mechanisms of epithelial tubulogenesis: MDCK cell polarity is transiently rearranged without loss of cell-cell contact during scatter factor/hepatocyte growth factor-induced tubulogenesis. Dev. Biol. 204, 64–79 [DOI] [PubMed] [Google Scholar]
- 21.Silva L.C., de Almeida R.F.M., Castro B.M., Fedorov A., Prieto M. (2007) Ceramide-domain formation and collapse in lipid rafts: Membrane reorganization by an apoptotic lipid. Biophys J. 92, 502–516 [DOI] [PMC free article] [PubMed] [Google Scholar]
- 22.Nishimura K., Fukagawa T., Takisawa H., Kakimoto T., Kanemaki M. (2009) An auxin-based degron system for the rapid depletion of proteins in nonplant cells. Nat Methods 6, 917–922 [DOI] [PubMed] [Google Scholar]
- 23.O'Brien L.E., Jou T.S., Pollack A.L., Zhang Q., Hansen S.H., Yurchenco P., Mostov K.E. (2001) Rac1 orientates epithelial apical polarity through effects on basolateral laminin assembly. Nat. Cell Biol. 3, 831–838 [DOI] [PubMed] [Google Scholar]
- 24.Silva L.C., Ben David O., Pewzner-Jung Y., Laviad E.L., Stiban J., Bandyopadhyay S., Merrill A.H., Prieto M., Futerman A.H. (2012) Ablation of ceramide synthase 2 strongly affects biophysical properties of membranes. J. Lipid Res. 53, 430–436 [DOI] [PMC free article] [PubMed] [Google Scholar]
- 25.Yamaji-Hasegawa A., Makino A., Baba T., Senoh Y., Kimura-Suda H., Sato S.B., Terada N., Ohno S., Kiyokawa E., Umeda M., Kobayashi T. (2003) Oligomerization and pore formation of a sphingomyelin-specific toxin, lysenin. J. Biol. Chem. , 278, 22762–22770 [DOI] [PubMed] [Google Scholar]
- 26.Ishitsuka R., Yamaji-Hasegawa A., Makino A., Hirabayashi Y., Kobayashi T. (2004) A Lipid-Specific Toxin Reveals Heterogeneity of sphingomyelin-containing membranes. Biophys. J. 86, 296–307 [DOI] [PMC free article] [PubMed] [Google Scholar]
- 27.Ikenouchi J., Suzuki M., Umeda K., Ikeda K., Taguchi R., Kobayashi T., Sato S.B., Kobayashi T., Stolz D.B., Umeda M. (2012) Lipid polarity is maintained in absence of tight junctions. J. Biol. Chem. 287, 9525–9533 [DOI] [PMC free article] [PubMed] [Google Scholar]
- 28.Kiyokawa E., Baba T., Otsuka N., Makino A., Ohno S., Kobayashi T. (2005) Spatial and functional heterogeneity of sphingolipid-rich membrane domains. J. Biol. Chem. 280, 24072–24084 [DOI] [PubMed] [Google Scholar]
- 29.Nieto F.L., Pescio L.G., Favale N.s.O., Adamo A.M., Sterin-Speziale N.B. (2008) Sphingolipid metabolism is a crucial determinant of cellular fate in nonstimulated proliferating Madin-Darby Canine Kidney (MDCK) cells. J. Biol. Chem. 283, 25682–25691 [DOI] [PubMed] [Google Scholar]
- 30.Mishra S., Chatterjee S. (2014) Lactosylceramide promotes hypertrophy through ROS generation and activation of ERK1/2 in cardiomyocytes. Glycobiology 24, 518–531 [DOI] [PMC free article] [PubMed] [Google Scholar]
- 31.Bhunia A. K., Han H., Snowden A., Chatterjee S. (1996) Lactosylceramide stimulates Ras-GTP loading, kinases (MEK, Raf), p44 mitogen-activated protein kinase, and c-fos expression in human aortic Smooth muscle cells. J. Biol. Chem. 271, 10660–10666 [DOI] [PubMed] [Google Scholar]
- 32.Nakamura H., Moriyama Y., Makiyama T., Emori S., Yamashita H., Yamazaki R., Murayama T. (2013) Lactosylceramide interacts with and activates cytosolic phospholipase A2α. J. Biol. Chem. 288, 23264–23272 [DOI] [PMC free article] [PubMed] [Google Scholar]
- 33.Kiyokawa E., Minato H. (2014) Activated K-RAS and its effect on morphological appearance. J. Biochem. 156, 137–145 [DOI] [PubMed] [Google Scholar]
Associated Data
This section collects any data citations, data availability statements, or supplementary materials included in this article.


