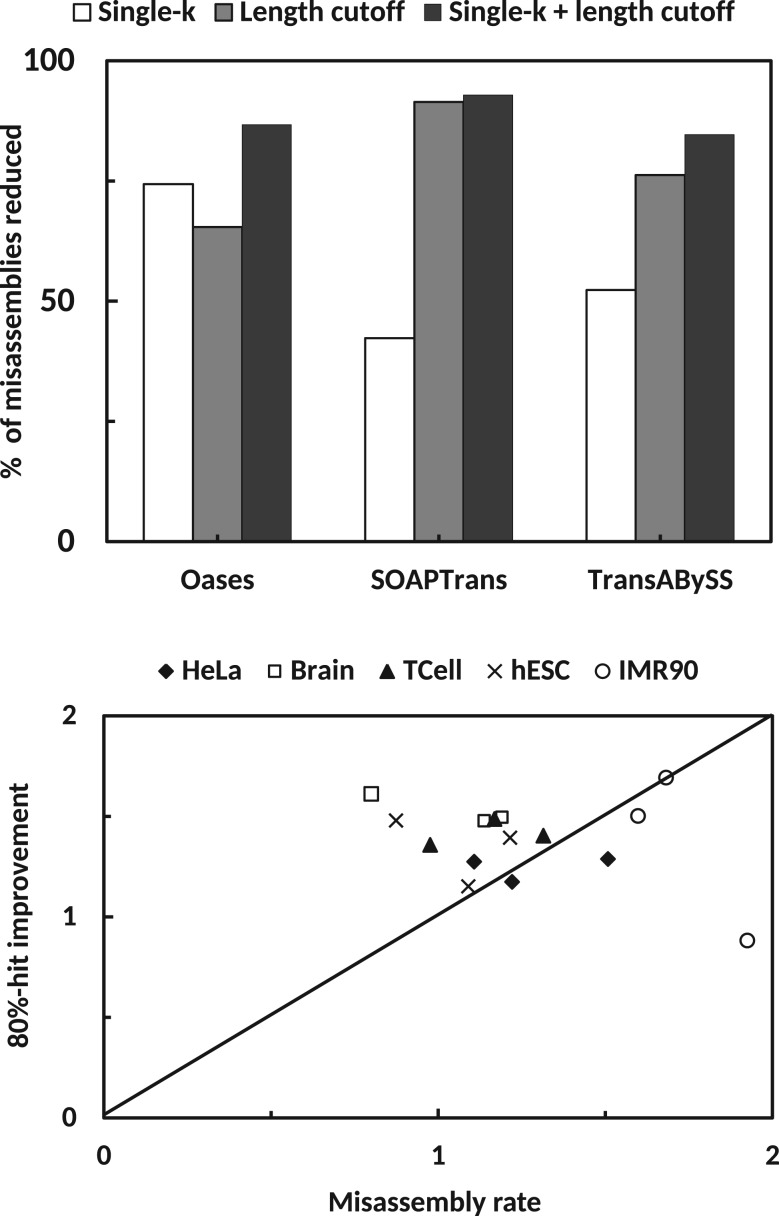
Fig. 6.
Analysis of different misassembly removal strategies. (top) The bar plot represents the performance of various removal strategy in terms of percentage of misassemblies removed on Brain dataset. Single-k cluster removal (white bar) and 300 bp length cutoff based removal (grey bar) removes a high percentage of misassemblies. A combination of both methods (black bar) performs better than applying only one strategy. (bottom) Comparison of 80%-hit improvement rate and misassembly rate for all computed assemblies (see ‘Methods’)

