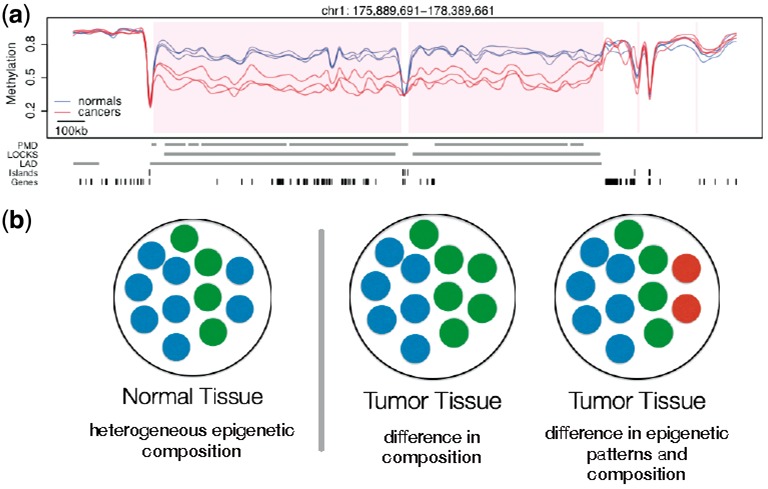
Fig. 1.

Differences in DNAm percentage at a given locus are indicative of a shift in the epigenetic composition of cell populations. (a) Base-pair-level DNAm percentage estimate for three colon tumors and paired normal tissue (Figure from Hansen et al., 2011). (b) Different shifts in the epigenetic composition of the cell population in a tissue lead to identical marginal differences of DNAm percentage at the base-pair level
