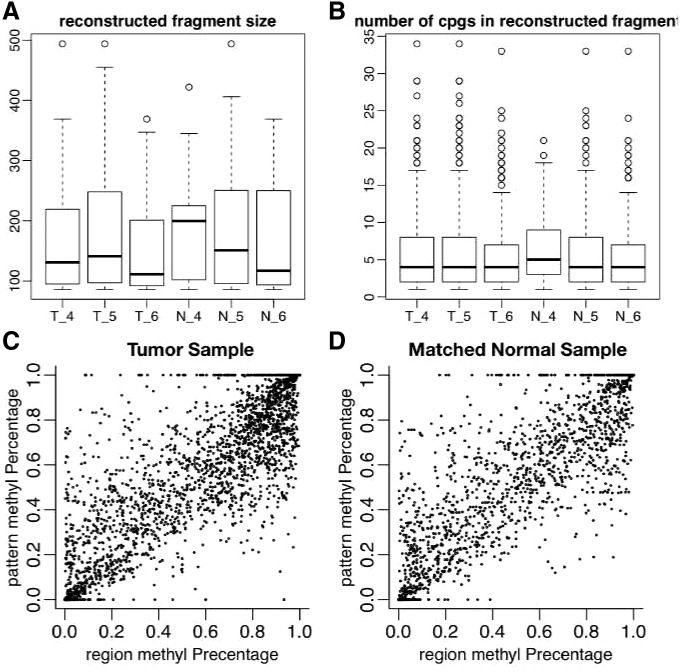
Fig. 5.
Pattern estimation in targeted bisulfite sequencing of three colon tumors and matched normal tissue in chromosome 13. (A) Length distributions of reconstructed cell-specific methylation patterns. (B) Distributions of the number of CpGs per reconstructed cell-specific methylation patterns. (C and D) CpG methylation percentage estimated from reconstructed cell-specific methylation patterns (pattern methyl Percentage) versus observed CpG methylation percentage (region methyl Percentage) for a single tumor sample and matched normal

