

Abstract
Microbial communities are a key component of host health. As the microbiota is initially ‘foreign’ to a host, the host's immune system should respond to its acquisition. Such variation in the response should relate not only to host genetic background, but also to differences in the beneficial properties of the microbiota. However, little is known about such interactions. Here, we investigate the gut microbiota of the bumblebee, Bombus terrestris, which has a protective function against the bee's natural trypanosome gut parasite, Crithidia bombi. We transplanted ‘resistant’ and ‘susceptible’ microbiota into ‘resistant’ and ‘susceptible’ host backgrounds, and studied the activity of the host immune system. We found that bees from different resistance backgrounds receiving a microbiota differed in aspects of their immune response. At the same time, the elicited immune response also depended on the received microbiota's resistance phenotype. Furthermore, the microbial community composition differed between microbiota resistance phenotypes (resistant versus susceptible). Our results underline the complex feedback between the host's ability to potentially exert selection on the establishment of a microbial community and the influence of the microbial community on the host immune response in turn.
Keywords: microbiota, gene expression, host–parasite, resistance, Bombus terrestris, Crithidia bombi
1. Introduction
Virtually all organisms have symbionts or host-associated bacterial communities, which are known as the microbiota. In the context of general host health, the importance of the microbiota, especially the one in the gut, has long been recognized [1]. Microbiota can benefit the health of the host in various ways; for example, through effects on nutrition [2], or by increasing resistance towards parasitic infections. The latter can be either through direct interaction with the pathogen [3,4] or indirectly, through interaction with the host immune system [5]. However, even though the protective function of microbiota has been observed in various organisms [6–8], clear examples of how symbionts affect resistance against parasitism are more recent, as for example in the aphid–parasitoid wasp system [9,10].
Koch & Schmid-Hempel [11] demonstrated a microbiota-mediated specific infection outcome. In the bumblebee, Bombus terrestris, the transplanted microbiota had a similar influence on specificity (i.e. differences in resistance to various infecting strains of the trypanosome parasite, Crithidia bombi) as the host genotype did. More importantly, different microbiota conveyed varying levels of overall protectiveness to the host. Bumblebee larvae shed their gut and its content (as the meconium) during metamorphosis [12], and thus emerge as microbiota-free adults from the puparium [12,13]. Within the first few days upon emergence, bees acquire a typical gut microbiota within their social environment, probably via faeces-contaminated nest material and coprophagy [13–15]. Therefore, it is reasonable to think of the host as the provider of the environment for the establishing microbial community. In fact, as previously shown, the individual microbiota is taken up within and from the social environment of the colony [13]. Because many bacteria are circulating in such an environment, the host could and should ‘select’ what bacteria it will acquire; especially, it has to differentiate between benign and harmful microorganisms. The microbes, in turn, will be selected to follow their own interests of being taken up and propagated. They may also signal to the host whether they are benign or harmful, and even send dishonest signals, too. It is as yet unknown whether these signals exist and exactly how these potential processes unfold. In a simple manner, hosts may, for example, actively modify their gut environment in order to accommodate and select for the establishment of a beneficial microbiota, and keep out unwanted microorganisms. If so, interactions of the microorganisms with the immune system are to be expected during establishment, as bacteria invading the gut are initially ‘foreign’ to the host [16]. Although the immune response upon parasite exposure in bumblebees is partly understood [17–20], the nature of the immune response to potentially mutualistic or commensal microbes is still a matter of considerable debate [16]. Nevertheless, if hosts have the ability to influence the establishment of the microbiota via the host immune system, we expect to find variation in the immune response towards different classes of microorganisms (i.e. beneficial and non-beneficial), and among the hosts themselves [21,22], similar to the variation in gene expression that underlies the specificity of host–parasite interactions [17,23]. Additionally, in different environments (i.e. the background set by the different colonies), there may be different kinds of microbiota available to be taken up by newly emerged workers (i.e. the hosts). If, for example, a ‘protective’ microbiota is available (i.e. a bacterial community that provides protection against infections), we would expect any host's immune system to respond less intensively than when confronted with a ‘non-beneficial’, non-protective microbiota. Here, a reasonable but as yet untested assumption is that milder responses would facilitate the uptake of the bacterial community. In this hypothetical scenario, the microbiota that eventually establishes results from the host's immune response selecting from the available bacterial community in the environment.
While this hypothesis is probably too simplistic, it has the advantage of being testable as a first step towards understanding the functional significance of microbiota establishment. In this study, we therefore explored this hypothesis in three stages. (i) We investigated whether there is variation in how bumblebee colonies respond to infections by the trypanosome gut parasite, C. bombi, and defined ‘resistant’ or ‘susceptible’ colonies. At the same time, we defined the microbiota contained in these colonies, respectively, as ‘resistant’ or ‘susceptible’, too. (ii) We tested for the (early) immune gene expression response of microbe-free recipient workers from a resistant or susceptible colony background to faecal transplants of microbiota from donors of either resistant or susceptible colony origin. This allowed us to disentangle effects of host phenotype (i.e. the recipient's resistance background) from effects due to differences between microbiota resistance phenotypes (i.e. from donor transplants). (iii) We asked whether the different recipient and donor resistance phenotypes are associated with different compositions of microbiota (i.e. differences in the bacterial community structure at the time of the early response).
2. Material and methods
Thirty colonies were raised in the laboratory from queens of B. terrestris, which were field-caught in spring 2013 in northern Switzerland (Neunforn). We assayed the resistance profile of five workers for each colony 7 days post-infection towards a cocktail of five genetically distinct parasite strains of C. bombi, mixed in equal proportions. For this, parasite load (number of cells) was quantified by means of qPCR [24], and infection diversity (number of strains, i.e. different genotypes present) through microsatellite genotyping [25] (electronic supplementary material, S1). The obtained resistance profiles (figure 1) were then used to select four of the most susceptible and three of the most resistant colonies. An additional selection criterion for the microbiota transplant experiment was good colony development (i.e. having enough workers). From each of these colonies, brood was isolated and surface-sterilized. Workers, which emerge germ-free [12,13], were taken from the isolated brood and served as recipients in the transplant experiment. Brood and recipients were kept sterile at all times. To transplant the microbiota, we collected faeces from workers (referred to as donors), which emerged and remained in their source colonies and thus had naturally acquired their microbiota (see electronic supplementary material, S2 for experimental details). Note that the resistance phenotype of donors and recipients was always defined as either ‘resistant’ or ‘susceptible’, and refers to the measured resistance profile (i.e. infection outcome) for a given colony (as in figure 1). Thus, each colony represents a certain (genotypic) background that carries at the same time a certain microbiota type. Note that the defined resistance phenotype relates to both a colony (as the recipient) and its microbiota (as the donor).
Figure 1.
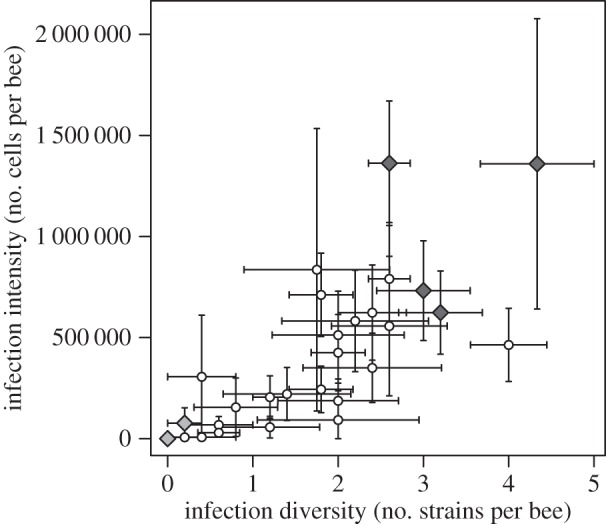
Variation in resistance among colonies. The graph plots colony mean infection intensity against colony mean infection diversity 7 days post-infection (Spearman's ρ = 0.74, p < 0.001, n = 30; bars represent s.e.m.). Diamonds highlight colonies used in the microbiota transplant experiment (light grey, ‘resistant’ phenotype; dark grey, ‘susceptible’ phenotype; two resistant colonies overlay each other at zero). Note that infection intensity represents the total number of parasite cells present in a worker as assessed by quantitative PCR.
We performed crosswise faecal microbiota transplants of resistant and susceptible donors into recipients of resistant and susceptible backgrounds (see the electronic supplementary material, figure S1 for experimental design). Standardized microbiota transplants were orally administered 1–3 days after emergence of the recipients (electronic supplementary material, S2). These bees were snap-frozen 18 h post-transplant in liquid nitrogen and stored at −80°C. This time point was chosen to make the results comparable to earlier studies of gene expression upon infection by C. bombi in this system [23]. Later, from these samples, we simultaneously extracted RNA and DNA from whole abdomen (electronic supplementary material, S3). The host gene expression response to the microbiota transplant was measured in triplicates by quantitative PCR for 31 candidate genes belonging to six functional gene classes, and normalized against the most stable combination of housekeeping genes [26] (electronic supplementary material, S4 and table S1). In order to assess the microbial community present at the time, the variable regions V3–V4 of the 16S rRNA gene were amplified using the region-specific universal primers (314F, 806R; electronic supplementary material, table S2) and subjected to sequencing on the Illumina MiSeq platform (electronic supplementary material, S6). Amplicons passing quality control were merged, chimaeras were eliminated and operational taxonomic units (OTUs) were generated based on 97% sequence identity (electronic supplementary material, S7). Statistical analyses of microbiota community composition were performed either on non-rarefied OTU count data [27] or for comparability on the count data rarefied to the smallest library size (the results of the latter are reported in the electronic supplementary material, S8). For both the analysis of the recipient immune response to the faecal microbiota transplants (electronic supplementary material, S5) and the analysis of the microbiota community structure (electronic supplementary material, S8) we tested for a recipient resistance phenotype and donor resistance phenotype effect, as well as their interaction.
3. Results
(a). Colony resistance profiles
To assess the resistance profile for each colony, we exploited the natural variation in the infection outcome, that is, when the workers were exposed to a ‘cocktail’ infection that initially contained five genetically distinct strains of C. bombi at equal amounts. As figure 1 shows, we found variation and a positive association between infection intensity (number of parasite cells) and infection diversity (number of parasite strains) that had established 7 days post-infection. Hence, infection intensity builds up as more strains are able to establish. We therefore defined ‘susceptible’ and ‘resistant’ to be associated with higher and lower infection intensity, and higher and lower infection diversity, respectively.
For the second part of this study, we then selected, out of this pool, four ‘susceptible’ and three ‘resistant’ colonies from the extreme ends of the distribution (figure 1). Workers from the selected colonies of the ‘susceptible’ type showed a mean infection intensity of 981 554 cells per worker (s.e. = 172 986, n = 18) and an infection diversity of 3.17 strains per worker (s.e. = 0.26, n = 18). Colonies of the resistant group showed virtually no infection, with only one worker (from colony 13.094) infected with an estimated 381 846 cells of one parasite strain (strain tag: 08.192).
(b). Gene expression upon faecal microbiota transplant
To measure the response of workers upon receiving a microbiota transplant, we analysed the expression of a set of candidate genes, representing six immunologically relevant functional gene classes (electronic supplementary material, table S1). We performed MANOVA analyses separately for each functional gene class to test for both differential effects of donor and recipient phenotypes (resistant versus susceptible) and their interaction effects on the gene expression response. Minimal adequate models are reported in table 1 (electronic supplementary material, S5). Contrary to expectation, neither one of the gene classes showed a statistical interaction between recipient phenotype and donor phenotype (table 1).
Table 1.
MANOVA results for all gene classes and summary of linear discriminant analysis (LDA). See the electronic supplementary material, tables S3–S5 for detailed LDA report and MANOVA results with outliers excluded.
| functional gene class | factora | d.f., residuals | pillai | approx. F | num d.f., den d.f. | p-value | LDA accuracyb (%) | two genes with highest coefficientb |
|---|---|---|---|---|---|---|---|---|
| recognition | recipient phenotype | 1, 28 | 0.419 | 2.266 | 7, 22 | 0.068 | 65.52 | BGRP2, PGRP-LC |
| signalling | donor phenotype | 1, 27 | 0.438 | 4.683 | 4, 24 | 0.017 | 68.97 | relish, hopscotch |
| effectors | recipient phenotype | 1, 28 | 0.726 | 6.609 | 8, 20 | 0.0003 | 79.31 | TEPA, defensin |
| donor phenotype | 1, 28 | 0.461 | 2.141 | 8, 20 | 0.080 | 60.00 | TEPA, ferritin | |
| metabolism | donor phenotype | 1, 29 | 0.346 | 4.750 | 3, 27 | 0.009 | 61.29 | vitellogenin, apolipophorin III |
| ROS | donor phenotype | 1, 28 | 0.377 | 8.175 | 2, 25 | 0.003 | 76.67 | peroxiredoxin 5, jafrac |
| melanization | donor phenotype | 1, 27 | 0.366 | 3.315 | 4, 23 | 0.028 | 79.31 | catsup, serpin27a |
| recipient phenotype | 1, 27 | 0.390 | 3.674 | 4, 23 | 0.019 | 59.26 | serpin27a, PPO |
aStatistics of the minimal model (i.e. retaining only independent variables with a p-value of less than or equal to 0.1) for the MANOVA results are reported.
bSummary values for LDA classification function are given (i.e. accuracy), as well as the two genes contributing most to the discriminant function.
However, we found that all gene classes, except for the recognition genes, were significantly affected by either donor phenotype (the microbiota received) or by recipient phenotype (the resistance background of the recipient). In particular, the donor phenotype elicited differential expression responses in four out of six gene classes—signalling, reactive oxygen species (ROS), metabolism and melanization—as well as having a weak influence on the expression pattern of the effector class. In contrast, the recipient phenotype only influenced expression in the effector and melanization classes, with some evidence for an effect in the recognition class. Only the melanization class showed an effect of both donor and recipient phenotype (but not their interaction; table 1).
To tease apart the MANOVA results, we performed linear discriminant analysis (LDA) to identify the gene classes that best discriminate between the two resistance phenotypes of donors and recipients, respectively, as well as to deduce genes contributing most to group separation (table 1). Depending on gene class, leave-one-out (jack-knifed) cross-validation resulted in correct classification of donor phenotype in 61–79% of the cases and recipient phenotype in 59–79% of the cases. This is higher than expected by chance (50%) for all cases (electronic supplementary material, table S3).
Figure 2 shows the univariate responses of gene expression within each class as the fold change relative to the resistant phenotype for both (a) the recipient and (b) the donor effects. Genes that were significantly differentially expressed (with asterisks in figure 2) were not necessarily those genes that contributed most to the phenotype separation (table 1) and thus had the highest impact on the discriminant function. This discrepancy is most pronounced for the effector gene class, where the anti-microbial peptide apidaecin is differentially expressed between the recipient phenotypes, but the gene's contribution to group separation measured by the partial coefficient is relatively small (coef. = −1.30; for all coefficients see the electronic supplementary material, table S4). This is not nearly as influential for separation as the genes not differentially expressed, such as the effector gene of the JAK/STAT pathway TEPA (coef. = 99.88). Also, the signalling gene of the JNK pathway, basket (coef. = −14.78), is differentially expressed, but relish (coef. = 471.9), of the Imd pathway, which contributes more to the resistance phenotype separation, is not differentially expressed. Interestingly, a permutation test for homogeneity of multivariate variance revealed that the gene expression response to a susceptible donor transplant was less variable in several gene classes compared with the resistant transplant phenotype (recognition: F1,29 = 8.19, p = 0.004; metabolism: F1,29 = 11.71, p = 0.003; ROS: F1,29 = 8.40, p = 0.002). Similarly, the gene expression response was less variable in susceptible recipients compared with the response of the resistant recipients. However, this is only true for the gene class of ROS (F1,29 = 14.19, p = 0.001).
Figure 2.

Gene expression in different phenotypes. Shown are gene expression fold changes of the susceptible phenotype (dark grey) relative to the resistant phenotype (light grey) for (a) recipients and (b) donors upon microbiota transplant. Plotted are the group means of the log2 (–ddCt values) with 95% CI including error propagation after Hellemans et al. [26] (electronic supplementary material, S5). A log2-fold change = 0 equals no change in expression between resistance phenotypes; log2-fold change = 1 translates to a twofold absolute difference. Asterisks mark individual genes significantly differentially expressed between phenotypes after correction for multiple testing (*p < 0.05, **p < 0.01).
(c). Microbiota community composition
In order to link gene expression patterns with features of the gut microbiota community composition, we assessed the microbial community structure present at the time of the gene expression measurement. Overall, after the generated 16S amplicon sequences were processed and quality controlled (electronic supplementary material, S7), the microbiota composition was described by 159 OTUs. We defined ‘ecologically’ abundant OTUs as OTUs that occur in at least 85% of all samples within a dataset. This resulted in 19 common OTUs (out of 159) still representing 99.2% of the total number of reads. Rarefaction analysis revealed that achieved sequencing depth adequately reflected microbiota complexity (electronic supplementary material, figure S2). As sequencing depth among individual samples differed, we present the results of the statistical analysis from the non-rarefied datasets, where we use methods that statistically account for unequal sequencing depth among samples [27]. Alternatively, random subsampling of the OTU table of each sample to the lowest sequencing depth is a common practice. The repeated (n = 100) rarefaction to the smallest sequencing depth (n = 50 792) retained, on average, 134.6 OTUs (s.d. = 3.3). Applying the same OTU classification criteria to these rarefied datasets, we identified, on average, 12.1 ecologically common OTUs (s.d. = 1.1, n = 100). Results of further statistical analysis of the rarefied data can be found in the electronic supplementary material, figure S3.
We investigated whether differences in microbiota community structure could be attributed to the resistance phenotype (resistant versus susceptible) of the donor and/or the recipient, or to the interaction of the two. First, we looked at the total proportion of reads from ecologically common OTUs in samples and found that the proportion of common reads was only affected by donor resistance phenotype (GLM: F1,29 = 12.44, p = 0.001), where microbial communities of the susceptible phenotype contained on average 1.8% (s.e. = 0.6) more common reads compared with the resistant donor phenotype. Second, we tested ecologically common OTUs for differential abundances between donor and recipient phenotypes. Figure 3 shows the log2-fold change in abundance of OTUs relative to the abundance in the resistant recipient phenotype (figure 3a) and to the resistant donor phenotype (figure 3b), respectively. Donor resistance phenotypes differed significantly from zero in the log2-fold changes of OTU abundance (Wald test: OTU_6:  p < 0.001; OTU_9:
  p < 0.001; OTU_44:
  p = 0.008; figure 3b with asterisk). OTU_6 belongs to the class of Gammaproteobacteria, OTU_9 is ascribed to the order Rhizobiales of the class Alphaproteobacteria, and OTU_44 was classified to the Lactobacillus genus (see the electronic supplementary material, tables S6 and S7 for taxonomy of ecologically common OTUs). We detected neither a difference in OTU abundance among the recipient phenotypes (figure 3a), nor any statistical interaction between recipient and donor phenotypes.
Figure 3.
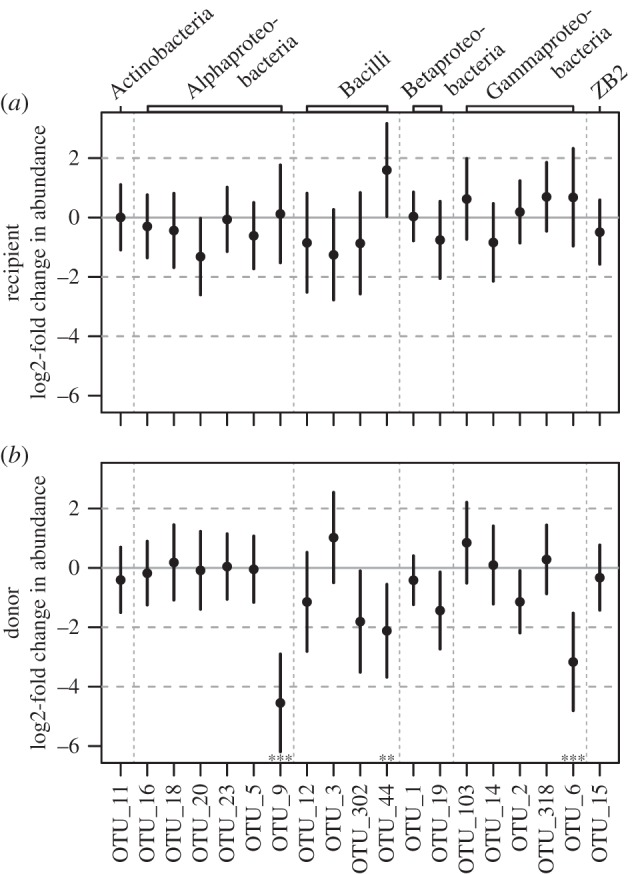
Abundance fold change in microbiota ‘species’ (OTU) composition. Log2-fold changes in abundance are shown for ecologically common OTUs of the resistant phenotype (black) relative to (a) the susceptible recipient phenotype and (b) the susceptible donor phenotype. Plotted are mean ‘moderated’-fold changes [28] for each OTU with 95% CI. Asterisks indicate significant abundance fold changes after accounting for multiple testing (**p < 0.01, ***p < 0.001). OTUs with a log2-fold change value more than 0 are more abundant (less than 0 less abundant) in the resistant phenotype relative to the susceptible phenotype.
Surprisingly, despite the absence of differentially abundant OTUs between recipient resistance phenotypes, leave-one-out (jack-knifed) cross-validation of the LDA of the common OTUs performed on average equally well for both donor and recipient phenotype discrimination (74.19% correctly classified compared with 50% expected by chance, n = 31). Table 2 lists the top six OTUs that contributed most to the separation of donor and recipient resistance phenotypes. It indicates, similarly to the results from the gene expression analysis, that differential abundance is not predictive of an OTU's relative contribution to the discriminant function.
Table 2.
Top six partial correlation coefficients of linear discriminant analysis of ecologically common OTUs for phenotype discrimination.
| recipient phenotypes |
donor phenotypes |
||
|---|---|---|---|
| OTU | LD coefficient | OTU | LD coefficient |
| OTU_318 | −2.04 | OTU_5 | −4.51 |
| OTU_44 | −1.39 | OTU_16 | 2.31 |
| OTU_11 | −1.29 | OTU_1 | −1.40 |
| OTU_2 | −0.95 | OTU_11 | 1.08 |
| OTU_5 | 0.94 | OTU_9 | 1.07 |
| OTU_9 | 0.91 | OTU_15 | 1.00 |
4. Discussion
The specificity of host–parasite interactions has been shown to be mediated by the presence of symbionts, or by the entire host-associated bacterial community (i.e. the microbiota) [9–11]. As such, the establishment of a community that is beneficial to the host becomes an important element of host defence.
Screening host colonies for their resistance profile provided us with the prerequisite to separate both the effects of among-host background variation and the variation among the gut microbiota of different host backgrounds with respect to the outcome of the host–parasite interaction. On the one hand, the positive correlation between infection intensity and infection diversity (number of strains that established; figure 1) confirmed previous studies [24,29]. This pattern is suggestive of a situation where each parasite strain occupies its own niche within the host [30]. On the other hand, and for the purpose of our study, the resistance variation among host colonies enabled us to choose specific resistance phenotypes for the successive experiment, based on the natural infection outcome for a given host colony (figure 1). Thus, recipient hosts are assumed to have their colony's (genetic) resistance background (i.e. the presumed selection potential for allowing a protective microbial community to establish). Donor transplants from colonies represent the naturally established microbial gut communities with the presumed protective ability (resistant versus susceptible). The microbiota's phenotype would thus modulate the observed resistance (here immune response) of the receiving host—either independently or in combination with the pre-existing background resistance of the receiving host.
The early gene expression response upon faecal transplants (figure 2 and table 1) suggests that host genetics as well as the transplanted microbiota affect the host immune response. Surprisingly, we did not detect a statistical interaction between donor and recipient phenotype, which suggests that the specificity observed for the infection outcome is not reflected in a specific host–microbiota interaction, as tentatively suggested before [11]. We also found differential gene expression patterns among susceptible and resistant colony phenotypes, comparable with recent studies in Drosophila [22,31].
The recipient effect on the immune response may indicate inherent differences between the two genetic host resistance backgrounds in their ability to impose selection on the establishing community. In particular, effector and melanization gene classes emerged as potential candidates to mediate such selection. Interestingly, within the effector gene class, the anti-microbial peptides (AMPs) showed a strong signal of differential expression. This highlights a surprising similarity to the differential response in AMPs observed upon infection by a parasite, where more susceptible colonies show a stronger upregulation of AMPs as compared with more resistant colonies [23]. In our experiment, recipients from a susceptible resistance background also upregulate AMPs compared with recipients from a resistant background. AMPs have previously been suggested to play an important role in shaping host-associated communities in various other organisms [32,33]. Yet, in Drosophila at least, it remains unclear how host genotype eventually maps to host resistance phenotype [22,34].
In turn, we found that the microbiota phenotypes differed in their ability to modulate the receiving host's immune response. Donor microbiota from susceptible colonies elicited a stronger gene expression response in their recipients compared with resistant microbiota, supporting our simple hypothesis for the best assembly. Indeed, differential responses could potentially result in a differential effect on community assembly—an effect that remains to be tested in this system. Such effects have previously been observed in Lepidoptera, where immune suppression by the baculovirus in larvae resulted in a less stringent regulation of the microbiota and thus an increased gut microbial load [35]. We also found that signalling and ROS gene classes discriminated best between the two donor phenotypes. Within the signalling gene class, relish contributed most to the linear discriminant function in our analysis. Relish is a key factor in the induction of the humoral immune response, such as the production of AMPs. Relish has previously been shown to be of great importance in the Drosophila host–microbiota association, where RelishE20-deficient flies show altered gut microbiota composition and gene expression patterns; genes of the signalling pathways are thereby disproportionally affected [31]. While the finding of a more variable gene expression response to a susceptible microbiota transplant is intriguing, the causes and consequences remain elusive. Overall, the independent influence of donor and recipient phenotypes should result in complex feedbacks between the host and the microbiota during the process of community establishment. The particular effects of these feedbacks on the infection outcome would need to be assessed in further studies.
Based on the gene expression result, we expected to find the microbial community to be affected by both recipient and donor phenotypes. We checked for both main effects of donor and recipient phenotypes and their interaction on microbiota community structure, analogous to the gene expression response. In the univariate analysis, by looking for differentially abundant OTUs, we detected only significant differentially abundant OTUs between donor phenotypes (figure 3). Although not directly assessed before the experimental microbiota transplant was administered, our results clearly indicated differences in the microbiota community structure among resistant and susceptible donors that persisted until at least 18 h after the transplant. However, in the multivariate analysis, by leave-one-out cross-validation of the linear discriminant function, both recipient and donor phenotypes performed equally well. The absence of any differentially abundant OTUs between recipient phenotypes might suggest that our chosen time of community assessment 18 hours after the transplant—an interval chosen for compatibility with earlier studies [23]—is probably too early for any recipient effect to strongly manifest itself. A study in honeybees (Apis mellifera) showed that bacterial abundance in newly emerged workers increases until an age of 9 days before it remains more or less stable [14]. Thus, differential selection pressure of recipient phenotype via gene expression variation on the microbiota community structure would probably only become more strongly visible at a later time point.
Despite this, the differentially abundant OTUs between resistant and susceptible donor phenotypes indicated three candidate species that might predominantly be involved in mediating the protective function of the microbiota. The three OTUs belong to three major taxonomic orders typically associated with honeybee and bumblebee gut microbiotas [36,37]. In particular, OTU_9 matches the recently described Bartonella apis species isolated from the honeybee gut [38]. While this Alphaproteobacteria OTU occurs in honeybees, the presence has rarely been reported in bumblebees [36,39,40]. This could either reflect sensitivity differences in the detection methods used or potential non-exclusivity to the gut, because we analysed 16S sequences from whole abdomen. However, Cariveau et al. [39] report potential relationships between certain Alphaproteobacteria species in B. bimaculatus and Crithidia infections. There is some evidence for Gammaproteobacteria to be an indicator species for a negative infection status [39]. Associations between Lactobacillaceae and Crithidia infection have, to our knowledge, so far not been reported.
The differentially abundant OTUs could also be viewed in the light of within-host competition and multiple infections [41,42]. In this context, several possible modes of interaction between the microbiota and the parasite need to be considered, such as exploitation (passive, through resource limitation), interference (direct attack or mechanical/chemical exclusion) or apparent competition (mediated through differential sensitivity to elicited immune response). Here, we cannot distinguish between these modes of interaction, but the differentially abundant OTUs are potential candidate species for such interactions. Crithidia probably attaches to the gut wall, as does the microbiota [14], and therefore it is likely that direct interactions between Crithidia and OTUs occur, and that, specifically, differentially abundant OTUs are involved in the dense colonization of the hindgut epithelium as observed in the honeybees [14].
In short, this study highlights host resistance background effects on the immune response to microbiota transplants, as well as the potential capacity of the received microbiota to modulate the host immune response. This certainly emphasizes the role of microbiota in the context of host–parasite interactions [11,43]. We furthermore provide evidence for potential complex feedbacks between the host's immune response and the establishing microbial community, which in turn affects a possible future parasite encounter, either through mechanism of within-host competitions [41] or in the light of immune priming and immune maturation [44].
Supplementary Material
Acknowledgements
We thank Miguel Jales and Elke Karaus for their technical support, and Gabriel Leventhal for valuable comments on the manuscript. Molecular work was performed at Genetic Diversity Center of ETH Zürich; Jean-Claude Walser provided bioinformatic support and analysis.
Data accessibility
Data have been deposited in Dryad (doi:10.5061/dryad.r02r1).
Authors' contributions
K.N. and P.S.-H. conceived the study and wrote the manuscript. K.N. performed the experiment and analysed the data.
Competing interests
We have no competing interests.
Funding
This study was financially supported by the Swiss NSF (grant no. 31003A_146467) and by the ERC (grant no. 268853, RESIST) to P.S.-H.
References
- 1.Sekirov I, Russell SL, Antunes LCM, Finlay BB. 2010. Gut microbiota in health and disease. Physiol. Rev. 90, 859–904. ( 10.1152/physrev.00045.2009) [DOI] [PubMed] [Google Scholar]
- 2.Nicholson JK, Holmes E, Kinross J, Burcelin R, Gibson G, Jia W, Pettersson S. 2012. Host–gut microbiota metabolic interactions. Science 336, 1262–1267. ( 10.1126/science.1223813) [DOI] [PubMed] [Google Scholar]
- 3.Kamada N, Kim Y-G, Sham HP, Vallance BA, Puente JL, Martens EC, Nunez G. 2012. Regulated virulence controls the ability of a pathogen to compete with the gut microbiota. Science 336, 1325–1329. ( 10.1126/science.1222195) [DOI] [PMC free article] [PubMed] [Google Scholar]
- 4.Kamada N, Chen GY, Inohara N, Nunez G. 2013. Control of pathogens and pathobionts by the gut microbiota. Nat. Immunol. 14, 685–690. ( 10.1038/ni.2608) [DOI] [PMC free article] [PubMed] [Google Scholar]
- 5.Hooper LV, Littman DR, Macpherson AJ. 2012. Interactions between the microbiota and the immune system. Science 336, 1268–1273. ( 10.1126/science.1223490) [DOI] [PMC free article] [PubMed] [Google Scholar]
- 6.Dillon RJ, Dillon VM. 2004. The gut bacteria of insects: non-pathogenic interactions. Annu. Rev. Entomol. 49, 71–92. ( 10.1146/annurev.ento.49.061802.123416) [DOI] [PubMed] [Google Scholar]
- 7.Feldhaar H. 2011. Bacterial symbionts as mediators of ecologically important traits of insect hosts. Ecol. Entomol. 36, 533–543. ( 10.1111/j.1365-2311.2011.01318.x) [DOI] [Google Scholar]
- 8.Dheilly NM, Poulin R, Thomas F. 2015. Biological warfare: microorganisms as drivers of host–parasite interactions. Infect. Genet. Evol. 34, 251–259. ( 10.1016/j.meegid.2015.05.027) [DOI] [PubMed] [Google Scholar]
- 9.Oliver KM, Moran NA, Hunter MS. 2005. Variation in resistance to parasitism in aphids is due to symbionts not host genotype. Proc. Natl Acad. Sci. USA 102, 12 795–12 800. ( 10.1073/pnas.0506131102) [DOI] [PMC free article] [PubMed] [Google Scholar]
- 10.Rouchet R, Vorburger C. 2012. Strong specificity in the interaction between parasitoids and symbiont-protected hosts. J. Evol. Biol. 25, 2369–2375. ( 10.1111/j.1420-9101.2012.02608.x) [DOI] [PubMed] [Google Scholar]
- 11.Koch H, Schmid-Hempel P. 2012. Gut microbiota instead of host genotype drive the specificity in the interaction of a natural host–parasite system. Ecol. Lett. 15, 1095–1103. ( 10.1111/j.1461-0248.2012.01831.x) [DOI] [PubMed] [Google Scholar]
- 12.Hakim RS, Baldwin K, Smagghe G. 2010. Regulation of midgut growth, development, and metamorphosis. Annu. Rev. Entomol. 55, 593–608. ( 10.1146/annurev-ento-112408-085450) [DOI] [PubMed] [Google Scholar]
- 13.Koch H, Schmid-Hempel P. 2011. Socially transmitted gut microbiota protect bumble bees against an intestinal parasite. Proc. Natl Acad. Sci. USA 108, 19 288–19 292. ( 10.1073/pnas.1110474108) [DOI] [PMC free article] [PubMed] [Google Scholar]
- 14.Martinson VG, Moy J, Moran NA. 2012. Establishment of characteristic gut bacteria during development of the honeybee worker. Appl. Environ. Microbiol. 78, 2830–2840. ( 10.1128/AEM.07810-11) [DOI] [PMC free article] [PubMed] [Google Scholar]
- 15.Powell JE, Martinson VG, Urban-Mead K, Moran NA. 2014. Routes of acquisition of the gut microbiota of Apis mellifera. Appl. Environ. Microbiol. 80, 7378–7387. ( 10.1128/AEM.01861-14) [DOI] [PMC free article] [PubMed] [Google Scholar]
- 16.Buchon N, Broderick NA, Lemaitre B. 2013. Gut homeostasis in a microbial world: insights from Drosophila melanogaster. Nat. Rev. Microbiol. 11, 615–626. ( 10.1038/nrmicro3074) [DOI] [PubMed] [Google Scholar]
- 17.Riddell C, Adams S, Schmid-Hempel P, Mallon EB, Rankin DJ. 2009. Differential expression of immune defences is associated with specific host–parasite interactions in insects. PLoS ONE 4, e7621 ( 10.1371/journal.pone.0007621.t001) [DOI] [PMC free article] [PubMed] [Google Scholar]
- 18.Brunner FS, Schmid-Hempel P, Barribeau SM. 2013. Immune gene expression in Bombus terrestris: signatures of infection despite strong variation among populations, colonies, and sister workers. PLoS ONE 8, e68181 ( 10.1371/journal.pone.0068181) [DOI] [PMC free article] [PubMed] [Google Scholar]
- 19.Barribeau SM, Schmid-Hempel P. 2013. Qualitatively different immune response of the bumblebee host, Bombus terrestris, to infection by different genotypes of the trypanosome gut parasite, Crithidia bombi. Infect. Genet. Evol. 20, 249–256. ( 10.1016/j.meegid.2013.09.014) [DOI] [PubMed] [Google Scholar]
- 20.Brunner FS, Schmid-Hempel P, Barribeau SM. 2014. Protein-poor diet reduces host-specific immune gene expression in Bombus terrestris. Proc. R. Soc. B 281, 20140128 ( 10.1098/rspb.2014.0128) [DOI] [PMC free article] [PubMed] [Google Scholar]
- 21.Vance RE, Isberg RR, Portnoy DA. 2009. Patterns of pathogenesis: discrimination of pathogenic and nonpathogenic microbes by the innate immune system. Cell Host Microbe 6, 10–21. ( 10.1016/j.chom.2009.06.007) [DOI] [PMC free article] [PubMed] [Google Scholar]
- 22.Sleiman MSB, Osman D, Massouras A, Hoffmann AA, Lemaitre B, Deplancke B. 2015. Genetic, molecular and physiological basis of variation in Drosophila gut immunocompetence. Nat. Commun. 6, 7829 ( 10.1038/ncomms8829) [DOI] [PMC free article] [PubMed] [Google Scholar]
- 23.Barribeau SM, Sadd BM, Plessis du L, Schmid-Hempel P. 2014. Gene expression differences underlying genotype-by-genotype specificity in a host–parasite system. Proc. Natl Acad. Sci. USA 111, 3496–3501. ( 10.1073/pnas.1318628111) [DOI] [PMC free article] [PubMed] [Google Scholar]
- 24.Ulrich Y, Sadd BM, Schmid-Hempel P. 2011. Strain filtering and transmission of a mixed infection in a social insect. J. Evol. Biol. 24, 354–362. ( 10.1111/j.1420-9101.2010.02172.x) [DOI] [PubMed] [Google Scholar]
- 25.Schmid-Hempel P, Reber Funk C. 2004. The distribution of genotypes of the trypanosome parasite, Crithidia bombi, in populations of its host, Bombus terrestris. Parasitology 129, 147–158. ( 10.1017/S0031182004005542) [DOI] [PubMed] [Google Scholar]
- 26.Hellemans J, Mortier G, De Paepe A, Speleman F, Vandesompele J. 2007. qBase relative quantification framework and software for management and automated analysis of real-time quantitative PCR data. Genome Biol. 8, R19 ( 10.1186/gb-2007-8-2-r19) [DOI] [PMC free article] [PubMed] [Google Scholar]
- 27.McMurdie PJ, Holmes S. 2014. Waste not, want not: why rarefying microbiome data is inadmissible. PLoS Comput. Biol. 10, e1003531 ( 10.1371/journal.pcbi.1003531) [DOI] [PMC free article] [PubMed] [Google Scholar]
- 28.Love MI, Huber W, Anders S. 2014. Moderated estimation of fold change and dispersion for RNA-seq data with DESeq2. Genome Biol. 15, 550 ( 10.1186/s13059-014-0550-8) [DOI] [PMC free article] [PubMed] [Google Scholar]
- 29.Schmid-Hempel P, Puhr K, Kruger N, Reber C, Schmid-Hempel R. 1999. Dynamic and genetic consequences of variation in horizontal transmission for a microparasitic infection. Evolution 53, 426–434. ( 10.2307/2640779) [DOI] [PubMed] [Google Scholar]
- 30.May RM, Nowak MA. 1995. Coinfection and the evolution of parasite virulence. Proc. R. Soc. Lond. B 261, 209–215. ( 10.1098/rspb.1995.0138) [DOI] [PubMed] [Google Scholar]
- 31.Broderick NA, Buchon N, Lemaitre B. 2014. Microbiota-induced changes in Drosophila melanogaster host gene expression and gut morphology. MBio 5, e01117–e01114. ( 10.1128/mBio.01117-14) [DOI] [PMC free article] [PubMed] [Google Scholar]
- 32.Salzman NH, et al. 2009. Enteric defensins are essential regulators of intestinal microbial ecology. Nat. Immunol. 11, 76–82. ( 10.1038/ni.1825) [DOI] [PMC free article] [PubMed] [Google Scholar]
- 33.Franzenburg S, Walter J, Kuenzel S, Wang J, Baines JF, Bosch TCG, Fraune S. 2013. Distinct antimicrobial peptide expression determines host species-specific bacterial associations. Proc. Natl Acad. Sci. USA 110, E3730–E3738. ( 10.1073/pnas.1304960110) [DOI] [PMC free article] [PubMed] [Google Scholar]
- 34.Lazzaro BP, Sceurman BK, Clark AG. 2004. Genetic basis of natural variation in D. melanogaster antibacterial immunity. Science 303, 1873–1876. ( 10.1126/science.1092447) [DOI] [PubMed] [Google Scholar]
- 35.Jakubowska AK, Vogel H, Herrero S. 2013. Increase in gut microbiota after immune suppression in baculovirus-infected larvae. PLoS Pathog. 9, e1003379 ( 10.1371/journal.ppat.1003379.s008) [DOI] [PMC free article] [PubMed] [Google Scholar]
- 36.Martinson VG, Danforth BN, Minckley RL, Rueppell O, Tingek S, Moran NA. 2011. A simple and distinctive microbiota associated with honey bees and bumble bees. Mol. Ecol. 20, 619–628. ( 10.1111/j.1365-294X.2010.04959.x) [DOI] [PubMed] [Google Scholar]
- 37.Koch H, Schmid-Hempel P. 2011. Bacterial communities in central European bumblebees: low diversity and high specificity. Microb. Ecol. 62, 121–133. ( 10.1007/s00248-011-9854-3) [DOI] [PubMed] [Google Scholar]
- 38.Kešnerová L, Moritz R, Engel P. 2016. Bartonella apis sp. nov., a honey bee gut symbiont of the class Alphaproteobacteria. Int. J. Syst. Evol. Microbiol. 66, 414–421. ( 10.1099/ijsem.0.000736) [DOI] [PubMed] [Google Scholar]
- 39.Cariveau DP, Elijah Powell J, Koch H, Winfree R, Moran NA. 2014. Variation in gut microbial communities and its association with pathogen infection in wild bumble bees (Bombus). ISME J. 8, 2369–2379. ( 10.1038/ismej.2014.68) [DOI] [PMC free article] [PubMed] [Google Scholar]
- 40.Lim HC, Chu C-C, Seufferheld MJ, Cameron SA. 2015. Deep sequencing and ecological characterization of gut microbial communities of diverse bumble bee species. PLoS ONE 10, e0118566 ( 10.1371/journal.pone.0118566) [DOI] [PMC free article] [PubMed] [Google Scholar]
- 41.Read AF, Taylor LH. 2001. The ecology of genetically diverse infections. Science 292, 1099–1102. ( 10.1126/science.1059410) [DOI] [PubMed] [Google Scholar]
- 42.Tognazzo M, Schmid-Hempel R, Schmid-Hempel P. 2012. Probing mixed-genotype infections II: high multiplicity in natural infections of the trypanosomatid, Crithidia bombi, in its host, Bombus spp. PLoS ONE 7, e49137 ( 10.1371/journal.pone.0049137) [DOI] [PMC free article] [PubMed] [Google Scholar]
- 43.Cirimotich CMC, Dong YY, Clayton AMA, Sandiford SLS, Souza-Neto JAJ, Mulenga MM, Dimopoulos GG. 2011. Natural microbe-mediated refractoriness to Plasmodium infection in Anopheles gambiae. Science 332, 855–858. ( 10.1126/science.1201618) [DOI] [PMC free article] [PubMed] [Google Scholar]
- 44.Chambers MC, Schneider DS. 2012. Pioneering immunology: insect style. Curr. Opin. Immunol. 24, 10–14. ( 10.1016/j.coi.2011.11.003) [DOI] [PubMed] [Google Scholar]
Associated Data
This section collects any data citations, data availability statements, or supplementary materials included in this article.
Supplementary Materials
Data Availability Statement
Data have been deposited in Dryad (doi:10.5061/dryad.r02r1).