

Abstract
Chemical exchange saturation transfer (CEST) MRI holds enormous promise for imaging pH. Whereas the routine CEST-weighted MRI contrast is complex and susceptible to confounding factors such as labile proton ratio, chemical shift, bulk water relaxation and RF saturation, ratiometric CEST imaging simplifies pH determination. However, the conventional ratiometric CEST (RCEST) MRI approach is limited to CEST agents with multiple exchangeable groups. To address this limitation, RF power-based ratiometric CEST (PRCEST) imaging has been proposed that ratios CEST effects obtained under different RF power levels. Nevertheless, due to concomitant RF saturation (spillover) effect, the recently proposed PRCEST imaging is somewhat dependent on parameters including bulk water relaxation time and chemical shift. Herein we hypothesized that RF power-based ratiometric analysis of RF spillover effect-corrected inverse CEST asymmetry (PRICEST) provides enhanced pH measurement. The postulation was verified numerically, and validated experimentally using an in vitro phantom. Briefly, our study showed that the difference between MRI-determined pH (pHMRI) and electrode-measured pH being 0.12±0.13 and 0.04±0.03 for PRCEST and PRICEST imaging, respectively, and the newly proposed PRICEST imaging provides significantly more accurate pH determination than PRCEST imaging (P<0.01, Wilcoxon signed-rank test). Notably, the exchange rate shows dominantly base-catalyzed relationship with pH, independent of creatine concentration (P>0.10, Analysis of Covariance). In addition, the derived labile proton ratio linearly scales with creatine concentration (P<0.01, Pearson Regression). To summarize, PRICEST MRI provides concentration-independent pH imaging, augmenting prior quantitative CEST methods for accurate pH mapping.
Keywords: chemical exchange saturation transfer (CEST), MRI, pH, ratiometric CEST MRI, quantitative CEST (qCEST)
1. Introduction
Chemical exchange saturation transfer (CEST) MRI is sensitive to dilute CEST agents and microenvironment properties, particularly pH, and has been increasingly applied in vivo (1–9). However, the CEST effect varies with CEST agent concentration, bulk water relaxation rates and experimental conditions, limiting its pH specificity (10–16). To overcome such confounding factors, ratiometric CEST MRI has been developed for concentration-independent pH imaging (17–22). However, the routine ratiometric CEST pH imaging requires CEST agents with multiple chemically distinguishable exchangeable sites, which limits the selection of potential contrast agents. Recently, a novel means of ratiometric pH imaging has been proposed that ratios CEST effects obtained under two radio frequency (RF) power levels, which enables absolute pH mapping with CEST agents containing a single exchangeable site (23,24).
The dependence of CEST measurement on RF power can be described by two experimental factors: labeling coefficient, which quantifies the efficiency of exchangeable proton saturation, and RF spillover factor that accounts for the direct RF saturation (25–30). Because the spillover effect depends on relaxation rates, labile proton chemical shift and RF saturation power, the recently proposed RF power-based ratiometric CEST MRI analysis is still somewhat sensitive to such confounding factors. More recently, it has been shown that calculation of the inverse CEST asymmetry corrects RF spillover effect, which substantially simplifies quantitative CEST (qCEST) analysis (31,32). Herein we postulated that RF power-based ratiometric analysis of the inverse CEST asymmetry effect (PRICEST) improves pH determination. We verified the postulation with numerical simulation and further validated it using an in vitro CEST phantom with concurrent variation of pH and CEST agent concentration. Our results demonstrated that the PRICEST imaging proposed here provides concentration–independent accurate pH determination.
2. THEORY
The time-dependent CEST signal can be described by (31–34)
| (1) |
in which R1w is the intrinsic longitudinal bulk water relaxation rate (i.e. R1w=1/T1w), TS is the saturation time, and θ=atan(ω1/Δω) with ω1 and Δω being the RF irradiation amplitude and offset from the bulk water resonance, respectively. In addition, R1ρ is the bulk water longitudinal relaxation rate in the rotating frame,
| (2) |
where R2w is the bulk water transverse relaxation rate, δs is the labile proton offset and α is the labeling coefficient , in which , , kws = fr·ksw, r1w,s=R1w,s+kws,sw, r2w,s=R2w,s+kws,sw, and fr and ksw are the labile proton ratio and exchange rate, and R1s and R2s are the labile proton longitudinal and transverse relaxation rates, respectively. (35)
For the label scan (i.e., Δω=+δs), we have while for the reference scan (i.e., Δω=−δs), we have α≈0. The bulk water longitudinal relaxation rates in the rotating frame for the label ( ) and reference ( ) scans can be shown to be
| (3.a) |
| (3.b) |
The time-dependent inverse CEST asymmetry effect is given by (36)
| (4) |
For slow chemical exchange rate (i.e., ksw<<δs) and RF saturation power substantially smaller than labile proton chemical shift, we have cos2θ≈1 and . It is necessary to note that CESTRind approaches its steady state relatively quickly. For weak RF saturation, we have tanθ≈0, and the magnitude of the transient term (i.e. ) is approximately zero. On the other hand, for a relatively strong B1, we have that R1ρ is substantially higher than R1w, and the transient term quickly approaches 0 for a moderate saturation time. Therefore, the steady state CEST effect calculated from inverse CEST difference can be shown to be
| . | (5) |
The RF power-based ratiometric analysis of the inverse CEST asymmetry ratio is given as
| (6) |
where ω1a and ω1b are two different RF irradiation power levels. Notably, PRICESTR does not depend on labile proton concentration and bulk water relaxation constants (i.e., T1w and T2w), making it a concentration-independent index that is sensitive to exchange rate and hence pH. The labile proton exchange rate term can be solved from Eq. 6, being
| (7) |
If the labile proton T2s can be determined, the labile proton exchange rate can be solved as
| (8) |
Once the labile proton exchange rate is derived, the labile proton ratio can be subsequently solved, provided that the bulk water T1w can be independently determined. Specifically, we have
| (9) |
3. Results and Discussion
Fig. 1 shows simulations of exchange rate-dependent quantitative CEST analysis using Bloch-McConnell equations (25). Specifically, Fig. 1a compares the routine CESTR and the inverse CEST asymmetry (CESTRind) as a function of RF power. We assumed typical labile proton ratio of 1:1000 and two exchange rates of 50 and 100 s−1, respectively. In addition, we chose representative bulk water T1w and T2w of 2 s and 100 ms, and T1s and T2s of 1 s and 20 ms, respectively. CESTR peaks at an intermediate RF power level. This is because for CEST agents with relatively small chemical shifts, the concomitant RF spillover effect is non-negligible at high B1 levels, resulting in an optimal intermediate RF power level. In comparison, CESTRind consistently increases with B1 as it corrects for the concomitant RF spillover effects. To test RF power-based ratiometric analysis, we simulated ratiometric analysis of routine CESTR (PRCESTR) and CESTRind effects (PRICESTR), assuming typical RF power levels of 0.5 and 2 μT. Whereas PRCESTR predominantly increases with exchange rate, it shows noticeable dependence on the labile proton ratio (Fig. 1 b). This is because the coupling between highly concentrated CEST agents and bulk water pools becomes non-negligible, resulting in elevated RF spillover effects. In comparison, PRICESTR consistently increases with exchange rate with little dependence on the labile proton ratio (Fig. 1 c).
Fig. 1.
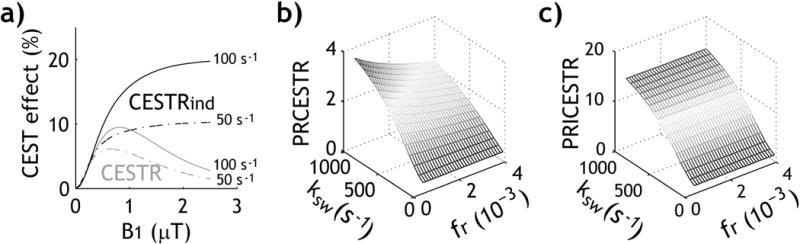
Simulation of RF power-based ratiometric qCEST analysis. a) Routine CEST asymmetry (i.e., CESTR) and the inverse CEST asymmetry (CESTRind) as a function of RF saturation power. b) RF power-based ratiometric analysis of the routine CESTR (PRCESTR) as a function of labile proton ratio and exchange rate. c) RF power-based ratiometric analysis of inverse CEST asymmetry ratio (PRICESTR) as a function of labile proton ratio and exchange rate.
Fig. 2 compares the sensitivity of two RF power-based ratiometric indices (i.e., PRCESTR and PRICESTR) to confounding factors, including T1w, T2w and chemical shift. Fig. 2a shows that PRCESTR decreases with T1w. This is because for long T1w, it takes longer for the bulk water signal to recover from the direct RF saturation, leading to reduced PRCESTR. Because the inverse CEST asymmetry calculation corrects the concomitant RF spillover effect, PRICESTR has substantially reduced T1w dependence (Fig. 2b). Fig. 2c shows that PRCESTR decreases substantially at short T2w. This is because direct RF saturation effect becomes more pronounced at short T2w, reducing the pH sensitivity of PRCESTR. In comparison, Fig. 2d shows that PRICESTR analysis is substantially less susceptible to T2w because the inverse CEST asymmetry calculation compensates RF spillover effects. Moreover, because the RF spillover effect is more severe at small labile proton chemical shift, pH-dependent PRCESTR decreases at small chemical shift (Fig. 2e). On the other hand, PRICESTR reasonably minimizes the dependence of chemical shift (Fig. 2f). As such, the proposed PRICEST approach substantially reduces the dependence of pH measurement on RF spillover effects, thereby providing accurate pH measurement in the presence of moderate variation in relaxation, chemical shift and/or field strength.
Fig. 2.

Evaluation of the specificity of ratiometric CEST analysis to exchange rate. a) PRCESTR as a function of exchange rate and T1w. b) PRICESTR as a function of exchange rate and T1w. c) PRCESTR as a function of exchange rate and T2w. d) PRICESTR as a function of exchange rate and T2w. e) PRCESTR as a function of exchange rate and labile proton chemical shift. f) PRICESTR as a function of exchange rate and labile proton chemical shift.
We experimentally verified pH-sensitive PRICESTR MRI using an in vitro CEST phantom. Fig. 3a shows PRCESTR map obtained under two B1 levels of 0.5 and 2 μT, and Fig. 3b shows the corresponding PRICESTR map. The choice of RF power levels was based on contrast to noise ratio optimization as a function of exchange rate from the RF power–based ratiometric CEST imaging (24). Although both indexes display reasonable pH sensitivity, Fig. 3a shows that PRCESTR map shows similar intensity between pH 7.1 (Vial IX) and 7.2 (vial V). In comparison, PRICESTR clearly differentiates pH over the full range (Fig. 3b). We further quantified pH accuracy from the two RF power-based ratiometric pH imaging methods. We chose five vials containing 60 mM Creatine for pH calibration (vials I–V), with pH being 6.5, 6.8, 6.9, 7.0 and 7.2. Fig. 3c shows that both PRCESTR and PRICESTR show base-catalyzed relationship with pH. We have PRCESTR =1.98*10pH-7.58 (R2=0.97, P<0.01, Pearson Regression) and PRICESTR=2.08*10pH-7.39 (R2=0.99, P<0.01, Pearson Regression). Notably, analysis of covariance test shows that PRICESTR is significantly higher than that of PRCESTR, suggesting it is advantageous for pH measurement (P<0.05, ANCOVA). Using the calibration curves established from pH vials (Fig. 3c), we calibrated pH from all vials, including those with concurrent variation of creatine concentration and pH (vials VI, VII, III, VIII and IX). Specifically, Fig. 3d shows significant correlation between pH determined from ratiometric CEST MRI (pHMRI) and titrated pH (P<0.01, Pearson Regression). The mean absolute difference between pHMRI and pH was 0.12±0.13 for PRCESTR and 0.04±0.03 for PRICESTR, respectively. Indeed, PRICEST MRI provides significantly more accurate pH determination than the PRCEST analysis (P<0.01, Wilcoxon signed-rank test).
Fig. 3.
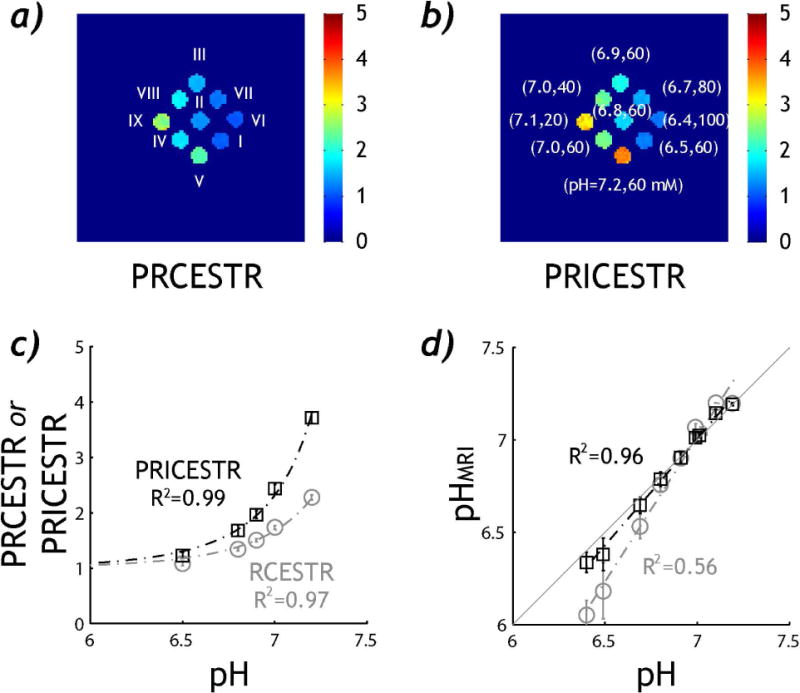
Experimental demonstration of pH-sensitive RF power-based ratiometric qCEST imaging. a) PRCESTR map of a phantom containing multiple vials with variation in both creatine concentration and pH. b) PRICESTR map. c) Dominantly base-catalyzed relationship between pH and RF power-based ratiometric CEST effects. d) pH determined from CEST imaging (pHMRI) as a function of pH-electrode measured pH.
We further demonstrated that both chemical exchange rate and labile proton ratio can be derived from the proposed PRICEST imaging. T1w map was homogeneous while T2w map varied for vials without a consistent trend due to simultaneous variation in Creatine content and pH. T1w and T2w were found to be 2.04±0.02 s and 1.28±0.21 s from all vials, respectively. Fig. 4a shows chemical exchange rate map calculated using Eq. 8. We assumed a typical T2s of 20 ms and used the experimentally measured T1w map. Fig. 4b shows that pH-dependent exchange rate (squares, [Cr]=60 mM) can be described by a dominantly base-catalyzed exchange relationship (ksw=2.40*10pH-5.25, P<0.01, Pearson Regression). Importantly, there was no significant difference in pH-exchange rate relationship between concentration and pH vials (P>0.10, ANCOVA). This confirms that pH can be determined independent of the CEST agent concentration. In addition, the labile proton ratio map was derived from Eq. 8 and averaged from the two RF power levels (i.e., 0.5 and 2 μT). Notably, Fig. 4c shows similar intensity for all vials with Creatine concentration of 60 mM, despite their pH difference (i.e., vials I-V). In addition, labile proton concentration consistently increases with creatine concentration (i.e. vials VI, VII, III, VIII and IX), despite differences in both pH and creatine concentration. Fig. 4d shows that labile proton ratio linearly scales with creatine concentration (fr=−2.1*10−4+4.0*10−5*[Cr], P<0.01, Pearson Correlation), where [Cr] is creatine concentration in mM. It is important to point out that with correction of the projection term (i.e., cos2θ), the exchangeable proton per creatine molecule is consistent with findings of Goerke et al. (37). Both pH (Fig. 5a) and creatine concentration (Fig. 5b) maps can be derived from the analysis, which clearly depict pH and CEST agent content in the phantom. Although Fig. 5b shows the mean creatine content map from two RF power levels (i.e. 0.5 and 2 μT), the creatine content maps from two RF powers are in good agreement within 1–2 mM (data not shown).
Fig. 4.
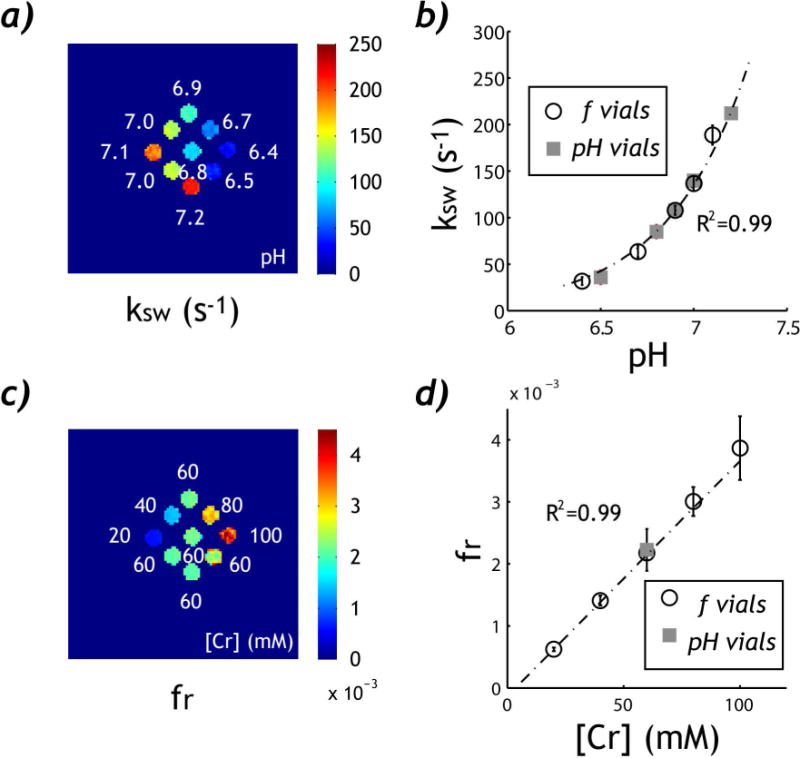
Quantitative analysis of pH-sensitive PRICEST imaging. a) Chemical exchange rate map as a function of pH. b) Dominantly base-catalyzed relationship between the derived chemical exchange rate and pH. c) Labile proton ratio map as a function of creatine concentration. d) Linear regression test between the derived labile proton ratio and creatine concentration.
Fig. 5.

Quantitative CEST imaging. a) pHMRI map. b) Creatine content map.
Herein we denoted the RF power-based ratiometric analysis of routine CEST effects as PRCEST and RF power-based ratiometric analysis of inverse CEST asymmetries using PRICEST imaging, to differentiate them from the conventional ratiometric CEST analysis of multiple exchangeable sites (i.e. RCEST). Our study here demonstrated that the RF power-based ratiometric analysis of the spillover-corrected CEST effect provides accurate pH determination. Because PRICEST MRI is independent of bulk water relaxation (i.e., T1w and T2w) and labile proton chemical shift, it improves pH accuracy over the recently proposed PRCEST imaging approach. This is advantageous for cases where it is challenging to measure the intrinsic bulk water relaxation, enabling pH mapping with minimal a priori information. Because PRICESTR only depends on pH-dependent exchange rate, R2s and RF power levels, it provides good sensitivity to the exchange rate term ksw*(ksw+R2s) with high specificity. We further evaluated the sensitivity of the PRICEST solution to T2s, RF inhomogeneity and saturation time (Fig. 6). Specifically, CEST effect was simulated for T2s between 15 and 25 ms using Bloch-McConnell equations, and ksw was derived using PRICEST analysis (Eqs. 8 and 9), assuming a mean T2s of 20 ms. The normalized exchange rate was found to be 1.06±0.04, with a coefficient of variance (COV) of 3% (Fig. 6a). Fig. 6b shows that the normalized exchange rate linearly scales with B1 field. Although not desired, this shows that the B1 inhomogeneity can be corrected relatively straightforward based on the RF field map. Moreover, Fig. 6c shows that the normalized exchange rate quickly approaches its steady state solution (within 5%) for saturation time above 2.5 times of bulk water longitudinal relaxation time, consistent with the derivation. Because fr scales with R1w (Eq. 9), it is necessary to map T1w for accurate determination of labile proton ratio. Fortunately, T1w is less susceptible to CEST agent concentration and exchange rate than T2w (38), and PRICEST MRI substantially simplifies post-processing for quantitative CEST analysis as there is minimal residual spillover effect that needs to be taken into account (32,36,39). On the other hand, for the case of negligible concomitant RF spillover effect, PRICEST imaging should be similar to the recently proposed simplistic PRCEST MRI approach (23,24).
Fig. 6.
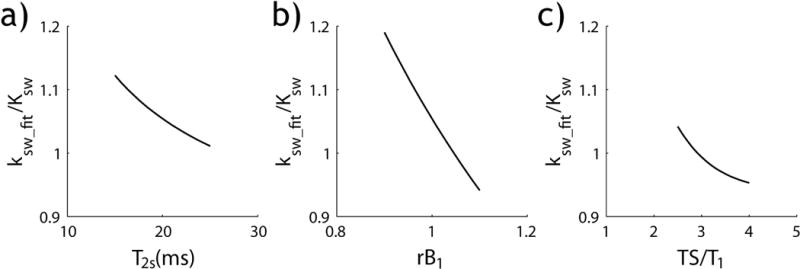
Evaluation of the accuracy of exchange rate determination from the PRICEST analysis. a) The normalized exchange rate as a function of T2s. b) The normalized exchange rate as a function of B1 inhomogeneity. c) The normalized exchange rate as a function of saturation time (TS).
Our work here used a relatively simple binary Bloch-McConnell exchange model for simulation and demonstrated PRICEST pH imaging in vitro. Although complex CEST systems may have multiple exchangeable sites, and in vivo systems are susceptible to semisolid macromolecular magnetization transfer (MT) and nuclear overhauser effects (NOE), such confounding factors can be minimized with numerical decoupling (40–42). Particularly, for weak and moderate RF power levels, the proposed approach should apply if the concomitant MT and CEST effects have negligible coupling, and hence MT contribution can be resolved and corrected for. Indeed, development of more advanced post-processing routines is crucial for generalizing the ratiometric pH MRI for quantifying in vivo CEST measurements so that both microenvironmental changes and multiple in vivo compounds can be quantified in pathologies such as dominant pH alteration in renal injury and acute stroke (6,22,23), and concurrent pH and protein level/content change in tumor can be characterized (43,44). Because PRICEST pH determination is independent of labile proton concentration and bulk water relaxation rates, it holds tremendous promise for imaging pH in relatively complex systems.
4. Conclusions
Our study here demonstrated that RF power-based ratiometric analysis of spillover-corrected inverse CEST asymmetry provides concentration-independent pH determination with an accuracy under 0.05 pH unit. Both exchange rate and labile proton ratio can be derived from the quantitative PRICEST analysis. The modified ratiometric analysis enables simplified quantification of the underlying in vitro CEST system, augmenting qCEST MRI.
5. Experimental
Phantom
A CEST phantom was prepared with creatine phosphate buffer solution (PBS, Sigma Aldrich, St Louis, MO), doped with 30 μM gadolinium. Nine solution tubes were prepared, including five tubes whose pH was titrated to 6.5 (vial I), 6.8 (vial II), 6.9 (vial III), 7.0 (vial IV) and 7.2 (vial V) at a fixed Creatine concentration of 60 mM, and another four tubes with simultaneous pH and Creatine concentration variation. Specifically, their pH was varied from 6.4 (vial VI), 6.7 (vial VII), 7.0 (vial VIII), and 7.1 (vial IX) while their creatine concentration was serially diluted from 100, 80, 40 and 20 mM. Note that the vial III (60 mM creatine, pH=6.9) is shared for pH and concentration vial series. Altogether, we have five different pH vials of the same creatine concentration, and five vials with current pH and concentration variation. The solution was then transferred into NMR tubes and inserted into a phantom container filled with 1% agarose solution.
MRI
All images were obtained from a 4.7 Tesla MRI scanner under the room temperature of about 20 ºC (Bruker Biospec, Billerica, MA). The volume coil that has a very good RF profile for the phantom study, with B1 inhomogeneity within 5% (45). We chose a slice thickness of 10 mm, field of view (FOV) of 50 × 50 mm and imaging matrix of 96 × 96. We used single-shot echo planar imaging (EPI), acquisition bandwidth of 200 kHz. We acquired 3-point CEST imaging with continuous wave (CW) RF irradiation applied at ±1.875 ppm (± 375 Hz at 4.7 Tesla), in addition to a control scan without RF irradiation (repetition time (TR)/echo time (TE)=15,000/47 ms, time of saturation (TS) =5,000 ms, number of average (NSA)=2). Two RF power levels were chosen, 0.5 and 2 μT (24). In addition, T1-weighted MRI was acquired using an inversion recovery sequence with eight inversion intervals (TI) from 250 to 7,500 ms (recovery time/TE =10,000/28 ms, NSA=2) and T2-weighted MRI was acquired using standard spin echo MRI with echo time ranging from 50 to 500 ms. The B0 map was obtained by acquiring four asymmetrical spin echo (ASE) phase images with off-centered echo time being 1, 3, 5 and 7 ms (TR/TE=12,000/36 ms, NSA=2).
Data Processing
All images were processed in Matlab (Matheworks, Natick, MA). The T1 map was obtained by least-squares fitting of the signal intensities as a function of its inversion time, and T2 map was derived by fitting the signal intensity as a function of the echo time. B0 map was derived by fitting the phase map (φ) against the off-centered echo time (Δτ) using , where γ is the gyromagnetic ratio. The magnetic field homogeneity was very good, with ΔB0 being −0.3 ± 1.3 Hz. Because of satisfactory B0 and B1 homogeneity profiles, no field inhomogeneity correction is necessary in our study. CEST effects were calculated using both the standard CEST ratio ( ) and the inverse CEST asymmetry analysis ( ), where Iref and Ilabel are the reference and label scans, respectively, and I0 is the control scan without RF irradiation. Statistics was analyzed using data analysis and statistical software (STATA, College Station, Texas). Results were reported as mean ± standard deviation, and P values less than 0.05 were considered statistically significant.
Acknowledgments
This study was supported in part by grants from National Institute of Health/National Institute of Neurological Disorders and Stroke R01NS083654 (Sun), Natural Science Foundation of Guangdong S2013010013372 (Xiao), and National Natural Science Foundation of China 81471721 (Guo) and 81471730 (Wu).
References
- 1.Ward KM, Aletras AH, Balaban RS. A new class of contrast agents for MRI based on proton chemical exchange dependent saturation transfer (CEST) J Magn Reson. 2000;143:79–87. doi: 10.1006/jmre.1999.1956. [DOI] [PubMed] [Google Scholar]
- 2.Aime S, Barge A, Delli Castelli D, Fedeli F, Mortillaro A, Nielsen FU, Terreno E. Paramagnetic Lanthanide(III) complexes as pH-sensitive chemical exchange saturation transfer (CEST) contrast agents for MRI applications. Magn Reson Med. 2002;47:639–648. doi: 10.1002/mrm.10106. [DOI] [PubMed] [Google Scholar]
- 3.Zhang S, Malloy CR, Sherry AD. MRI Thermometry Based on PARACEST Agents. J Am Chem Soc. 2005;127(50):17572–17573. doi: 10.1021/ja053799t. [DOI] [PMC free article] [PubMed] [Google Scholar]
- 4.Sun PZ, Sorensen AG. Imaging pH using the chemical exchange saturation transfer (CEST) MRI: correction of concomitant RF irradiation effects to quantify CEST MRI for chemical exchange rate and pH. Magn Reson Med. 2008;60(2):390–397. doi: 10.1002/mrm.21653. [DOI] [PubMed] [Google Scholar]
- 5.Olatunde AO, Dorazio SJ, Spernyak JA, Morrow JR. The NiCEST Approach: Nickel(II) ParaCEST MRI Contrast Agents. J Am Chem Soc. 2012;134(45):18503–18505. doi: 10.1021/ja307909x. [DOI] [PubMed] [Google Scholar]
- 6.Sun PZ, Wang E, Cheung JS. Imaging acute ischemic tissue acidosis with pH-sensitive endogenous amide proton transfer (APT) MRI – Correction of tissue relaxation and concomitant RF irradiation effects toward mapping quantitative cerebral tissue pH. Neuroimage. 2012;60(1):1–6. doi: 10.1016/j.neuroimage.2011.11.091. [DOI] [PMC free article] [PubMed] [Google Scholar]
- 7.Dula AN, Asche EM, Landman BA, Welch EB, Pawate S, Sriram S, Gore JC, Smith SA. Development of chemical exchange saturation transfer at 7T. Magn Reson Med. 2012;66(3):831–838. doi: 10.1002/mrm.22862. [DOI] [PMC free article] [PubMed] [Google Scholar]
- 8.Vinogradov E, Sherry AD, Lenkinski RE. CEST: From basic principles to applications, challenges and opportunities. J Magn Reson. 2013;229(0):155–172. doi: 10.1016/j.jmr.2012.11.024. [DOI] [PMC free article] [PubMed] [Google Scholar]
- 9.Castelli DD, Terreno E, Longo D, Aime S. Nanoparticle-based chemical exchange saturation transfer (CEST) agents. NMR Biomed. 2013;26(7):839–849. doi: 10.1002/nbm.2974. [DOI] [PubMed] [Google Scholar]
- 10.Sun PZ, van Zijl PCM, Zhou J. Optimization of the irradiation power in chemical exchange dependent saturation transfer experiments. J Magn Reson. 2005;175(2):193–200. doi: 10.1016/j.jmr.2005.04.005. [DOI] [PubMed] [Google Scholar]
- 11.Wu R, Liu C, Liu P, Sun PZ. Improved measurement of labile proton concentration-weighted chemical exchange rate (kws) with experimental factor-compensated and T1-normalized quantitative chemical exchange saturation transfer (CEST) MRI. Contrast Media Mol Imaging. 2012;7(4):384–389. doi: 10.1002/cmmi.505. [DOI] [PMC free article] [PubMed] [Google Scholar]
- 12.Sun PZ. Simplified quantification of labile proton concentration-weighted chemical exchange rate (kws) with RF saturation time dependent ratiometric analysis (QUESTRA): Normalization of relaxation and RF irradiation spillover effects for improved quantitative chemical exchange saturation transfer (CEST) MRI. Magn Reson Med. 2012;67(4):936–942. doi: 10.1002/mrm.23068. [DOI] [PMC free article] [PubMed] [Google Scholar]
- 13.Zaiss M, Bachert P. Exchange-dependent relaxation in the rotating frame for slow and intermediate exchange – modeling off-resonant spin-lock and chemical exchange saturation transfer. NMR Biomed. 2013;26(5):507–518. doi: 10.1002/nbm.2887. [DOI] [PubMed] [Google Scholar]
- 14.Sun PZ. Simultaneous determination of labile proton concentration and exchange rate utilizing optimal RF power: radio frequency power (RFP) dependence of chemical exchange saturation transfer (CEST) MRI. J Magn Reson. 2010;202(2):155–161. doi: 10.1016/j.jmr.2009.10.012. [DOI] [PMC free article] [PubMed] [Google Scholar]
- 15.Zu Z, Janve VA, Li K, Does MD, Gore JC, Gochberg DF. Multi-angle ratiometric approach to measure chemical exchange in amide proton transfer imaging. Magn Reson Med. 2012;68(3):711–719. doi: 10.1002/mrm.23276. [DOI] [PMC free article] [PubMed] [Google Scholar]
- 16.Sun PZ, Wang Y, Xiao G, Wu R. Simultaneous experimental determination of labile proton fraction ratio and exchange rate with irradiation radio frequency power-dependent quantitative CEST MRI analysis. Contrast Media Mol Imaging. 2013;8(3):246–251. doi: 10.1002/cmmi.1524. [DOI] [PMC free article] [PubMed] [Google Scholar]
- 17.Ward KM, Balaban RS. Determination of pH using water protons and chemical exchange dependent saturation transfer (CEST) Magn Reson Med. 2000;44(5):799–802. doi: 10.1002/1522-2594(200011)44:5<799::aid-mrm18>3.0.co;2-s. [DOI] [PubMed] [Google Scholar]
- 18.Ali MM, Liu G, Shah T, Flask CA, Pagel MD. Using Two Chemical Exchange Saturation Transfer Magnetic Resonance Imaging Contrast Agents for Molecular Imaging Studies. Acc Chem Res. 2009;42(7):915–924. doi: 10.1021/ar8002738. [DOI] [PMC free article] [PubMed] [Google Scholar]
- 19.Liu G, Li Y, Sheth VR, Pagel MD. Imaging In Vivo Extracellular pH with a Single Paramagnetic Chemical Exchange Saturation Transfer Magnetic Resonance Imaging Contrast Agent. Molecular Imaging. 2012;11(1):47–57. [PMC free article] [PubMed] [Google Scholar]
- 20.Longo DL, Busato A, Lanzardo S, Antico F, Aime S. Imaging the pH evolution of an acute kidney injury model by means of iopamidol, a MRI-CEST pH-responsive contrast agent. Magn Reson Med. 2012;70(3):859–864. doi: 10.1002/mrm.24513. [DOI] [PubMed] [Google Scholar]
- 21.Longo DL, Dastrù W, Digilio G, Keupp J, Langereis S, Lanzardo S, Prestigio S, Steinbach O, Terreno E, Uggeri F, Aime S. Iopamidol as a responsive MRI-chemical exchange saturation transfer contrast agent for pH mapping of kidneys: In vivo studies in mice at 7 T. Magn Reson Med. 2011;65(1):202–211. doi: 10.1002/mrm.22608. [DOI] [PubMed] [Google Scholar]
- 22.McVicar N, Li AX, Goncalves DF, Bellyou M, Meakin SO, Prado MAM, Bartha R. Quantitative tissue pH measurement during cerebral ischemia using amine and amide concentration-independent detection (AACID) with MRI. J Cereb Blood Flow Metab. 2014;34(4):690–698. doi: 10.1038/jcbfm.2014.12. [DOI] [PMC free article] [PubMed] [Google Scholar]
- 23.Longo DL, Sun PZ, Consolino L, Michelotti FC, Uggeri F, Aime S. A General MRI-CEST Ratiometric Approach for pH Imaging: Demonstration of in Vivo pH Mapping with Iobitridol. J Am Chem Soc. 2014;136(41):14333–14336. doi: 10.1021/ja5059313. [DOI] [PMC free article] [PubMed] [Google Scholar]
- 24.Wu R, Longo DL, Aime S, Sun PZ. Quantitative description of radiofrequency (RF) power-based ratiometric chemical exchange saturation transfer (CEST) pH imaging. NMR in Biomed. 2015;28(5):555–565. doi: 10.1002/nbm.3284. [DOI] [PMC free article] [PubMed] [Google Scholar]
- 25.Woessner DE, Zhang S, Merritt ME, Sherry AD. Numerical solution of the Bloch equations provides insights into the optimum design of PARACEST agents for MRI. Magn Reson Med. 2005;53(4):790–799. doi: 10.1002/mrm.20408. [DOI] [PubMed] [Google Scholar]
- 26.McMahon M, Gilad A, Zhou J, Sun PZ, Bulte J, van Zijl PC. Quantifying exchange rates in chemical exchange saturation transfer agents using the saturation time and saturation power dependencies of the magnetization transfer effect on the magnetic resonance imaging signal (QUEST and QUESP): Ph calibration for poly-L-lysine and a starburst dendrimer. Magn Reson Med. 2006;55(4):836–847. doi: 10.1002/mrm.20818. [DOI] [PMC free article] [PubMed] [Google Scholar]
- 27.Sun PZ, Zhou J, Huang J, van Zijl P. Simplified quantitative description of amide proton transfer (APT) imaging during acute ischemia. Magn Reson Med. 2007;57(2):405–410. doi: 10.1002/mrm.21151. [DOI] [PubMed] [Google Scholar]
- 28.Li AX, Hudson RHE, Barrett JW, Johns CK, Pasternak SH, Bartha R. Four-pool modeling of proton exchange processes in biological systems in the presence of MRI-paramagnetic chemical exchange saturation transfer (PARACEST) agents. Magn Reson Med. 2008;60(5):1197–1206. doi: 10.1002/mrm.21752. [DOI] [PubMed] [Google Scholar]
- 29.Murase K, Tanki N. Numerical solutions to the time-dependent Bloch equations revisited. Magn Reson Imaging. 2011;29(1):126–131. doi: 10.1016/j.mri.2010.07.003. [DOI] [PubMed] [Google Scholar]
- 30.Sun PZ. Simplified and scalable numerical solution for describing multi-pool chemical exchange saturation transfer (CEST) MRI contrast. J Magn Reson. 2010;205(2):235–241. doi: 10.1016/j.jmr.2010.05.004. [DOI] [PMC free article] [PubMed] [Google Scholar]
- 31.Zaiss M, Xu J, Goerke S, Khan IS, Singer RJ, Gore JC, Gochberg DF, Bachert P. Inverse Z-spectrum analysis for spillover-, MT-, and T1-corrected steady-state pulsed CEST-MRI – application to pH-weighted MRI of acute stroke. NMR Biomed. 2014;27(3):240–252. doi: 10.1002/nbm.3054. [DOI] [PMC free article] [PubMed] [Google Scholar]
- 32.Sun PZ, Wang Y, Dai Z, Xiao G, Wu R. Quantitative chemical exchange saturation transfer (qCEST) MRI - RF spillover effect-corrected omega plot for simultaneous determination of labile proton fraction ratio and exchange rate. Contrast Media Mol Imaging. 2014;9(4):268–275. doi: 10.1002/cmmi.1569. [DOI] [PMC free article] [PubMed] [Google Scholar]
- 33.Jin T, Autio J, Obata T, Kim S-G. Spin-locking versus chemical exchange saturation transfer MRI for investigating chemical exchange process between water and labile metabolite protons. Magn Reson Med. 2011;65(5):1448–1460. doi: 10.1002/mrm.22721. [DOI] [PMC free article] [PubMed] [Google Scholar]
- 34.Jin T, Kim S-G. Advantages of chemical exchange-sensitive spin-lock (CESL) over chemical exchange saturation transfer (CEST) for hydroxyl– and amine–water proton exchange studies. NMR Biomed. 2014;27(11):1313–1324. doi: 10.1002/nbm.3191. [DOI] [PMC free article] [PubMed] [Google Scholar]
- 35.Zhou J, Wilson DA, Sun PZ, Klaus JA, van Zijl PCM. Quantitative description of proton exchange processes between water and endogenous and exogenous agents for WEX, CEST, and APT experiments. Magn Reson Med. 2004;51(5):945–952. doi: 10.1002/mrm.20048. [DOI] [PubMed] [Google Scholar]
- 36.Wu R, Xiao G, Zhou IY, Ran C, Sun PZ. Quantitative chemical exchange saturation transfer (qCEST) MRI – omega plot analysis of RF-spillover-corrected inverse CEST ratio asymmetry for simultaneous determination of labile proton ratio and exchange rate. NMR in Biomed. 2015;28(3):376–383. doi: 10.1002/nbm.3257. [DOI] [PMC free article] [PubMed] [Google Scholar]
- 37.Goerke S, Zaiss M, Bachert P. Characterization of creatine guanidinium proton exchange by water-exchange (WEX) spectroscopy for absolute-pH CEST imaging in vitro. NMR Biomed. 2014;27(5):507–518. doi: 10.1002/nbm.3086. [DOI] [PubMed] [Google Scholar]
- 38.Aime S, Calabi L, Biondi L, Miranda MD, Ghelli S, Paleari L, Rebaudengo C, Terreno E. Iopamidol: Exploring the potential use of a well-established x-ray contrast agent for MRI. Magn Reson Med. 2005;53(4):830–834. doi: 10.1002/mrm.20441. [DOI] [PubMed] [Google Scholar]
- 39.Dixon TW, Ren J, Lubag A, Ratnakar J, Vinogradov E, Hancu I, Lenkinski RE, Sherry AD. A concentration-independent method to measure exchange rates in PARACEST agents. Magn Reson Med. 2010;63(3):625–632. doi: 10.1002/mrm.22242. [DOI] [PMC free article] [PubMed] [Google Scholar]
- 40.Zaiss M, Schmitt B, Bachert P. Quantitative separation of CEST effect from magnetization transfer and spillover effects by Lorentzian-line-fit analysis of z-spectra. J Magn Reson. 2011;211(2):149–155. doi: 10.1016/j.jmr.2011.05.001. [DOI] [PubMed] [Google Scholar]
- 41.Shah T, Lu L, Dell KM, Pagel MD, Griswold MA, Flask CA. CEST-FISP: A novel technique for rapid chemical exchange saturation transfer MRI at 7 T. Magn Reson Med. 2011;65(2):432–437. doi: 10.1002/mrm.22637. [DOI] [PMC free article] [PubMed] [Google Scholar]
- 42.Jones CK, Polders D, Hua J, Zhu H, Hoogduin HJ, Zhou J, Luijten P, van Zijl PCM. In vivo three-dimensional whole-brain pulsed steady-state chemical exchange saturation transfer at 7 T. Magn Reson Med. 2012;67(6):1579–1589. doi: 10.1002/mrm.23141. [DOI] [PMC free article] [PubMed] [Google Scholar]
- 43.Zhou J, Tryggestad E, Wen Z, Lal B, Zhou T, Grossman R, Wang S, Yan K, Fu D-X, Ford E, Tyler B, Blakeley J, Laterra J, van Zijl PCM. Differentiation between glioma and radiation necrosis using molecular magnetic resonance imaging of endogenous proteins and peptides. Nat Med. 2011;17(1):130–134. doi: 10.1038/nm.2268. [DOI] [PMC free article] [PubMed] [Google Scholar]
- 44.Xu J, Zaiss M, Zu Z, Li H, Xie J, Gochberg DF, Bachert P, Gore JC. On the origins of chemical exchange saturation transfer (CEST) contrast in tumors at 9.4 T. NMR Biomed. 2014;27(4):406–416. doi: 10.1002/nbm.3075. [DOI] [PMC free article] [PubMed] [Google Scholar]
- 45.Sun PZ, Farrar CT, Sorensen AG. Correction for artifacts induced by B0 and B1 field inhomogeneities in pH-sensitive chemical exchange saturation transfer (CEST) imaging. Magn Reson Med. 2007;58(6):1207–1215. doi: 10.1002/mrm.21398. [DOI] [PubMed] [Google Scholar]