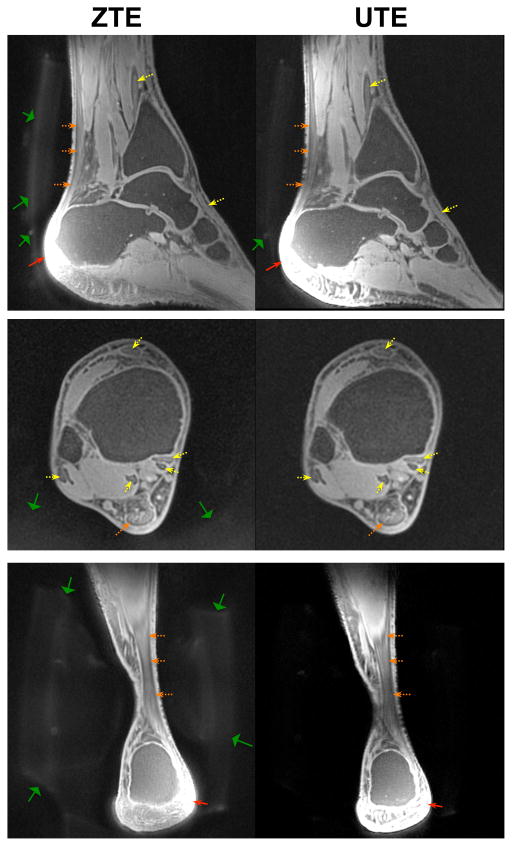
Figure 4.
In vivo ankle imaging results in a healthy volunteer at 0.7 mm isotropic resolution with fat-suppression pulses. UTE and ZTE demonstrated similar contrast for ultrashort-T2 components in tendons (dashed yellow arrows). In particular, both showed a fascicular structure in the Achilles tendon (dashed orange arrows). ZTE showed increased signal from foam padding (wide green arrows). Some failure of the fat suppression pulses was observed, particularly in the heel (thin red arrows).

