Abstract
We have developed a technology for continuous tear glucose monitoring, and therefore potentially blood glucose monitoring, using a daily use, disposable contact lens embedded with sugar-sensing boronic acid containing fluorophores. The novelty of our approach is two fold. Firstly, the notion of sensing extremely low glucose concentrations in tears by our approach, and secondly, the unique compatibility of our new probes with the internal environment of the disposable, off-the-shelf, contact lenses, chosen because the physiological compatibility of disposable plastic contact lenses has already been assessed and optimized with regard to vision correction, size and oxygen / analyte permeability. Our findings show that our approach is indeed suitable for the continuous monitoring of tear glucose levels in the concentration range (50–500 µM), which track blood glucose levels which are ≈ 5–10 fold higher. We believe our approach offers unique opportunities for non-invasive continuous glucose monitoring for diabetics, especially since many have eye disorders and require vision correction by either contact lenses or glasses, which is thought to be due to glycation of protein in blood vessels.
1.0 Introduction
Continuous monitoring of blood glucose is essential to avoid the long-term consequences of elevated blood glucose, including neuropathies, blindness and sequella.1,2 These adverse health effects have resulted in worldwide efforts to develop non- or minimally-invasive methods to monitor blood glucose.3–13 A wide variety of methods have been proposed, including near infrared spectroscopy,3,4 optical rotation,5,6 colorimetric7,8 and fluorescence detection.9–13 The most commonly used technology for blood glucose determination is an enzyme based method, which requires frequent blood sampling and therefore drawing. Although frequent “finger pricking” with a small needle to obtain the blood sample is a relatively painless process, this method does suffer from a few practical problems. The first one is inconvenience and the required compliance by patients, which is often difficult for both the young and old, while the second is that this is not a continuous monitoring method. Despite intensive efforts, no method is presently available for the continuous non-invasive measurement of blood glucose.
Elevated tear glucose during hyperglycemia was first demonstrated by Michail and co-workers in 1937,14,15 as tear glucose levels track blood levels, in an analogous manner to the equilibrium that normally exists for glucose between blood and tissue fluid.16 While it has been difficult to determine actual glucose concentrations in tears to-date, it is generally accepted that glucose levels are low and in the range 50–500 µM.17–21 For example, Giardini and Roberts have reported tear glucose concentrations to be ≈ 3 mg 100 ml−1 for subjects with a normal glucose metabolism,22 while Colon and co-workers have similarly reported normal tear glucose levels 130 ± 20 µM.19–21
As with any sensors, there are several issues that have to be addressed. The first is to identify suitable transduction elements, which in the presence of glucose, can report / produce suitable signals. The second is the design of the matrix to incorporate the transduction elements. For this, we have chosen an off-the-shelf disposable plastic contact lens, primarily because its physiological compatibility has already been assessed, and finally, the optimization of the sensor, with regard to sensitivity, response time, reversibility and shelf-life etc. The first and last issues will be discussed throughout much of this paper. For the identification of suitable transduction elements, boronic acid has been known to have high affinity for diol-containing compounds such as carbohydrates,23–25 where the strong complexation has been used for the construction of carbohydrate sensors,26–28 transporters29 and chromatographic materials.30 Naturally, boronic acid compounds have been used for the synthesis of glucose sensors,31–37 where we note the work of Shinkai,31,32 Norrild33 and Lakowicz,34–37 to name but just a few.
In our initial feasibility studies of a glucose sensing contact lens we screened many commonly available Boronic Acid containing Fluorophores (BAFs) within a contact lens.38 Our findings have revealed that published boronic acid containing fluorophores do not respond well from within the lenses. This we have attributed to the low internal and unbufferable lens pH (5.5 → 6.5) and a polarity of the lens similar to methanol,38 whereas most BAFs have been designed to respond at physiological blood pH, i.e. pH 7.2, with sugar bound pKa’s typically > 7. This results in a substantial lack of glucose sensitivity at the lens pH and therefore their inability to determine tear glucose.
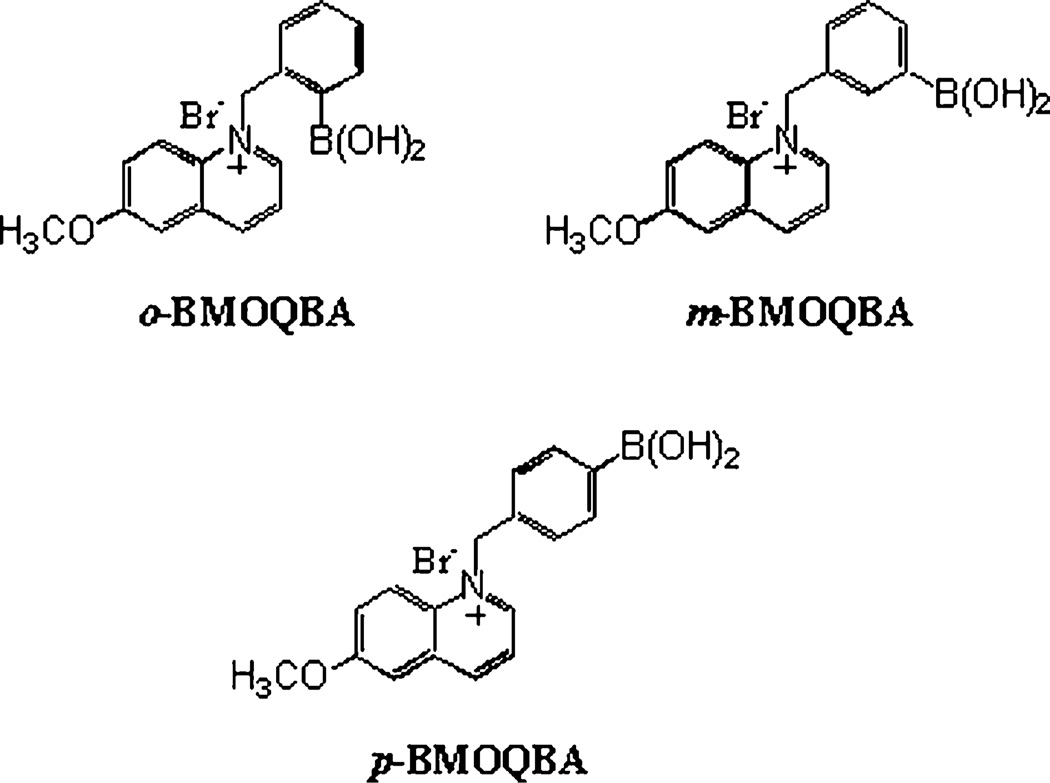
Subsequently, with a detailed understanding of internal contact lens pH and polarity38 we have designed, synthesized and developed a new range of BAFs, Fig. 1,39 that have in comparison, significantly reduced sugar-bound pKa’s, Table 1, affording for both a solution and contact lens glucose response at tear glucose levels. In addition, our new probes are readily water soluble, can be produced by a one-step synthesis, have high fluorescence quantum yields and can be readily excited with cheap UV LED or blue laser diodes.39
Fig. 1.
Molecular structure of ortho, meta and para-BMOQBA probes. BMOQBA: N-(boronobenzyl)-6-methoxyquinolinium bromide
Table 1.
pKa values for the BMOQBA probes
| Medium | o-BMOQBA | m-BMOQBA | p-BMOQBA |
|---|---|---|---|
| Buffera | 7.90 | 7.70 | 7.90 |
| +100 mM Glucose | 6.62 | 6.90 | 6.90 |
| +100 mM Fructose | 4.80 | 5.00 | 5.45 |
pH 3 and 4 acetate buffer, pH 5 to 9 phosphate buffer and 9 and 10 carbonate buffer.
In this paper we therefore employ the notion of elevated tear glucose during hyperglycemia to produce a glucose sensing contact lens. Our approach has several key advantages over current glucose monitoring methods. Firstly, it provides for both a continuous and reversible glucose monitoring to the wearer, with a time to reach equilibrium of about 15 min. Secondly, the technology is built into existing lenses that can be purchased in a local pharmacy, reducing future manufacturing and redesign costs. Thirdly, it is a non-invasive and disposable technology, and finally, a variety of fluorescence sensing methodologies can be employed here with the lens to ascertain glucose concentrations, such as intensity, lifetime, modulation and polarization based sensing.40,41
2 Experimental
2.1 Materials and lens doping
All chemicals were purchased from Sigma. The preparation of ortho, meta and para-BMOQBA has been reported elsewhere by us.39
The contact lenses were supplied by CIBA Vision, Atlanta, USA (part of their daily disposable contact lens range) and were washed in 500 ml water, 20 °C for 24 h before post-doping. The contact lens is a polyvinyl alcohol type photocured polymer which swells slightly in water. Its hydrophilic character readily allows for the diffusion of the aqueous analytes in tears.
Doping was undertaken by incubating the lenses in a high concentration of the respective BAFs solution for 24 h before being rinsed in Millipore water. Doped lenses were then allowed to leach probe for 1 h into a large volume. Leaching was typically complete after 15–30 min, evident by no further change (loss) in lens fluorescence intensity (see later).
2.2 Methods
All solution fluorescence measurements were undertaken in 4 × 1 × 1 cm fluorimetric plastic cuvettes, using a Varian Cary Eclipse fluorimeter.
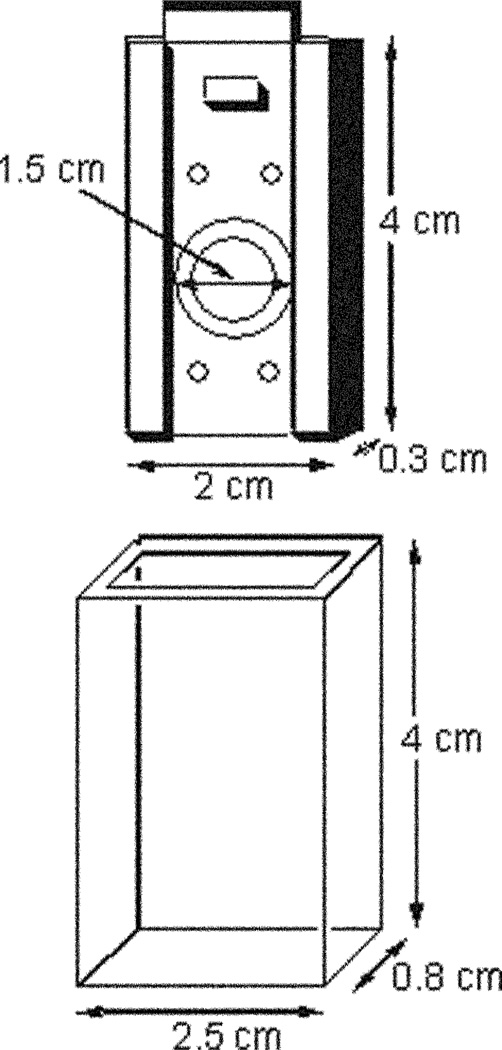
Doped contact lenses were mounted in a simple lens holder, Fig. 2, which was itself inserted into a quartz holder for fluorescence sensing measurements. The quartz lens holder has dimensions of 4 × 2.5 × 0.8 cm, all 4 sides being of optical quality. The contact lens is mounted onto a stainless steel mount of dimensions 4 × 2 × 0.3 cm which fits tightly within the quartz outer holder. A circular hole in the center of the mount with a 1.5 cm id, has a raised quartz lip, which enables the lens to be mounted. The mount and holder readily allow for ≈ 1.5 cm3 of solution to be in contact with the front and back sides of the lens for the sugar sensing (ocular like) experiments, Fig. 2.
Fig. 2.
Contact lens mount and quartz holder.
Excitation and emission was performed using a Varian Cary Eclipse Fluorimeter, where the concave edge of the lens faced 45° towards the excitation source, the fluorescence signal observed from the back convex edge of the lens. This reduced any scattering of the excitation light. We additionally tested the lens in the reverse optical geometry and found identical results.
2.3 Data analysis
Titration curves against pH were determined in buffer solution: pH 3 and 4 acetate buffer; pH 5 to 9 phosphate buffer and pH 10 and 11 carbonate buffer. Titration curves were fitted and pKa (pKa = −Log10 Ka) values were obtained using the relation:
| (1) |
where Iacid and Ibase are the intensity limits in the acid and base regions respectively.
Stability (KS) and dissociation (KD) constants were obtained by fitting the titration curves of probe or doped lens, with sugar, using the relation:
| (2) |
where Imin and Imax are the initial (no sugar) and final (plateau) fluorescence intensities of the titration curves, where KD = (1/KS).
3.0 Results and discussion
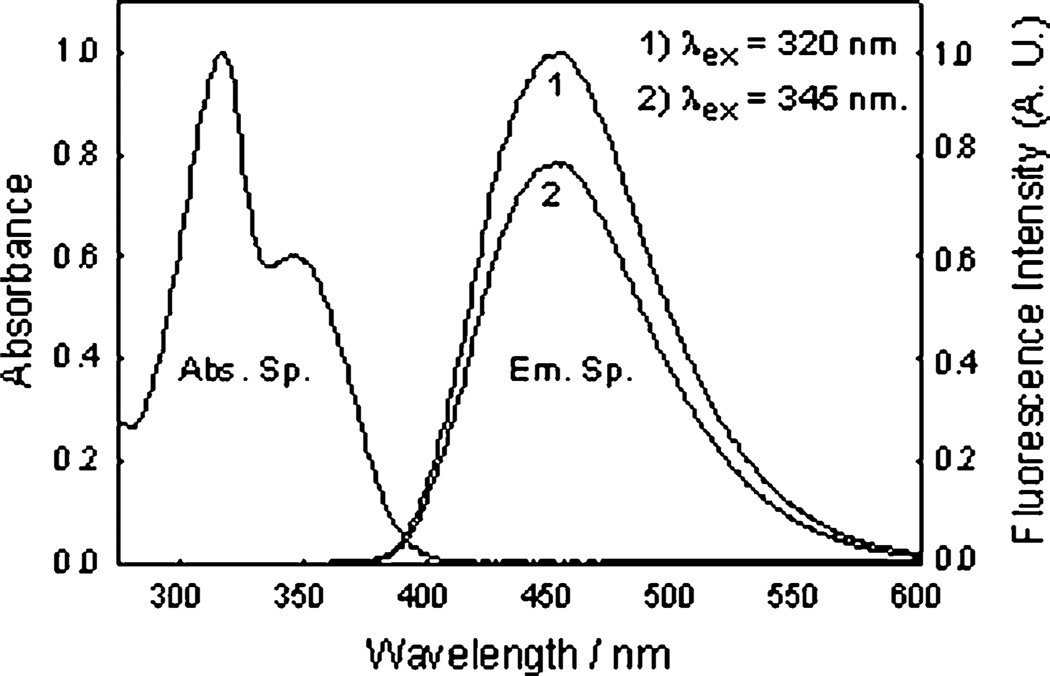
The new monosaccharide-sensing probes are based on the quaternization of the 6-methoxyquinolinium nucleus with ortho, meta and para phenyl boronic acid.39 The resultant probes are highly water soluble with a moderately high quantum yield, unlike the 6-methoxyquinoline precursor nucleus itself.42,43 The absorption and emission spectra, Fig. 3, show absorption and emission maxima at 318, 345 and 457 nm respectively, ≈ 100 nm Stokes-shifted fluorescence, which is ideal for fluorescence sensing.40,41
Fig. 3.
Absorption and emission spectra of o-BMOQBA in pH 7.5 phosphate buffer.
Boronic acids are weak Lewis Acids composed of an electron deficient boron atom and two hydroxyl groups, Fig. 1, which can interact with strong bases like OH− to from the anionic boronate form showing typically high pKa around 9.31–37 Boronic acids couple with diols to form a boronic acid diester group. The diol is linked covalently, and the reaction is fast and completely reversible.44 In comparison to the boronic acid group, the boronic acid ester group shows higher acidity due to a more electrophilic boron atom. The use of the boronic acid groups for sensing sugars is strongly dependent on the molecular geometry and the aromatic species upon which the boronic acid group is present, hence glucose sensitive probes can be made with a variety of affinities, in the mM range for blood glucose,31–37 and here in the µM range for tear glucose. In this paper we report on new boronic acid containing fluorophores (BAFs) which employ a different mechanism to induce spectral changes in the presence of sugar as has been observed, or used previously.31–37 and are similarly reversible in their response. Here, the BA group [−B(OH)2] acts as an electron withdrawing group. However, in the presence of sugar and at an appropriate pH, the boronic acid group is present in its anionic form, namely [−B(−)(OH)(Sugar)] and is no longer an electron withdrawing group. Hence spectral changes can be observed due to the interaction of this sugar-bound electron donating group, with the electron deficient quaternary heterocyclic nitrogen center. Indeed, we believe the positive charge of the nitrogen atom, charge stabilizes the sugar bound form,39 affording for both the probes reduced pKa and therefore glucose affinity at the lens pH.
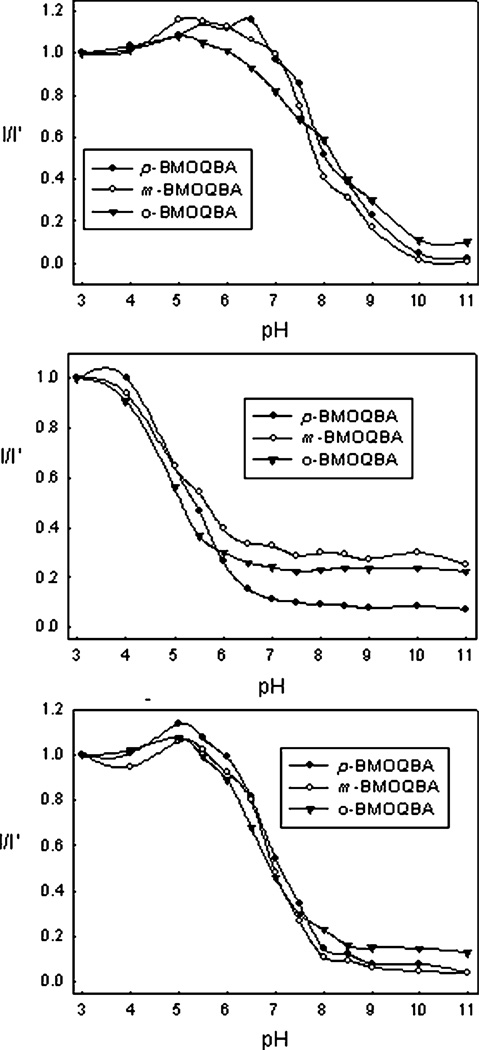
Analysis of the data shown in Fig. 4 with eqn. (1), gives the probes pKa’s in buffer, 100 mM glucose and 100 mM fructose solution, Table 1. All three probes show glucose bound pKa less than 7, with pKa for bound-fructose between 4.8 and 5.45. Interestingly, the o-BMOQBA shows the smaller pKa for both glucose and fructose but is similar to the other two isomers in buffer. The data shown in Fig. 4 was constructed by plotting I/I′ as a function of pH, where I′ is the fluorescence intensity of the probe at 450 nm in pH 3 buffer and I is corresponding intensities in other pH solutions. Typical boronic acid probes show sugar-bound pKa’s > 7,31–37 and this was previously attributed by us to their poor response to glucose at a lens pH of 5.5–6.5.38 Table 1 shows the new probes to have glucose-bound pKa close to 6.5.
Fig. 4.
Emission intensity at 450 nm, I, divided by the initial emission intensity, I′, as a function of pH (top) and with 100 mM glucose (middle) and 100 mM fructose (bottom).
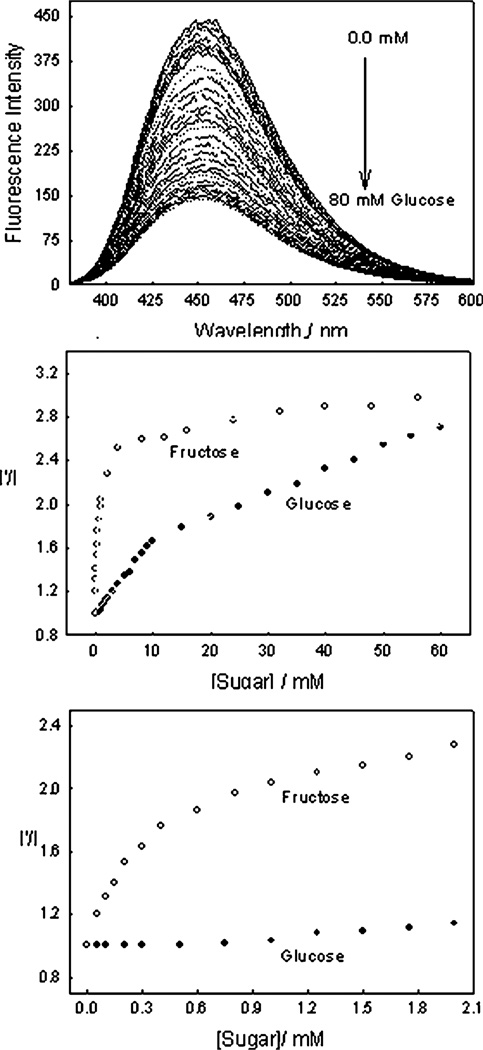
Fig. 5 – top, shows the emission spectrum of o-BMOQBA in pH 7.5 buffer as a function of increasing glucose, λex = 345 nm. As the glucose concentration increases we typically see a reduction in the fluorescence band at ≈ 457 nm. By plotting I′/I, (intensity ratio) Fig. 5 – middle, we can see a ≈ 2.8 fold change in intensity by the addition of 60 mM glucose. The addition of fructose, Fig. 5 – middle, reveals a greater o-BMOQBA affinity for fructose than glucose, although the same ≈ 2.8 fold change in intensity is observed after the final addition of 60 mM sugar. The greater affinity of phenyl boronic acid for fructose over glucose is well-known.44 Interestingly, Fig. 5 – middle shows useful intensity changes in the presence of physiologically important glucose concentrations, where the blood glucose level is 3–8 mM for a healthy person and increases to between 2 and 40 mM in diabetics.45 In the tear glucose range (µM glucose concentration range), Fig. 5 – bottom, we are able to see a ≈ 10–15% change in fluorescence intensity by the addition of 1 mM glucose, whereas fructose shows a much greater response in this concentration range.
Fig. 5.
Emission spectra of o-BMOQBA in pH 7.5 phosphate buffer with increasing glucose concentration (top), the respective 450 nm intensity ratio in the absence, I′, and presence, I, of sugar respectively, (middle) and in the low concentration range of sugar (bottom).
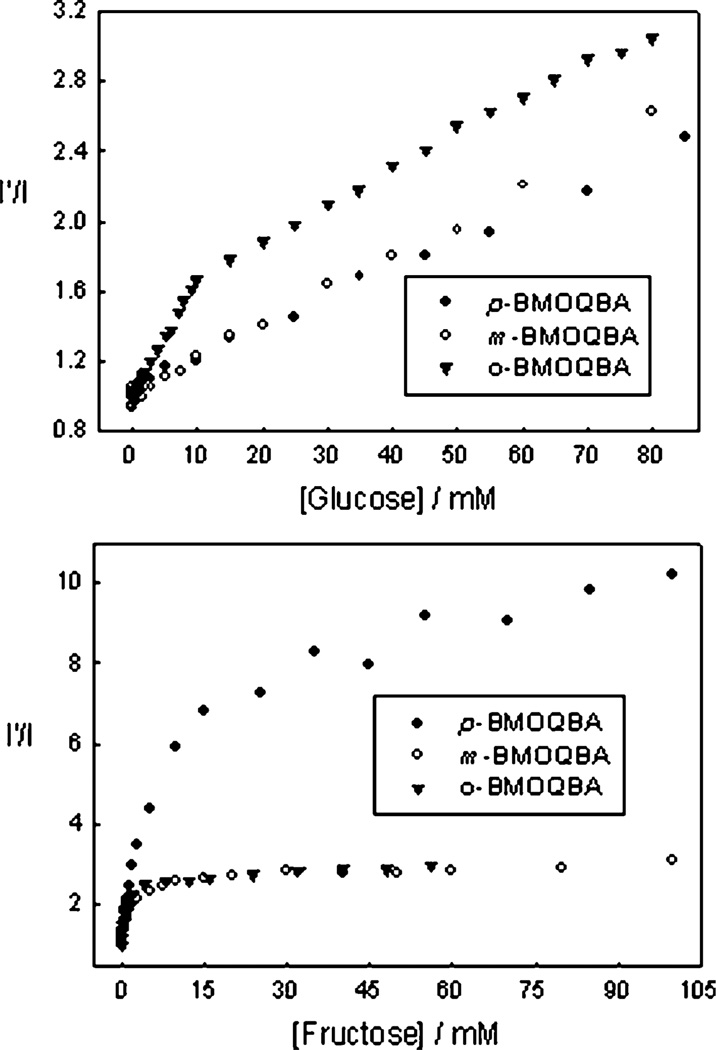
As well as considering the differences in sugar affinities for a given probe in solution, we can also compare the differences in sugar affinities between the 3 different isomers, Fig. 6 and Table 2. The o-BMOQBA shows a greater response to glucose and the p-BMOQBA towards fructose, with a notable change in fluorescence intensity for glucose concentrations less than 10 mM. Similarly, the addition of 10 mM fructose shows a ≈ 6-fold change in intensity, Fig. 6 – bottom. The data in Fig. 6 can be used with eqn. (2) to determine the dissociation constants, Table 2, which roughly reflects these visual trends. However, while eqn. (2) is routinely used to obtain boronic acid–sugar dissociation and binding constants,31–37 we found only a modest confidence in the fitting procedure here, illustrated by comparing the visual trends in Fig. 6 with the recovered values in Table 2. While beyond the scope of this text, these fitting difficulties clearly reflect the need for a new kinetic sugar binding function with our new probes. Further studies are under way in this regard.
Fig. 6.
The 450 nm emission intensity ratio for the BMOQBA probes in the absence, I′, and presence, I, of glucose, (top) and fructose (bottom).
Table 2.
Dissociation constants, KD, (mM) of the probes with glucose and fructose in pH 7.5 buffer and in the contact lens
| Probe | Glucose | Fructose | ||
|---|---|---|---|---|
| Buffer | Lens | Buffer | Lens | |
| o-BMOQBA | 58.5 | 322 | 0.8 | 83 |
| m-BMOQBA | 909 | 54.6 | 1.98 | 4.94 |
| p-BMOQBA | 555 | 111.1 | 9.9 | 34.7 |
Doped contact lenses, which were previously washed and allowed to leach dye for 1 h were tested with both glucose and fructose. Buffered solutions of sugars were added to the lens, pH 7.5 phosphate buffer, in an analogous manner to ocular conditions. Fluorescence spectra were typically taken 15 min after each sugar addition to allow the lens to reach equilibrium. The 90% response time, the time for the fluorescence signal to change by 90% of the initial value, was ≈ 10 min.
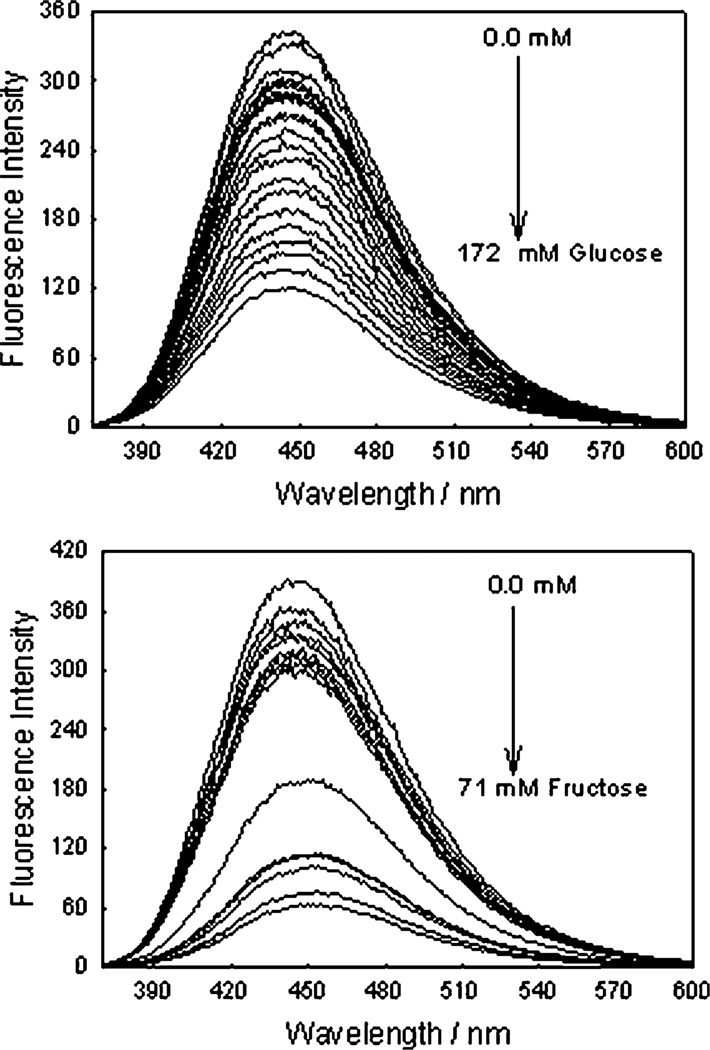
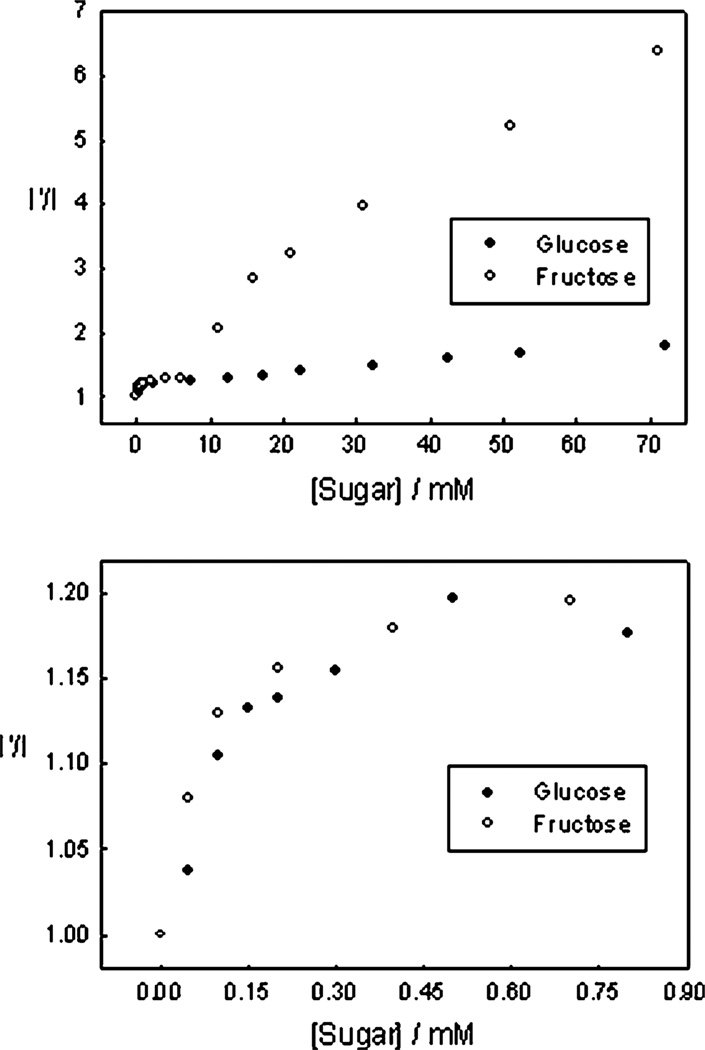
Fig. 7 shows the response of an o-BMOQBA doped contact lens towards both glucose, top, and fructose, bottom. The doped lens clearly shows good responses towards both sugars. We again constructed the I′/I plots, where I′ and I are the fluorescence intensities at 450 nm in the absence and presence of sugars, respectively, Fig. 8. The response towards fructose was greater at high sugar concentrations, however, in the low concentration range, Fig. 8 – Bottom, glucose and fructose have a similar affinity in the lens, with a ≈ 20% change in fluorescence signal with the addition of only 500 µM glucose. Clearly we see a greater response in lens towards sugars than in our solution based studies at pH 7.5. This wasn’t unexpected, and is simply explained by the pKa of the probes being < 7. More difficult to explain however is the similar affinity of both glucose and fructose in the lens at low sugar concentrations, which we can only attribute to the presence of the lens at this time. We repeated these doped lens experiments several times, and in all cases the trends were reproducible. It is difficult to assess the effect of the PVA hydroxyl groups of the contact lens polymer on the response of boronic acid to sugar, but our studies with solutions of glycerol indicated that sugar had much higher binding affinities than glycerol hydroxyl groups. We therefore speculate that sugars will preferentially bind boronic acid groups in the PVA lens polymer. In any event the boronic acid probes function well towards sugars in the lens, in what is likely to be an environment saturated with PVA hydroxyl groups.
Fig. 7.
The emission spectra of an o-BMOQBA doped contact lens in the presence of increasing glucose (top) and fructose concentrations (bottom). λex = 345 nm.
Fig. 8.
The 450 nm emission intensity ratio for the o-BMOQBA doped contact lens in the absence, I′, and presence, I, of glucose and fructose, (top) and in the tear glucose range, i.e. < 1 mM, (bottom).
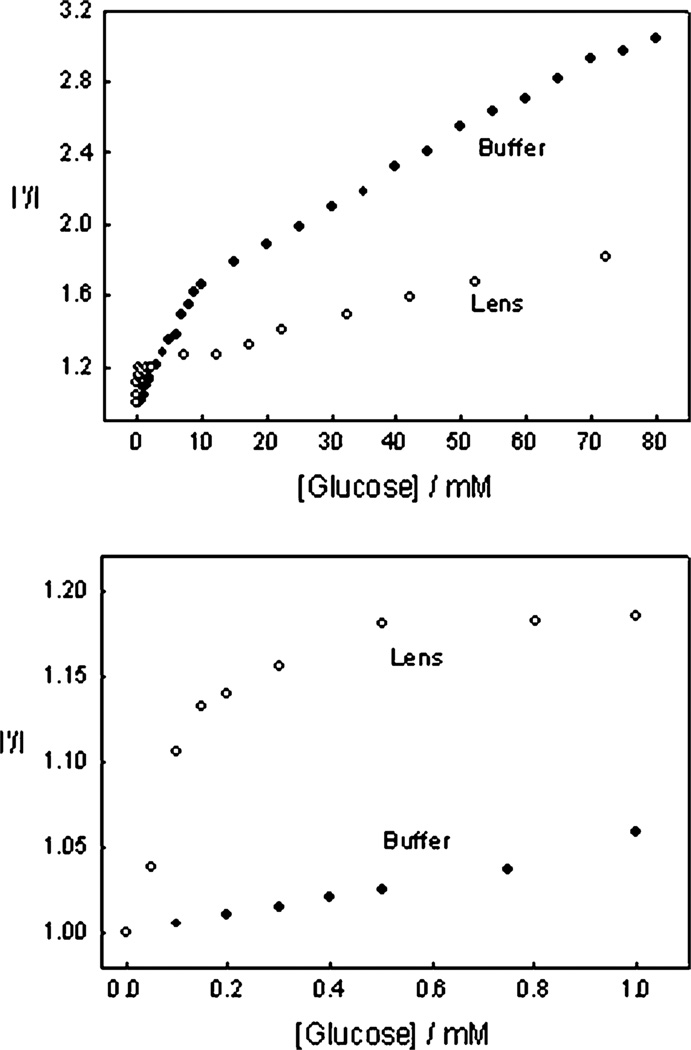
It is also informative to compare the earlier pH 7.5 buffer results with those obtained within a lens, also buffered at pH 7.5, Fig. 9, noting that external buffering has little effect on internal lens pH.38 Clearly the results show a better glucose response at tear levels. We are uncertain at this time however, as to the nature of the smaller fluorescence response at higher glucose concentrations, but we speculate that it may be due to the greater leaching of the glucose-bound (boronate-diester) form of the probes and/or their displaced solubility with the contact lens polymer. This may also account for some of the complex binding kinetics we have observed, evident in some I′/I vs. [sugar] plots. In this regard the response of an o-BMOQBA doped lens also shows complex behavior towards mM fructose concentrations, (data not shown), with much simpler kinetics observed in the tear glucose concentration range.
Fig. 9.
A comparison of the 450 nm emission intensity ratio for the o-BMOQBA doped contact lens with that obtained in pH 7.5 phosphate buffer, in the absence, I′, and presence, I, of glucose (top) and in the tear glucose range, i.e. < 1 mM, (bottom).
Leaching studies of the probes from the contact lens polymer were undertaken using the lens holder, which contained ≈ 1.5 cm3 buffer, 20 °C. A Varian fluorimeter measured the intensity change as a function of time to determine the percentage signal change, corresponding to dye leaching. It should be noted that with no sample present, no intensity fluctuations or drifts were observed, indicating stability of the fluorimeter Xenon-arc source. We observed only a very small fractional change in fluorescence intensity (< 5%) over the first 30 min, after which time the signal remained constant, implying very little dye leaching from the lens. In addition, similar results were obtained at 38°C but with a different leaching rate. In all our studies described here, lenses were pre-leached to a steady-state fluorescence intensity before use. After glucose measurements were undertaken the outer lens fluid volume surrounding the contact lens was found to be non-fluorescent indicating that dye had not leached from the lens during measurements. It should be noted that while chemistries are available to covalently label our probes within the contact lens polymer, which would eliminate any leaching, it is an important design concern for our approach that the lenses remain unmodified, so that their physiological characteristics and compatibilities remain unchanged. In fact our approach is targeted at reducing future lens redesign costs by using simple probe doping.
As with all sensors it is important to consider the effects of potential interferents and sensor shelf-life on the working response of the device. Throughout much of this paper we have shown the response of the probes towards fructose, primarily because of its well-known greater affinity for the boronic acid moiety.31–37 However, the concentration of fructose in blood is ≈ 10 times lower than glucose,45 a relationship which is also thought to occur in tears. Hence fructose is not thought to be a major interferent in tears. In addition, lenses that had been doped, leached and stored for several months gave identical sugar sensing results, indicating no lens polymer–fluorophore interactions over this time period.
4.0 Conclusions
We have synthesized and tested a range of new boronic acid containing fluorophores that are compatible with the low pH and methanol-like polarity within a disposable off-the-shelf contact lens. We have subsequently developed a proto-type glucose sensing contact lens based on embedded boronic acid containing fluorophores, that responds well to glucose concentrations in the tear range, 50–500 µM glucose. We have shown sensor responses of ≈ 20% for glucose in this range, which would readily enable normal glucose levels of a healthy person to be determined, where elevated tear glucose levels during hyperglycemia would inevitably produce an even greater signal response. In addition our prototype has a 90% response time of about 10 min, does not leach probe and has a shelf-life in excess of the several month experimental period.
Many boronic containing fluorophores have a visible absorption, which apart from their lack of glucose sensitivity in the lens as discussed earlier, would introduce color into a doped lens. While colored lenses are attractive to a few people as sports accessories, the majority of contact lenses worn today are clear, hence our colorless BMOQBA probes are ideal in this regard.
With diabetes being widely recognized as one of the leading causes of death and disability in the western world, we believe our boronic acid doped contact lens approach and findings, are a notable step forward towards the continuous and non-invasive monitoring of blood glucose.
Acknowledgments
The authors would like to thank the University of Maryland Biotechnology Institute and the National Center for Research Resources, RR-08119, for financial support. Drs Angelika Domschke and Dawn Smith of Cibavision are also acknowledged for supplying the contact lens holder shown in Fig. 2.
References
- 1.The Diabetes Control and Complications Trial Research Group. Diabetes. 1997;46:271–286. [PubMed] [Google Scholar]
- 2.The Diabetes Control and Complications Trial Research Group. N. Engl. J. Med. 1993;329:977–986. doi: 10.1056/NEJM199309303291401. [DOI] [PubMed] [Google Scholar]
- 3.Robinson MR, Eaton RP, Haaland DM, Koepp GW, Thomas EV, Stallard BR, Robinson PL. Clin. Chem. 1992;38:1618–1622. [PubMed] [Google Scholar]
- 4.Heise HM, Marbach R, Koschinsky TH, Gries FA. Ann. Occup. Hyg. 1994;18:439–447. doi: 10.1111/j.1525-1594.1994.tb02230.x. [DOI] [PubMed] [Google Scholar]
- 5.March WF, Rabinovitch B, Adams R, Wise JR, Melton M. Trans. Am. Soc. Artif. Intern. Organs. 1982;28:232–235. [PubMed] [Google Scholar]
- 6.Rabinovitch B, March WF, Adams RL. Diabetes Care. 1982;5:254–258. doi: 10.2337/diacare.5.3.254. [DOI] [PubMed] [Google Scholar]
- 7.Schier GM, Moses RG, Gan IET, Blair SC. Diabetes Res. Clin. Pract. 1988;4:177–181. doi: 10.1016/s0168-8227(88)80015-9. [DOI] [PubMed] [Google Scholar]
- 8.Clarke W, Becker DJ, Cox D, Santiago JV, White NH, Betschart J, Eckenrode K, Levandoski LA, Prusinki EA, Simineiro LM, Snyder AL, Tideman AM, Yaegar T. Diabetes Res. Clin. Pract. 1988;4:209–214. doi: 10.1016/s0168-8227(88)80020-2. [DOI] [PubMed] [Google Scholar]
- 9.Trettnak W, Wolfbeis OS. Anal. Chim. Acta. 1989;221:195–203. [Google Scholar]
- 10.Meadows D, Schultz JS. Talanta. 1988;35:145–150. doi: 10.1016/0039-9140(88)80053-5. [DOI] [PubMed] [Google Scholar]
- 11.Tolosa L, Malak H, Rao G, Lakowicz JR. Sens. Actuators B. 1997;45:93–99. doi: 10.1016/S0925-4005(97)00275-X. [DOI] [PMC free article] [PubMed] [Google Scholar]
- 12.Tolosa L, Gryczynski I, Eichorn LR, Dattelbaum JD, Castellano FN, Rao G, Lakowicz JR. Anal. Biochem. 1999;267:114–120. doi: 10.1006/abio.1998.2974. [DOI] [PMC free article] [PubMed] [Google Scholar]
- 13.D’Auria S, Dicesare N, Gryczynski Z, Gryczynski I, Rossi M, Lakowicz JR. Biochem. Biophys. Res. Commun. 2000;274:727–731. doi: 10.1006/bbrc.2000.3172. [DOI] [PubMed] [Google Scholar]
- 14.Michail D, Zolog N. C. R. Seances Soc. Biol. Ses Fil. 1937;126:1042. [Google Scholar]
- 15.Michail D, Vancea P, Zolog N. C. R. Seances Soc. Biol. Ses Fil. 1937;125:1095. [Google Scholar]
- 16.Van Haeringen NJ. Surv. Ophthalmol. 1981;29(2):84–96. doi: 10.1016/0039-6257(81)90145-4. [DOI] [PubMed] [Google Scholar]
- 17.Gasser AR, Braverman LE, Fleming MC, Arky RA, Alter BR. Am. J. Ophthalmol. 1968;65(3):414–420. doi: 10.1016/0002-9394(68)93093-6. [DOI] [PubMed] [Google Scholar]
- 18.Das BN, Sengupta S, Das BK, Goswami NR. J. Indian Med. Assoc. 1995;93(4):127–128. [PubMed] [Google Scholar]
- 19.Chen R, Jin Z, Colon LA. J. Capillary Electrophor. 1996;3(5):243–248. [PubMed] [Google Scholar]
- 20.Perez SA, Colon SA. Electrophoresis. 1996;17(2):352–358. doi: 10.1002/elps.1150170211. [DOI] [PubMed] [Google Scholar]
- 21.Jin Z, Chen R, Colon LA. Anal. Chem. 1997;69(7):1326–1331. doi: 10.1021/ac960724m. [DOI] [PubMed] [Google Scholar]
- 22.Giardiai A, Roberts JRE. Br. J. Ophthalmol. 1950;34:737–743. doi: 10.1136/bjo.34.12.737. [DOI] [PMC free article] [PubMed] [Google Scholar]
- 23.Sugihara JM, Bowman CM. J. Am. Chem. Soc. 1958;80:2443. [Google Scholar]
- 24.Lorand JP, Edwards JO. J. Org. Chem. 1959;24:769. [Google Scholar]
- 25.Spingsteen G, Wang B. Tetrahedron. 2002;38:5291. [Google Scholar]
- 26.James TD, Sandanayake KRAS, Shinkai S. Nature. 1995;374:345. [Google Scholar]
- 27.Norrild JC, Eggert H. J. Am. Chem. Soc. 1995;117:1479. [Google Scholar]
- 28.Eggert H, Frederiksen J, Morin C, Norrild JC. J. Org. Chem. 1999;64:3846. [Google Scholar]
- 29.Smith BD, Gardiner SJ, Munro TA, Paugam MF, Riggs JA. J. Incl. Phenom. Mol. Recogn. Chem. 1998;32:121. [Google Scholar]
- 30.Soundararajan S, Badawi M, Kohlrust CM, Hagerman JH. Anal. Biochem. 1989;178:125. doi: 10.1016/0003-2697(89)90367-9. [DOI] [PubMed] [Google Scholar]
- 31.James TD, S KRA, Shinkai S. Angew, Chem. Int. Ed. Engl. 1994;33:2207. [Google Scholar]
- 32.James TD, Sandanayake KRAS, Iguchi R, Shinkai S. J. Am. Chem. Soc. 1995;117:8982. [Google Scholar]
- 33.Bielecki M, Eggert H, Norrild JC. J. Chem. Soc., Perkin Trans. 1999;2:449. [Google Scholar]
- 34.Dicesare N, Lakowicz JR. Anal. Biochem. 2001;294:154–160. doi: 10.1006/abio.2001.5170. [DOI] [PMC free article] [PubMed] [Google Scholar]
- 35.Dicesare N, Lakowicz JR. J. Photochem. Photobiol. A. 2001;143:39–47. doi: 10.1016/S1010-6030(01)00471-3. [DOI] [PMC free article] [PubMed] [Google Scholar]
- 36.Dicesare N, Lakowicz JR. Org. Lett. 2001;3(24):3891–3893. doi: 10.1021/ol016813p. [DOI] [PMC free article] [PubMed] [Google Scholar]
- 37.Dicesare N, Lakowicz JR. Tetrahedron Lett. 2002;43:2615–2618. doi: 10.1016/s0040-4039(02)00312-x. [DOI] [PMC free article] [PubMed] [Google Scholar]
- 38.Badugu R, Lakowicz JR, Geddes CD. Anal. Chem. 2004;76(3):610–618. doi: 10.1021/ac0303721. [DOI] [PMC free article] [PubMed] [Google Scholar]
- 39.Badugu R, Lakowicz JR, Geddes CD. Tetrahedron Lett. 2004 submitted. [Google Scholar]
- 40.Lakowicz JR. Principles of Fluorescence Spectroscopy. 2nd. New York: Kluwer/Academic Plenum Publishers; 1997. [Google Scholar]
- 41.Gryczynski Z, Gryczynski I, Lakowicz JR. Methods Enzymol. 2002;360:44–75. doi: 10.1016/s0076-6879(03)60106-0. [DOI] [PubMed] [Google Scholar]
- 42.Geddes CD, Douglas P, Moore CP, Wear TJ, Egerton PL. Dyes Pigm. 1999;43(1):59–63. [Google Scholar]
- 43.Geddes CD. Sens. Actuators B. 2001;72(2):188–195. [Google Scholar]
- 44.Springsteen G, Wang B. Tetrahedron. 2002;58:5291–5300. [Google Scholar]
- 45.DiCesare N, Lakowicz JR. J. Bio. Med. Opt. 2002;7(4):538–545. doi: 10.1117/1.1502263. [DOI] [PMC free article] [PubMed] [Google Scholar]


