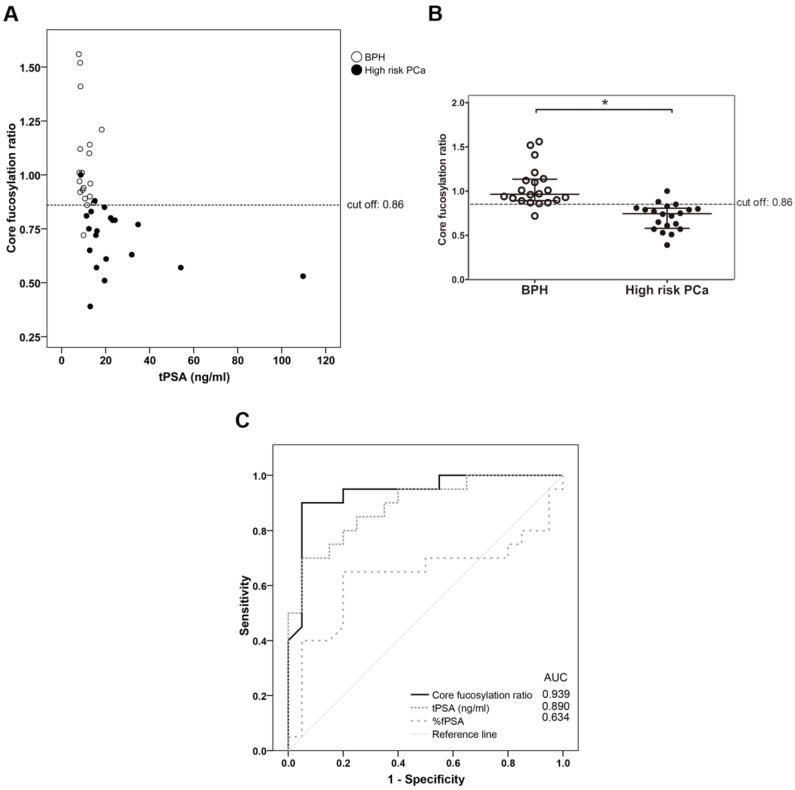
Figure 3.
Representation of the core fucosylation ratio of PSA against either tPSA serum levels (panel A) or the pathology (panel B). Serum samples from BPH are indicated with white circles and high risk PCa serum samples in black circles. In Scatter dot plot, dotted line indicates the cut-off value for discriminating the two pathologies, the center line in the box represents the median, and the top (Q3) and bottom (Q1), the 75th and 25th percentiles, respectively. (C) Comparison of ROC curves for core fucosylation ratio, tPSA and %fPSA. The core fucosylation ratio gave the highest AUC value (AUC=0.94). The cut off value of 0.86 gave the highest sensitivity (90%) and specificity (95%).

