Abstract
Background:
Recent studies have indicated that an imbalance of gut microbiota is associated with the development of type 1 diabetes mellitus (T1DM) and there is no literature regarding it in Chinese children yet. The aim of this study was to evaluate the alteration of gut microbiota between children with newly diagnosed T1DM and healthy controls and to determine if gut microbiota could partly explain the etiology of this disease.
Methods:
A case-control study was carried out with 15 children with T1DM and 15 healthy children. The fecal bacteria composition was investigated by high-throughput sequencing of the V3–V4 region of the 16S rDNA gene and analyzed by the estimators of community richness (Chao) indexes.
Results:
There was a notable lower richness of fecal bacteria in T1DM group than controls (156.53 ± 36.96 vs. 130.0 ± 32.85, P = 0.047). At the genus level, the composition of Blautia was increased in T1DM group than control group whereas the composition of Haemophilus, Lachnospira, Dialister, and Acidaminococcus was decreased. In addition, we found that the percentage of Blautia was correlated positively with HbA1c (ρ = 0.40, P = 0.031), the numbers of T1DM autoantibodies (ρ = 0.42, P = 0.023), and the titers of tyrosine phosphatase autoantibodies (IA-2) (ρ = 0.82, P = 0.000) in the study.
Conclusions:
This study showed that gut microbiota was associated with the development of T1DM by affecting the autoimmunity, and the results suggested a potential therapy for T1DM via modulating the gut microbiota.
Keywords: Autoantibodies, Gut Microbiota, Type 1 Diabetes Mellitus
INTRODUCTION
Type 1 diabetes mellitus (T1DM), characterized by beta-cells destruction and insulin deficiency, is one of the most common autoimmune diseases in childhood that leads to significant burden and mental problems.[1] In addition, the worldwide prevalence of T1DM keeps increasing in recent years. The overall increase rate in Europe is about 3%–4% per annum, and the incidence is anticipated to double by 2020.[2] However, the pathogenesis of T1DM has not been clearly understood yet. Nowadays, it has been acknowledged that T1DM is not only caused by genetic susceptibilities, such as human leukocyte antigen DRB1 and DQB1 alleles,[3] but also more importantly by environmental factors, because the increasing incidence might not be explained only by host genetic factors. Reports have shown that lack of breastfeeding and viral infections would contribute to the development of T1DM.[4,5] The intestinal microbiota, as another environmental factor currently under study, might also play a role in T1DM.
Gut microbiota, habitating in human intestinal tract, comprises a total genome that is near 150 times more than the human genome.[6] Recently, it has been proven that gut microbiota plays an important role in regulating metabolic functions and is associated with many diseases such as obesity, insulin resistance, autoimmune diseases, and tumor.[7] The study in nonobese diabetic mice and biobreeding diabetes-prone rats indicated that sterile rats had a higher incidence of insulitis and worse beta-cell function[8,9] while the intervention of antibiotics and probiotics appeared to have preventive role on the onset of diabetes.[10] Clinical studies found that the gut microbiota composition was different between T1DM children and healthy controls, in terms of the ratio of phylum Firmicutes to Bacteroides decreased.[11,12] However, there are no such data in Chinese children with T1DM. The aim of this study was to investigate whether there is an alteration of structure of the gut microbiota at newly diagnosed T1DM patients in Chinese population.
METHODS
Study participants
In this case-control study, a total of 15 patients with T1DM (aged 11.4 ± 3.0 years) were enrolled from Peking Union Medical College Hospital between September 2014 to June 2015. T1DM cases were newly diagnosed (< months), according to the criteria of the American Diabetes Association[1] and the presence of at least one of the persistent, confirmed anti-islet autoantibodies including insulin (IAA), islet cell autoantibodies (ICA), glutamic acid decarboxylase autoantibodies (GAD), and tyrosine phosphatase autoantibodies (IA-2). In addition, 15 healthy controls were tested all T1DM autoantibody-negative, and they were matched to T1DM patients with age, gender, race, mode of delivery, and duration of breastfeeding. The study participants were excluded if they had one of the following conditions: acute or chronic inflammatory diseases or infectious diseases, chronic gastrointestinal disease such as diarrhea and constipation, receiving antibiotic treatment within 3 months before enrollment or receiving other treatments including probiotics and prebiotics. The parents of the patients and healthy controls were required to complete a questionnaire containing the following data: health status, lifestyle aspects (such as living environment and physical activity), and dietary habit. Informed written consent was obtained from all participants and their guardians, and the sampling and experimental processes were performed with the approval of the Institutional Review Board and Ethics Committee of Peking Union Medical College Hospital.
Anthropometric measurement and laboratory measurements
Body weight and height were measured according to standardized procedures. Serum glucose, cholesterol, and triglycerides were measured using a standard enzymatic method (Randox Laboratories Ltd., Antrim, UK). HbA1c was measured using high-pressure liquid ion-exchange chromatography. The quantitative detection of autoantibodies to islet cell antigens was performed using the Elisa kit (Biomerica, USA).
Microbial diversity analysis
DNA extraction and polymerase chain reaction amplification
Fresh fecal samples were immediately frozen at −80°C after collection and kept until use. Microbial DNA was extracted from stool samples using the E.Z.N.A.® DNA Kit (Omega Bio-Tek, Norcross, GA, USA) according to the manufacturer's protocols. The V3–V4 region of the bacteria 16S ribosomal RNA gene was amplified by polymerase chain reaction (PCR) (95°C for 2 min, followed by 25 cycles at 95°C for 30 s, 55°C for 30 s, and 72°C for 30 s and a final extension at 72°C for 5 min) using primers 515F (5’-GTGCCAGCMGCCGCGG-3’) and 907R (5’-CCGTCAATTCMTTTRAGTTT-3’). A unique 8 bp barcode sequence was attached to each sample. PCR reactions were performed in triplicate 20 μl mixture containing 4 μl of 5 × Fast-Pfu buffer, 2 μl of 2.5 mmol/L dNTPs, 0.8 μl of each primer (5 μmol/L), 0.4 μl of Fast-Pfu polymerase, and 10 ng of template DNA.
Illumina MiSeq sequencing
Amplification products were extracted from 2% agarose gels and purified using the AxyPrep DNA Gel Extraction Kit (Axygen Biosciences, Union City, CA, USA) according to the manufacturer's instructions and quantified using QuantiFluor™- ST (Promega, USA). Purified products were pooled in equimolar and paired-end sequenced (2 × 250) on an Illumina MiSeq platform (Illumina Inc., USA) according to the standard protocols.
Bioinformatic analysis
All raw reads were screened according to barcode and primer sequences, using Quantitative Insights Into Microbial Ecology (QIIME, version 1.17). The 250 bp reads were truncated at any site receiving an average quality score <20 over a 10 bp sliding window, abandon the truncated reads that were shorter than 50 bp. Sequences shorter than 10 bp, containing ambiguous characters, or containing more than two nucleotide mismatches in primer matching were removed. Operational taxonomic units (OTUs) were clustered with 97% similarity cutoff using UPARSE (version 7.1; http://drive5.com/uparse/), and chimeric sequences were identified and removed using UCHIME. The phylogenetic affiliation of each 16S rRNA gene sequence was analyzed by RDP Classifier (http://rdp.cme.msu.edu/) against the silva (SSU117) 16S rRNA database using confidence threshold of 70%.[13] Unweighted UniFrac distance metrics analysis was performed using OTUs for each sample, and principal component (PC) analysis and principal coordinates analysis (PCoA) were conducted according to the matrix of distance.[14] Linear discriminant analysis (LDA) effect size (LEfSe) was used to elucidate the differences of bacterial taxa. The LDA score ≥2 was considered to be important contributors to the model,[15] and LEfSe was used online in the Galaxy workflow framework (http://huttenhower.sph.harvard.edu/galaxy/root?tool_id = lefse_upload).
Statistical analysis
The data were expressed as mean ± standard deviation (SD). The statistical analysis was performed with SPSS 17.0 (SPSS Inc., Chicago, IL, USA). Statistical analyses of anthropometric measurements and biochemical variables were performed with Student's t-test. The Mann-Whitney U-test was used to check changes in bacterial composition between the two groups. The Spearman's correlation coefficient was calculated to estimate the linear correlations between variables. Statistical significance was set at P < 0.05.
RESULTS
Clinical characteristics and anthropometric measurements
The clinical characteristics and anthropometric measurements are shown in Table 1. There were 11 children with more than two positive autoantibodies in the T1DM group whereas there was no positive autoantibody in healthy controls. The levels of glucose and HbA1c were significantly higher in children with T1DM than healthy controls. No other significant differences were found between the two groups in the anthropometric and biochemical variables. In addition, the subjects of the two groups showed similar pattern in the breastfeeding time and delivery mode.
Table 1.
Clinical characteristics and anthropometric measurements of all participants in this study
| Items | Controls (n = 15) | T1DM group (n = 15) | t | P |
|---|---|---|---|---|
| Age (years), mean ± SD | 10.5 ± 1.5 | 11.4 ± 3.0 | −1.153 | 0.259 |
| Male/female, n | 8/7 | 8/7 | – | |
| Cesarean section/vaginal delivery, n | 5/10 | 6/9 | – | |
| BMI (kg/m2), mean ± SD | 17.57 ± 2.96 | 17.82 ± 3.07 | −0.236 | 0.815 |
| Birth weight (kg), mean ± SD | 3.50 ± 0.43 | 3.60 ± 0.61 | −0.598 | 0.555 |
| Age of onset (years), mean ± SD | – | 10.93 ± 3.03 | – | |
| Glucose (mmol/L), mean ± SD | 4.65 ± 0.50 | 8.82 ± 2.61 | −6.604 | 0.000 |
| HbA1c (%), mean ± SD | 5.25 ± 0.28 | 9.58 ± 1.78 | −9.279 | 0.000 |
| Triglycerides (mmol/L), mean ± SD | 0.87 ± 0.60 | 0.65 ± 0.23 | 1.309 | 0.201 |
| Cholesterol (mmol/L), mean ± SD | 3.71 ± 0.46 | 4.13 ± 0.85 | −1.716 | 0.097 |
| Breast feeding (months), mean ± SD | 7.60 ± 3.26 | 7.87 ± 2.39 | −0.255 | 0.800 |
| Numbers of autoantibodies, n | ||||
| One | – | 4 | – | |
| Two | – | 4 | – | |
| Three | – | 5 | – | |
| Four | – | 2 | – |
T1DM: Type 1 diabetes mellitus; SD: Standard deviation; BMI: Body mass index; –: Not applicable; HbA1c: Glycated hemoglobin.
Characteristics of sequencing results
A total of 402,857 high-quality sequences were produced in this study, with an average of 13,428 sequences per sample [Table 2]. The good's coverage of each group was over 97%, indicating that the 16S rDNA sequences identified in the groups represented the majority of bacteria appeared in the samples of this study. The OTUs, the estimators of community richness (Chao) and diversity (Shannon), are shown in Table 2. There was a statistically significant difference of Chao indexes (156.53 ± 36.96 vs. 130.00 ± 32.85, P = 0.047) between healthy controls and T1DM patients, demonstrating that the notably lower richness of gut microbiota found in T1DM children.
Table 2.
Summary of pyrosequencing data in this study, mean ± SD
| Items | Controls (n = 15) | T1DM group (n = 15) | t | P |
|---|---|---|---|---|
| Sequences | 13,566 ± 2369 | 13,291 ± 2253 | 0.306 | 0.762 |
| OTUs | 132.60 ± 32.29 | 121.53 ± 36.06 | 0.885 | 0.383 |
| Chao | 156.53 ± 36.96 | 130.00 ± 32.85 | 2.078 | 0.047 |
| Shannon | 2.68 ± 0.73 | 2.81 ± 0.72 | −0.515 | 0.610 |
Chao represents the richness, and Shannon represents diversity of microbiome. SD: Standard deviation; T1DM: Type 1 diabetes mellitus; OTU: Operational taxonomic unit.
Principal coordinates analysis between two groups
To compare the overall microbiota structure of the two groups, the unweighted UniFrac distance matrix was calculated based on the OTUs of each sample. The PCoA plots based on distance revealed a significant separate clustering in microbiota structure between two groups. The results were demonstrated by the first PC1 and the third PC3, accounting for 43.11% and 10.18% of total variations [Figure 1].
Figure 1.
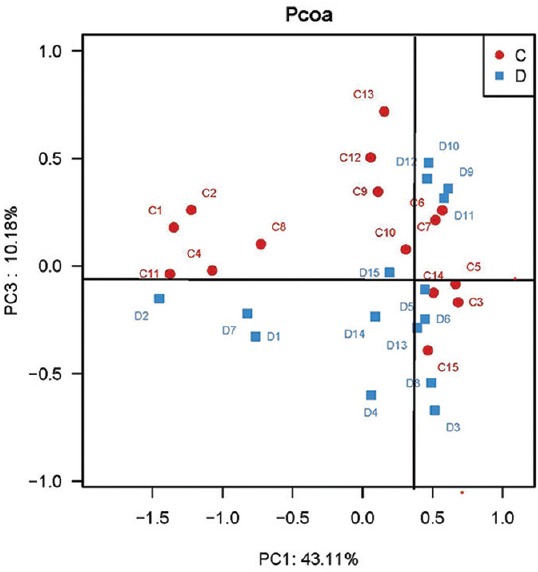
Principal coordinate analysis plots based on unweighted UniFrac metrics in controls (C) and type 1 diabetes mellitus (D) children (n = 15 in each group).
Microbial structures and the differences of phyla between two groups
The major taxa explaining the alteration of microbiota structure were not reflected at the phyla but at the genus and species level. Dominant phyla were Bacteroidetes and Firmicutes, followed by Proteobacteria and Actinobacteria, with no differences between groups (P > 0.05), and the ratio of Bacteroidetes/Firmicutes was not significantly different between the two groups [Figure 2]. A cladogram representation of the microbiota structure of the two groups and their predominant bacteria was performed by LEfSe [Figure 3], showing significantly higher level of Blautia in T1DM group, whereas the levels of Haemophilus, Lachnospira, Intestinimonas, Dialister, Micrococcales, Pasteurellaceae, and Caulobacterales were remarkable lower than those in control group. The specific phyla differences are shown in Figure 3b and Table 3.
Figure 2.
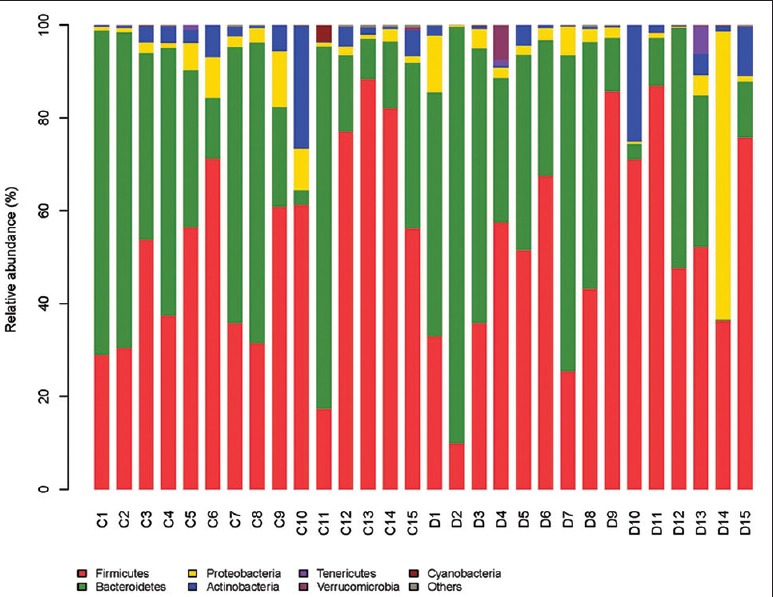
Relative abundance (%) of fecal microbiota in each sample at the phylum level (n = 15 in each group). C: Controls; D: Type 1 diabetes mellitus children.
Figure 3.
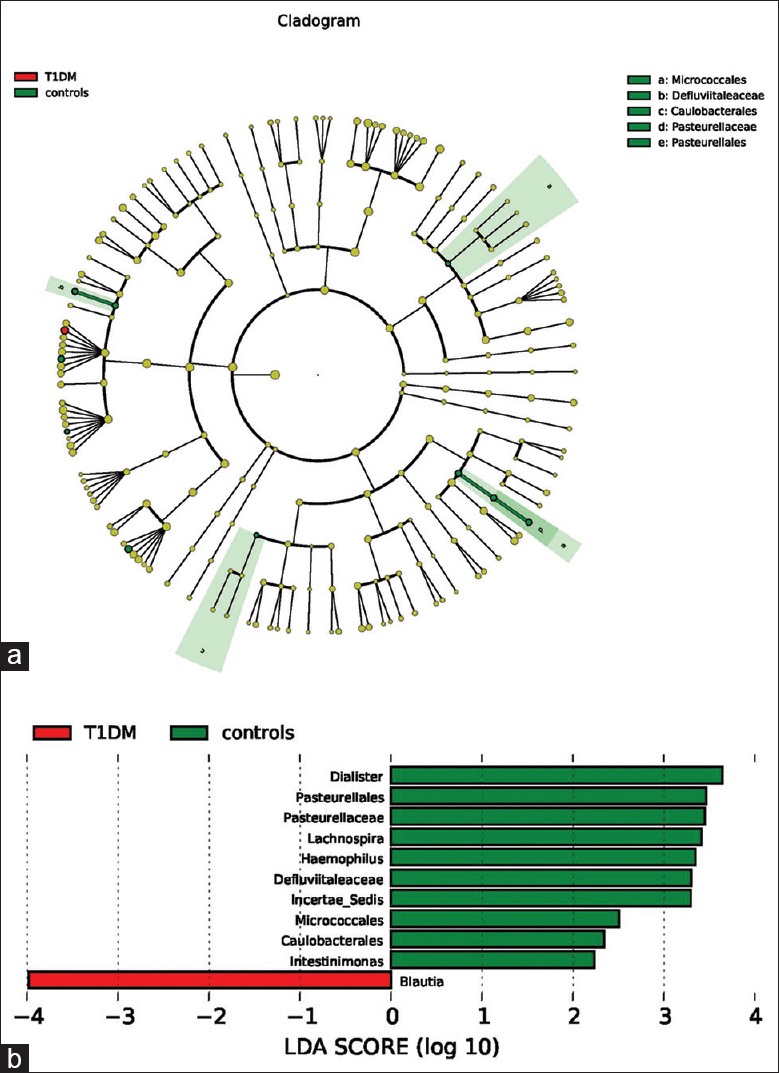
(a) Taxonomic representation of statistically and biologically consistent differences between control and type 1 diabetes mellitus (T1DM) groups. Differences are represented by the color of the most abundant class (red: T1DM group; yellow: nonsignificant; and green: control group). The diameter of each circle is proportional to the taxon's abundance. (b) Histogram of the linear discriminant analysis scores for differentially abundant genera. Linear discriminant analysis scores were calculated by linear discriminant analysis effect size, which is a metagenome analysis approach, using the linear discriminant analysis to assess effect size of each differentially abundant taxon or operational taxonomic unit. Moreover, before this, the differentially abundant taxons were found out by the Mann-Whitney U-test; the cladogram is displayed according to effect size.
Table 3.
The phylotypes with significant different between control and T1DM groups (%)
| Taxonomic rank | Control group (n = 15) | T1DM group (n = 15) | Z | P |
|---|---|---|---|---|
| Order | ||||
| Pasteurellales | 0.479 | 0.175 | −2.616 | 0.009 |
| Caulobacterales | 0.019 | 0.002 | −2.506 | 0.012 |
| Family | ||||
| Pasteurellaceae | 0.471 | 0.173 | −2.616 | 0.010 |
| Micrococcales | 0.007 | 0.006 | −1.211 | 0.026 |
| Genus | ||||
| Blautia | 0.843 | 2.270 | 1.776 | 0.043 |
| Haemophilus | 0.479 | 0.175 | −2.616 | 0.009 |
| Lachnospira | 0.761 | 0.300 | −2.511 | 0.012 |
| Dialister | 0.772 | 0.063 | −2.617 | 0.009 |
| Acidaminococcus | 0.000 | 0.071 | −2.015 | 0.035 |
| Species | ||||
| Intestinimonas | 0.019 | 0.004 | −1.666 | 0.048 |
Statistical analysis was performed by Mann-Whitney U-test. The data in two groups were relative abundance (%) of all sequences. T1DM: Type 1 diabetes mellitus.
Variation in the microbiota associated with clinical parameters and autoimmunity
Correlation analyses between relative abundance (%) of Blautia sequences and HbA1c, the numbers of T1DM autoantibodies, and the titers of IA-2 were performed using Spearman's correlation coefficient analysis. It is indicated that the percentage of Blautia were positively associated with HbA1c [ρ =0.40, P = 0.031; Figure 4], as well as had a positive correlation with the numbers of T1DM autoantibodies [ρ =0.42, P = 0.023; Figure 5] and the titers of IA-2 [ρ =0.82, P = 0.000; Figure 6].
Figure 4.
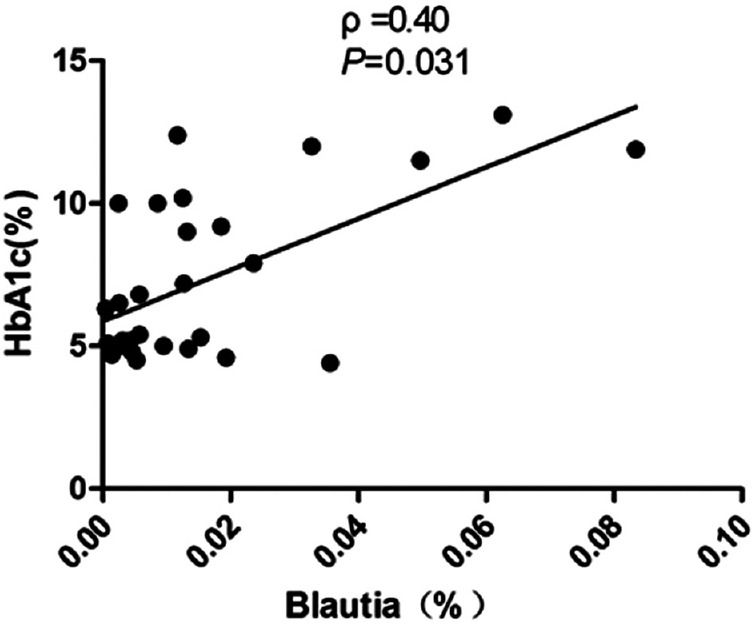
Correlation analyses between relative abundance (%) of Blautia sequences and HbA1c, using Spearman's correlation analyses (n = 30). HbA1c: Glycated hemoglobin.
Figure 5.
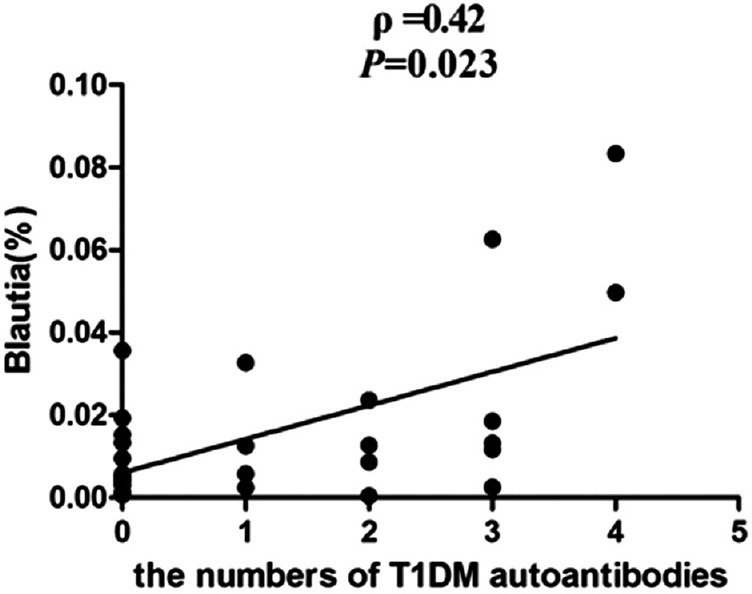
Correlation analyses between relative abundance (%) of Blautia sequences and the number of type 1 diabetes mellitus (T1DM) autoantibodies, using Spearman's correlation analyses (n = 30).
Figure 6.
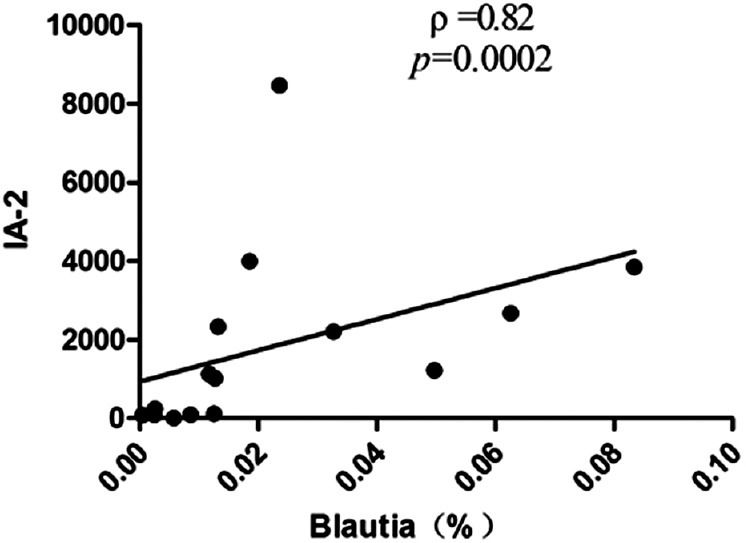
Correlation analyses between relative abundance (%) of Blautia sequences and the titers of IA-2, using Spearman's correlation analyses (n = 15). IA-2: Tyrosine phosphatase autoantibodies.
DISCUSSION
In recent years, increasing evidence indicated that the gut microbiota, as an environmental factor, plays an important role in the development of T1DM. The intestinal microbiota, which was regarded as a vital human organ, is affected by various factors in the forming process.[16,17] The mode of delivery at birth, the duration of breastfeeding, and early feeding in infancy with complex dietary proteins such as cow's milk proteins can participate in the development of gut microbiota and beta-cell autoimmunity.[18,19] To better understand the relationship between gut microbiota and T1DM, we excluded the potential interference factors such as delivery mode and breastfeeding duration, and matched patients and controls with age, gender, race, and dietary habits.
Our results showed that the richness of gut microbiota was significantly lower in T1DM children than that in healthy controls. Giongo et al.[20] reported that children with autoimmune disorders possessed microbiota with lower diversity and stability. The microbiota structure was remarkably different between the two groups, especially the Blautia had an obvious increasing in the T1DM children, whereas the proportion of Haemophilus, Lachnospira, Pasteurellales, Pasteurellaceae, Intestinimonas, Micrococcales, Dialister, and Caulobacterales was decreased. As we know, the phylum Firmicutes is the dominant phyla of intestinal microbiota in healthy people. In the previous studies, the level of Firmicutes and the ratio of Firmicutes to Bacteroidetes were decreased in T1DM children.[12,21] Although no significant difference was found in the phylum level in this study, some phyla belonging to the Firmicutes such as Lachnospira, Dialister, Intestinimonas, and Caulobacterales in the genus or species level were reduced apparently, indicating that the alterations of Firmicutes were involved in the development of T1DM. In addition, Intestinimonas, a newly isolated Gram-positive and anaerobic bacteria, which mainly transforms undigested carbohydrates into butyrate in intestine,[22] was decreased dramatically in the present study. It was reported that butyrate plays a vital role in maintaining intestinal mucosa integrity and intestinal epithelial cell growth.[23] The reduction of butyrate might contribute to T1DM development by thinning the mucus layer, affecting the tight junction, and consequently increasing gut permeability and exacerbating inflammation. Therefore, the decrease of Intestinimonas might be an indication of the potential impairment of intestinal hemostasis and the autoimmune imbalance preceding to T1DM.
In addition, we found that the relative abundance of Blautia was positively correlated with HbA1c, as well as the number of T1DM autoantibodies and the titers of IA-2. Blautia, belongs to the order Clostridiales and phylum Firmicutes, had the function of transforming the undigested carbohydrates and proteins into acetic acid, which could produce energy for the human body.[24] It has no harmful effects on normal abundance of Blautia in human. However, lots of studies showed that the abundance of Blautia was increased in many diseases such as irritable bowel syndrome, nonalcoholic fatty liver diseases, and Crohn's disease. In particular, Kostic et al.[25] reported that the abundance of Blautia was positively associated with serum lipid and glucose in the T1DM infants, which was in consistent with our present study. Several studies showed that some phyla of microbiota may involve in regulating the immune responses, leading to the imbalance of autoreactive effector T-cells (Teffs) and regular T-cells (Tregs), which might be the main mechanism in the autoimmunity of T1DM. Ather et al.[26] reported that segmented filamentous bacteriacan promote the differentiation of Th17, resulting in the increase of immune response. However, Bacteroides fragilis and Bifidobacterium might induce the development of Tregs, which could suppress immune response by means of secreting cytokines interleukin-10.[27] These studies suggested that gut microbiota has a potency of regulating T-cell differentiation. Therefore, we inferred that Blautia might influence the development of T1DM by means of regulating the autoimmunity.
The results of this study showed that there was a significant imbalance of gut microbiota at the newly diagnosed T1DM children in Chinese population and the variation of microbiota was correlated with the autoimmunity of T1DM. However, there were some limitations in our study. First, because China is a vast country, the pattern of gut microbiota in Chinese population might vary a lot due to different geographic factors. The result of our study, in which the participants were all from northern areas, could not reflect the whole picture of gut microbiota all over China. It should be confirmed by larger sample and multicenter cohort studies in future. Second, stool samples were not collected within one season, the climatic variation could have an effect on analyzing the results. Third, the alteration in amount and/or function of T-cell subsets needs further investigation to confirm the relationship between imbalance of immune activities and gut microbiota changes. Despite these limitations, our present study was very meaningful to explore the potential mechanism of gut microbiota in the development of T1DM. Our following work is to enlarge the sample pool and determine whether T-cells are regulated by gut microbiota in T1DM patients.
In summary, our study showed that gut microbiota was associated with the development of T1DM by affecting the autoimmunity, and the result suggested a potential therapy for T1DM via modulating the gut microbiota.
Financial support and sponsorship
This study was supported by grants from the National Natural Science Foundation of China (No. 81170736 and No. 81570715).
Conflicts of interest
There are no conflicts of interest.
Footnotes
Edited by: Xin Chen
REFERENCES
- 1.American Diabetes Association. Standards of medical care in diabetes-2014. Diabetes Care. 2014;37(Suppl 1):S14–80. doi: 10.2337/dc14-S014. doi:10.2337/dc14-S014. [DOI] [PubMed] [Google Scholar]
- 2.Patterson CC, Gyürüs E, Rosenbauer J, Cinek O, Neu A, Schober E, et al. Trends in childhood type 1 diabetes incidence in Europe during 1989-2008: Evidence of non-uniformity over time in rates of increase. Diabetologia. 2012;55:2142–7. doi: 10.1007/s00125-012-2571-8. doi:10.1007s00125-012-2571-8. [DOI] [PubMed] [Google Scholar]
- 3.Keskin M, Aygün A, Pehlivan S, Keskin ÖKor Y, Balat A, et al. Trends in the frequency of HLA DR-DQ haplotypes among children and adolescents with type 1 diabetes mellitus in the Southeast Region of Turkey. J Clin Res Pediatr Endocrinol. 2012;4:189–92. doi: 10.4274/Jcrpe.768. doi:10.4274/jcrpe.768. [DOI] [PMC free article] [PubMed] [Google Scholar]
- 4.Patelarou E, Girvalaki C, Brokalaki H, Patelarou A, Androulaki Z, Vardavas C. Current evidence on the associations of breastfeeding, infant formula, and cow's milk introduction with type 1 diabetes mellitus: A systematic review. Nutr Rev. 2012;70:509–19. doi: 10.1111/j.1753-4887.2012.00513.x. doi:10.1111/j.1753-4887.2012.00513.x. [DOI] [PubMed] [Google Scholar]
- 5.Rodriguez-Calvo T, von Herrath MG. Enterovirus infection and type 1 diabetes: Closing in on a link? Diabetes. 2015;64:1503–5. doi: 10.2337/db14-1931. doi:10.2337/db14-1931. [DOI] [PubMed] [Google Scholar]
- 6.Lozupone CA, Stombaugh JI, Gordon JI, Jansson JK, Knight R. Diversity, stability and resilience of the human gut microbiota. Nature. 2012;489:220–30. doi: 10.1038/nature11550. doi:10.1038/naturne11550. [DOI] [PMC free article] [PubMed] [Google Scholar]
- 7.de Vos WM, de Vos EA. Role of the intestinal microbiome in health and disease: From correlation to causation. Nutr Rev. 2012;70(Suppl 1):S45–56. doi: 10.1111/j.1753-4887.2012.00505.x. doi:10.1111/j.1753-4887.2012.00505.x. [DOI] [PubMed] [Google Scholar]
- 8.Alam C, Bittoun E, Bhagwat D, Valkonen S, Saari A, Jaakkola U, et al. Effects of a germ-free environment on gut immune regulation and diabetes progression in non-obese diabetic (NOD) mice. Diabetologia. 2011;54:1398–406. doi: 10.1007/s00125-011-2097-5. doi:10.1007/s00125-011-2097-5. [DOI] [PubMed] [Google Scholar]
- 9.Patrick C, Wang GS, Lefebvre DE, Crookshank JA, Sonier B, Eberhard C, et al. Promotion of autoimmune diabetes by cereal diet in the presence or absence of microbes associated with gut immune activation, regulatory imbalance, and altered cathelicidin antimicrobial peptide. Diabetes. 2013;62:2036–47. doi: 10.2337/db12-1243. doi:10.2337/db12-1243. [DOI] [PMC free article] [PubMed] [Google Scholar]
- 10.Calcinaro F, Dionisi S, Marinaro M, Candeloro P, Bonato V, Marzotti S, et al. Oral probiotic administration induces interleukin-10 production and prevents spontaneous autoimmune diabetes in the non-obese diabetic mouse. Diabetologia. 2005;48:1565–75. doi: 10.1007/s00125-005-1831-2. doi:10.1007/s00125-005-1831-2. [DOI] [PubMed] [Google Scholar]
- 11.Soyucen E, Gulcan A, Aktuglu-Zeybek AC, Onal H, Kiykim E, Aydin A. Differences in the gut microbiota of healthy children and those with type 1 diabetes. Pediatr Int. 2014;56:336–43. doi: 10.1111/ped.12243. doi:10.1111/ped.12243. [DOI] [PubMed] [Google Scholar]
- 12.Murri M, Leiva I, Gomez-Zumaquero JM, Tinahones FJ, Cardona F, Soriguer F, et al. Gut microbiota in children with type 1 diabetes differs from that in healthy children: A case-control study. BMC Med. 2013;11:46. doi: 10.1186/1741-7015-11-46. doi:10.1186/1741-7015-11-46. [DOI] [PMC free article] [PubMed] [Google Scholar]
- 13.Amato KR, Yeoman CJ, Kent A, Righini N, Carbonero F, Estrada A, et al. Habitat degradation impacts black howler monkey (Alouatta pigra) gastrointestinal microbiomes. ISME J. 2013;7:1344–53. doi: 10.1038/ismej.2013.16. doi:10.1038/ismej.2013.16. [DOI] [PMC free article] [PubMed] [Google Scholar]
- 14.Lozupone C, Hamady M, Knight R. UniFrac – An online tool for comparing microbial community diversity in a phylogenetic context. BMC Bioinformatics. 2006;7:371. doi: 10.1186/1471-2105-7-371. doi:10.1186/1471-2105-7-371. [DOI] [PMC free article] [PubMed] [Google Scholar]
- 15.Suchodolski JS, Foster ML, Sohail MU, Leutenegger C, Queen EV, Steiner JM, et al. The fecal microbiome in cats with diarrhea. PLoS One. 2015;10:e0127378. doi: 10.1371/journal.pone.0127378. doi:10.1371/journal.pone.0127378. [DOI] [PMC free article] [PubMed] [Google Scholar]
- 16.Groer MW, Luciano AA, Dishaw LJ, Ashmeade TL, Miller E, Gilbert TC. Development of the preterm infant gut microbiome: A research priority. Microbiome. 2014;2:38. doi: 10.1186/2049-2618-2-38. doi:10.1186/2049-2618-2-38. [DOI] [PMC free article] [PubMed] [Google Scholar]
- 17.Wu GD, Chen J, Hoffmann C, Bittinger K, Chen YY, Keilbaugh SA, et al. Linking long-term dietary patterns with gut microbial enterotypes. Science. 2011;334:105–8. doi: 10.1126/science.1208344. doi:10.1126/science.1208344. [DOI] [PMC free article] [PubMed] [Google Scholar]
- 18.Sirilun S, Takahashi H, Boonyaritichaikij S, Chaiyasut C, Lertruangpanya P, Koga Y, et al. Impact of maternal bifidobacteria and the mode of delivery on Bifidobacterium microbiota in infants. Benef Microbes. 2015;6:767–74. doi: 10.3920/BM2014.0124. doi:10.3920/BM2014.0124. [DOI] [PubMed] [Google Scholar]
- 19.Rogier EW, Frantz AL, Bruno ME, Wedlund L, Cohen DA, Stromberg AJ, et al. Lessons from mother: Long-term impact of antibodies in breast milk on the gut microbiota and intestinal immune system of breastfed offspring. Gut Microbes. 2014;5:663–8. doi: 10.4161/19490976.2014.969984. doi:10.4161/19490976.2014.969984. [DOI] [PMC free article] [PubMed] [Google Scholar]
- 20.Giongo A, Gano KA, Crabb DB, Mukherjee N, Novelo LL, Casella G, et al. Toward defining the autoimmune microbiome for type 1 diabetes. ISME J. 2011;5:82–91. doi: 10.1038/ismej.2010.92. doi:10.1038/ismej.2010.92. [DOI] [PMC free article] [PubMed] [Google Scholar]
- 21.Mejía-León ME, Petrosino JF, Ajami NJ, Domínguez-Bello MG, de la Barca TC. Fecal microbiota imbalance in Mexican children with type 1 diabetes. Sci Rep. 2014;4:3814. doi: 10.1038/srep03814. doi:10.1038/srep03814. [DOI] [PMC free article] [PubMed] [Google Scholar]
- 22.Kläring K, Hanske L, Bui N, Charrier C, Blaut M, Haller D, et al. Intestinimonas butyriciproducens gen. nov. sp. nov. a butyrate-producing bacterium from the mouse intestine. Int J Syst Evol Microbiol. 2013;63(Pt 12):4606–12. doi: 10.1099/ijs.0.051441-0. doi:10.1099/ijs.0.051441-0. [DOI] [PubMed] [Google Scholar]
- 23.Hamer HM, Jonkers D, Venema K, Vanhoutvin S, Troost FJ, Brummer TC. Review article: The role of butyrate on colonic function. Aliment Pharmacol Ther. 2008;27:104–19. doi: 10.1111/j.1365-2036.2007.03562.x. doi:10.1111/j.1365-2036.2007.03562.x. [DOI] [PubMed] [Google Scholar]
- 24.Park SK, Kim MS, Bae TC. Blautia faecis sp. nov. isolated from human faeces. Int J Syst Evol Microbiol. 2013;63(Pt 2):599–603. doi: 10.1099/ijs.0.036541-0. doi:10.1099/ijs.0.036541-0. [DOI] [PubMed] [Google Scholar]
- 25.Kostic AD, Gevers D, Siljander H, Vatanen T, Hyötyläinen T, Hämäläinen AM, et al. The dynamics of the human infant gut microbiome in development and in progression toward type 1 diabetes. Cell Host Microbe. 2015;17:260–73. doi: 10.1016/j.chom.2015.01.001. doi:10.1016/j.chom.2015.01.001. [DOI] [PMC free article] [PubMed] [Google Scholar]
- 26.Ather JL, Ckless K, Martin R, Foley KL, Suratt BT, Boyson JE, et al. Serum amyloid A activates the NLRP3 inflammasome and promotes Th17 allergic asthma in mice. J Immunol. 2011;187:64–73. doi: 10.4049/jimmunol.1100500. doi:10.4049/jimmunol.1100500. [DOI] [PMC free article] [PubMed] [Google Scholar]
- 27.Jeon SG, Kayama H, Ueda Y, Takahashi T, Asahara T, Tsuji H, et al. Probiotic Bifidobacterium breve induces IL-10-producing Tr1 cells in the colon. PLoS Pathog. 2012;8:e1002714. doi: 10.1371/journal.ppat.1002714. doi:10.1371/journal.ppat.1002714. [DOI] [PMC free article] [PubMed] [Google Scholar]


