Abstract
Increasing the volumetric imaging speed of light-sheet microscopy will improve its ability to detect fast changes in neural activity. Here, a system is introduced for brain-wide imaging of neural activity in the larval zebrafish by coupling structured illumination with cubic phase extended depth-of-field (EDoF) pupil encoding. This microscope enables faster light-sheet imaging and facilitates arbitrary plane scanning—removing constraints on acquisition speed, alignment tolerances, and physical motion near the sample. The usefulness of this method is demonstrated by performing multi-plane calcium imaging in the fish brain with a 416 × 832 × 160 µm field of view at 33 Hz. The optomotor response behavior of the zebrafish is monitored at high speeds, and time-locked correlations of neuronal activity are resolved across its brain.
Light-sheet microscopy can realize high-resolution imaging in three-dimensional (3D) volumes through optical sectioning. Combined with reduced photobleaching, these attributes have strongly motivated the continued development of light-sheet microscopy for many biological applications, whether cell biology, structural imaging, or functional imaging of neural circuits [1–5]. While the ultimate imaging speeds would be dictated by phototoxicity and the dwell times required for adequate SNR, other practical issues limit realizable speeds.
One of the bottlenecks for the sampling rate within the volume arises from the mechanical motion of the piezo-coupled microscope objective. For efficient light collection over large fields of view (FOV), large, low magnification, high numerical aperture (NA) objectives are used, which can pose a number of challenges. First, these objectives are heavy and require specialized equipment to move them along with the position of the light sheet at high speeds; further, extreme movement speeds may potentially transmit vibrations to the sample. Second, the high NA normally implies a very shallow depth of focus; therefore, accurate light-sheet scanning requires tight precision between the objective’s focal plane and the light-sheet beam to remain in good focus. Accurate mechanical alignment may not be sufficient, as there can be sample induced beam deviations from optically inhomogeneous tissue. Together with camera frame rate, these constraints limit the rate of functional light-sheet imaging in zebrafish and other samples. While the decay time course of genetically encoded calcium indicators (GECIs) is on the order of 1–2 s, the activation time is around 100 ms, so that faster imaging will make it easier to detect the onset times of fast signals.
Here, we demonstrate the use of wavefront engineering [6] in the microscope’s imaging path to enable functional imaging and arbitrary scanning of regions within the volume. This is done by adding a simple optical element to the microscope that provides for cubic phase pupil encoding—that is, it affords extended depth-of-field imaging, while still preserving the full collection NA of the objective. Because this relaxes and, in many cases, removes the need to closely coordinate the motion of the objective with that of the light sheet, it allows for faster data acquisition, as well as random access axial “jumps.” This allows the user to probe particular regions of interest, regardless of separation along the collection axis, at high rates. While recent work has shown the utility of pairing an extended depth-of-field pupil encoding with a light-sheet microscope for particle and C. elegans tracking [7], the application of this technique to neural imaging has not been demonstrated. This Letter aims to address this and discuss the necessary considerations, advantages, and design constraints particular to this application.
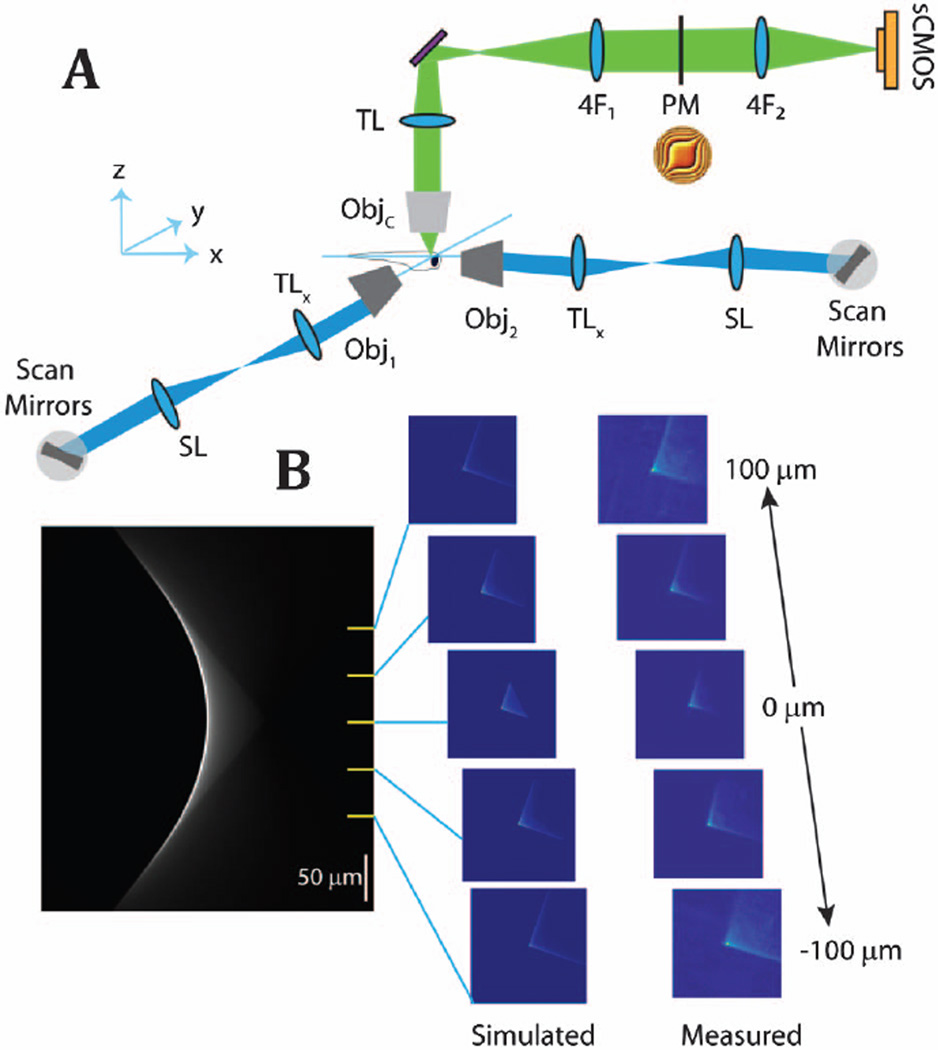
The light-sheet microscope implemented here is described by the schematic in Fig. 1 as a modification of the excitation and imaging path of the system detailed in [4]. A pair of galvonometric mirrors and an f-theta lens (SL, Special Optics 66-S80-30T-488-1100 nm) scan the excitation beam (λ = 488 nm, Omicron PhoxX, SOLE-3) to selectively excite planes of the sample. The scanning is performed through two orthogonally located objectives (Obj1 and Obj2, Olympus XLFLUOR 4 × /0.28NA) to selectively omit excitation of the ocular regions of the zebrafish by providing a complementary path to illuminate the olfactory and forebrain regions [4]. The emission light passes through the detection objective (Nikon 16 × /0.8NA), bandpass filter (525/50 nm, Semrock), and tube lens (TL, Nikon, f = 200 mm); then enters the 4f system (4F1 and 4F2, ThorLabs AC508-100-A-ML) with an XY stage that holds the phase mask (PM, custom manufactured, details reported in [8]); to image onto the camera (Orca Flash 4.0, Hamamatsu). Experimental acquisition of the EDoF point spread function closely matched that of our simulated environment, as shown in Fig. 1(b).
Fig. 1.
Schematic of the excitation and imaging path is shown in panel A. The axial dependence for this realization of the cubic-phase point spread function is shown in panel B. The left-most panel is the simulated x-z projection of the EDoF, and the right-most panel contains the experimentally acquired EDoF point spread functions.
An important feature of all phase-only pupil encoding is that the optics maintain the full allowable aperture of the system and, hence, have high efficiency and sensitivity, which is critical for fluorescence imaging. The cubic phase function remains the most notable of the many coded EDoF wavefronts, and it imparts a spatially dependent phase retardation of φ(u, υ) = 2πα(u3 + υ3), where α is the “strength” of the mask, and u and υ are normalized pupil coordinates [6]. Similar to previous reports, α was chosen to balance the trade-off between PSF axial invariance and the loss of contrast for high spatial-frequency features. The best compromise was found at α = 34, realized by rescaling the pupil onto the phase mask with the telescope lenses reported earlier (4F1 and 4F2). Using commercial, off-the-shelf alternatives of different focal lengths and, therefore different projected pupil sizes, the f = 100 mm system was the limit before significant axial variance was observed. This signified the design point where the spatial localization of the PSF is minimized (preserving higher spatial-frequency components) while maintaining approximate axial invariance (preserving the original justification [6]).
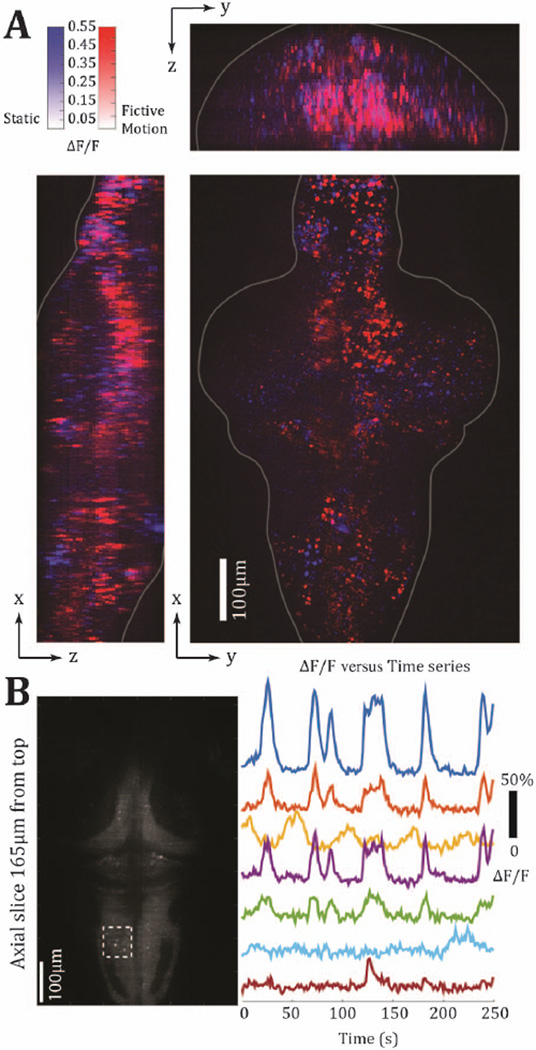
Raw images acquired with cubic phase encoding are distorted compared to traditional “in-focus” images, and processing is typically required to recover morphologies [7,9] or cleanly extract functional activity [10]. The Richardson–Lucy deconvolution (25 or 50 iterations) was found to have fewer artifacts than the Wiener deconvolution and was used exclusively in the results reported here. Although the cubic phase point spread function (PSF) is similar over a wide axial range, it is not completely invariant, and the best results were found using axially dependent deconvolution kernels, supporting the conclusions reached in [7]. By applying the axially variant restoration, images were easily restored, yielding single-cell resolution (Fig. 3).
Fig. 3.
Demonstration of functional imaging capabilities after data restoration. Panel A shows maximum-intensity projections conveying the spatial specificity of neurons responding to visual motion. Panel B shows functional traces from seven example neurons from the region indicated by the dashed box.
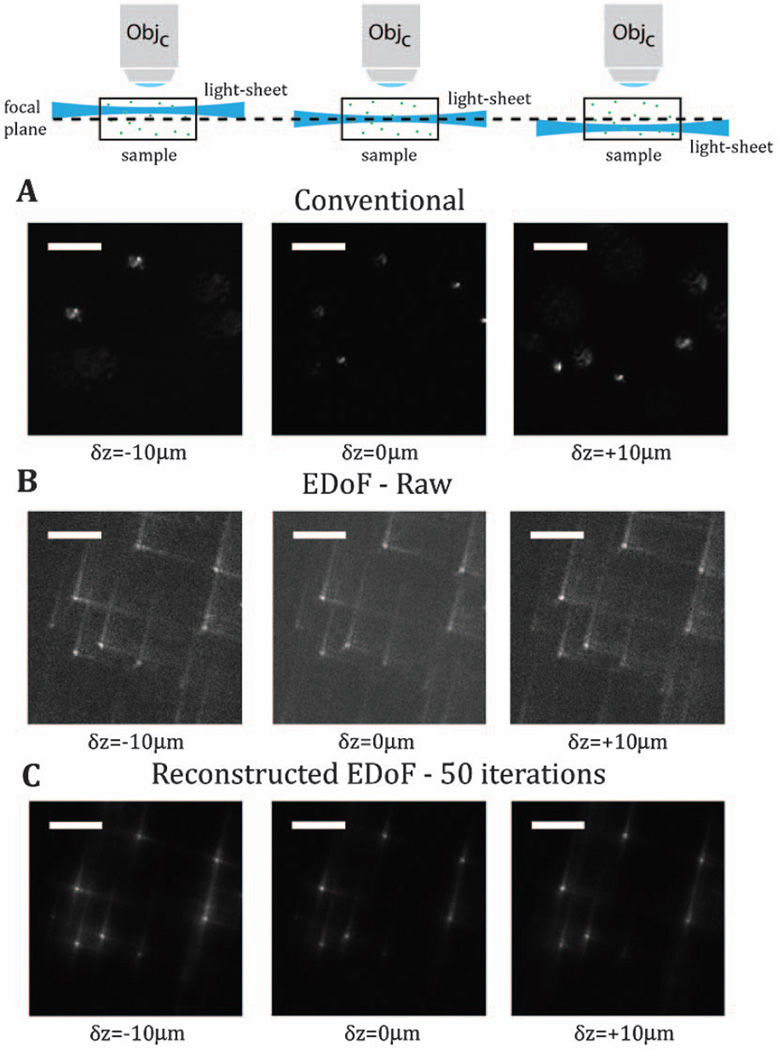
Additional utility is gained from this technique for maintaining a focused, scanning beam across the FOV of the camera. With conventional light-sheet approaches, contrast is lost as the beam is displaced axially due to misalignment or sample-induced aberrations. As a proxy example of this, in Fig. 2, we present the results when the scanning beam is defocused in 10 µm intervals in an agarose sample loaded with 1 µm fluorescent beads (TetraSpeck, Life Technologies). In panel Fig. 2(a), the contrast of the beads present at δz = 0 is lost as the scan beam is shifted. As can be seen in the native images of the proposed imaging system in Fig. 2(b), the contrast of the beads is maintained throughout that defocus range. Figure 2(c) demonstrates that deconvolution can restore the intermediate image in Fig. 2(b) to maximize the contrast. Note that the same PSF was used for all panels in the reconstruction. This demonstration is of relevance because, even when the objective can be moved, the use of an extended depth-of-field element can relax the precision required between the light sheet and the nominal focal plane, greatly simplifying alignment with high NA objectives. This is also likely to improve imaging in inhomogeneous samples with curved or tilted surface boundaries, which will deflect the light sheet from its optically perfect position [11].
Fig. 2.
With conventional light-sheet microscopy, the tilt of the scanning beam results in out-of-focus imaging and loss of contrast of the scene in the focal plane. Panel A experimentally captures this loss of information through deterministic axial shifts of the scan beam as a controlled proxy for beam tilt. Panel B gives examples of the native images in the EDoF light-sheet system. Panel C demonstrates the results from deconvolving these images. The scale bar is 20 µm.
Prior to each day’s bout of functional imaging experiments, we measured the axial point spread function of the system, PSF(x, y; zn), by imaging 1 µm fluorescent beads (TetraSpeck, Life Technologies) suspended in agarose. The sample was imaged from δz = ±100 µm in 5 µm intervals to match typical imaging conditions. A custom code written in MATLAB identified all of the puncta, or central lobes of the cubic phase PSF, in a manually selected volume containing between 10 and 20 beads at each plane, zn. For each planar image, iexp (x, y; zn), the spatial locations of these puncta were used to synthesize an image containing only the estimate of the source locations, is(x, y; zn). Assuming the relationship iexp (x, y; zn) = PSF(x, y; zn) ⊗ is(x, y; zn) + s, where s is a random noise term [9], Richardson–Lucy deconvolution of these data sets are used to generate a reduced-noise, spatially averaged dictionary of PSF(x, y; zn) for all zn. This dictionary is later used for deconvolution of the experimental datasets during functional imaging.
We then used the EDoF light-sheet system to image the neural activity in larval zebrafish. A live zebrafish expressing GCaMP6s or GCaMP6f in most neurons localized to the nucleus (Tg(elavl3:H2B − GCaMP6s/f)jf5/jf7) was embedded in low-melting point agarose and placed in the microscope chamber with a diffusive screen underneath the fish on which visual scenes were projected [4]. A grating (in red and black, chosen to avoid crosstalk with the green fluorescence channel) of spatial period ~1.2 cm moving forward, from tail to head, at a speed of 0.24 cm/s was presented to the fish, alternating between periods of static stimulus and motion. Such forward moving visual motion elicits strong fictive swimming, consistent with the optomotor response (OMR), in which larval zebrafish swim along with the direction of whole-field motion.
First, to assess the basic performance of the system, we imaged behavioral trials under conditions (e.g., illumination power, acquisition speed) reported in [4]. Behavioral trials were employed to estimate performance according to a regional analysis of functional activity. The trials included the phase mask in the imaging path, with the objective kept static. In all trials, the light sheet sampled the volume in 5 µm intervals from z = 0 to 200 µm (alternatively, δz = ±100 µm, according to Fig. 1), and the volume acquisition rate was 1.5 Hz with 2048 × 2048 pixels collected per image (12 ms exposure). After using the PSF dictionary described earlier to restore the experimental images (10.6 s per image per CPU core on an Intel Xeon E5-1650 CPU at 3.5 GHz with 32GB RAM), we then examined the global activity patterns across the brain, after averaging four trials (20 s motion, 20 s static scene). A comparison of the deconvolution results in Fig. 3(a) with those reported for conventional imaging systems [4] reveals that the functional activity patterns are similar, with sufficient SNR, Fig. 3(b), and that cellular resolution is maintained following reconstruction in most parts of the brain. One potential consequence of regularized deconvolution for the light-sheet images is that there can be some signal loss at high frequencies, which could make sparse and weak image features even weaker, something that has been described earlier [7,9]. Nevertheless, it appears that basic activity patterns are well preserved. This enables the potential for non-sequential axial scanning techniques and also axial scanning at rates beyond the limits imposed by piezo-mounted microscope objectives.
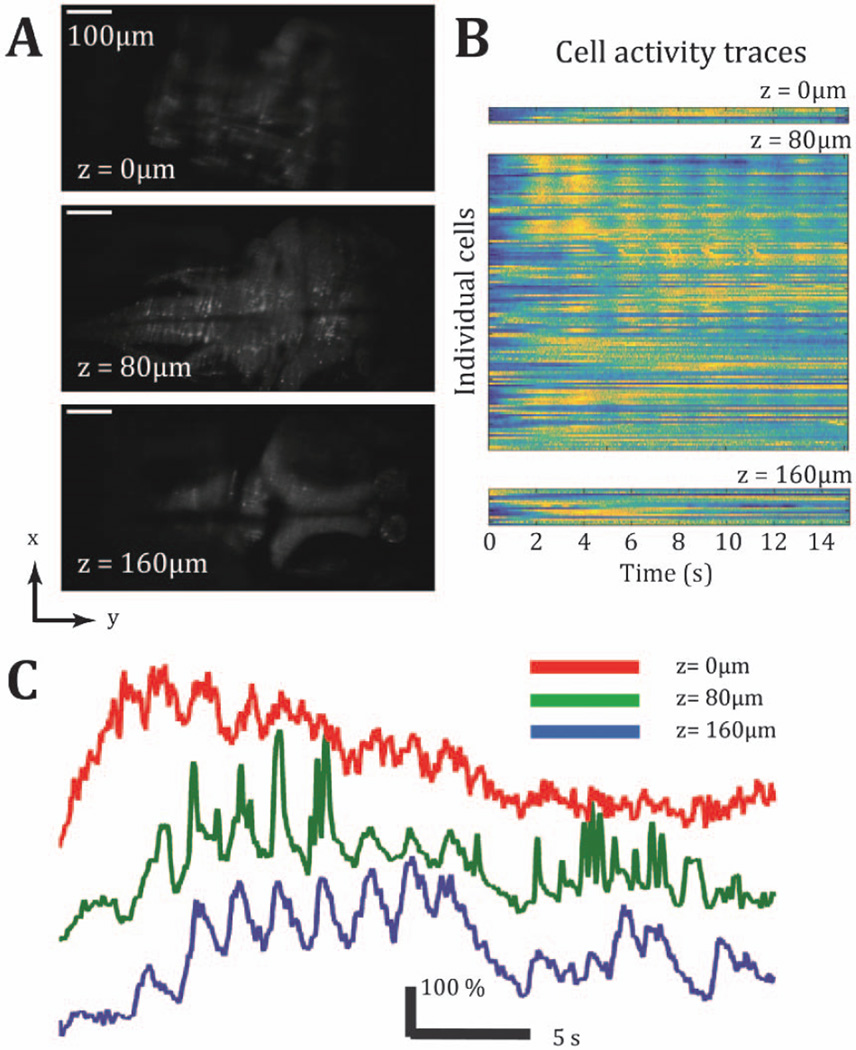
To demonstrate the utility of wavefront-coded microscopy for faster functional data acquisition, OMR trials were initiated by selecting three axial planes—uniformly displaced by 80 µm intervals to span the entire volume of interest. Acquisition was at the maximum data rate (frame exposure times were scaled for 2048 × 1024 pixel acquisition at 6 ms) to perform selective acquisition of randomly selected slices at a volume rate of 33 Hz. The regional activity remains consistent and, as shown in Fig. 4, can be assigned to individual neurons, Fig. 4(b). Of particular note is that this data revealed periodic fluctuations of activity in individual neurons, Fig. 4(c), with onsets that would be grossly undersampled and potentially missed altogether by the 1.5 Hz volume sampling.
Fig. 4.
Three axial planes are serially scanned in rapid succession to achieve 33 Hz sampling across a 160 µm axial range. The restored planes are presented in Panel A. Temporal traces from individual cells identified from each plane are presented in Panel B. In Panel C, temporally correlated cells, fluctuating at 0.6 Hz during a period of about 8 s, are identified across all three axial planes.
Alternatives to fast imaging with a fixed pupil-phase element have been explored, including image restoration techniques exploiting spherical aberration, along with relatively low NA objectives [12], (as opposed to an EDoF optimized aberration [6]), as well as swept confocally aligned planar excitation [13] and techniques using electro-tunable lenses (ETL) [14]. Although ETL setups have the advantage of not requiring deconvolution, a fixed pupil-phase modulation offers the advantages of mechanical simplicity, as well as allowing “random-access” scanning of the sample volume (i.e., unconstrained by a fixed axial scanning pattern, such as a sinusoid), eliminating the need for settling times. Incorporating recent advancements in parallelizing the deconvolution step by incorporating GPUs, as well as fully accounting for the 3D PSF may further improve the utility, precision, and speed when applied to this use-case [15].
In this Letter, we applied extended depth-of-field pupil encoding image acquisition to a light-sheet microscope and used it to demonstrate functional neuronal imaging over large volumes. The recovery of images with single-cell resolution in most of the brain, even at high frame rates and low image integration times, was verified. We note that for single-cell resolution throughout the brain, resolution-enhancing techniques [16] can be readily be combined with EDoF imaging. Extracting functional signals from the datasets required a computationally intensive, but straightforward, iterative deconvolution algorithm that rewards the user with the freedom to randomly select the regions to scan without any requirement for objective repositioning. The increased sampling rate can immediately yield the temporal resolution necessary to establish correlations of neural activity across a deep axial scan range with a fixed objective.
All experiments were conducted according to protocols approved by the Institutional Animal Care and Use Committee of the Howard Hughes Medical Institute, Janelia Research Campus. Zebrafish lines used for this Letter are nuclear-localized GCaMP6f line Tg(elavl3:H2B − GCaMP6f)jf7 in the nacre background, available upon request. Embryos were reared according to standard protocol at 28.5°C, and experiments were performed on animals 5–7 dpf at 22°C. Larval zebrafish were paralyzed by brief immersion into 1 mg/ml alpha-bungarotoxin solution (Invitrogen). Once paralyzed, the fish were embedded using 2% low melting pont agarose (Sigma-Aldrich, Inc.) in a custom-made chamber [4].
Acknowledgments
Funding. National Science Foundation (NSF) (0968895, 1102301, 1263236); National Eye Institute (NEI) (DP1EY024503, T32EY013933, R01EY011787); National Institute of Mental Health (NIMH) (MH100561, MH101218); Howard Hughes Medical Institute (HHMI); U.S. Army (W911NF-12-1-0594 [MURI]).
The authors thank Philipp Keller for fruitful discussions.
REFERENCES
- 1.Huisken J, Swoger J, Del Bene F, Wittbrodt J, Stelzer EH. Science. 2004;305:1007. doi: 10.1126/science.1100035. [DOI] [PubMed] [Google Scholar]
- 2.Tomer R, Khairy K, Arnat F, Keller PJ. Nat. Methods. 2012;9:755. doi: 10.1038/nmeth.2062. [DOI] [PubMed] [Google Scholar]
- 3.Ahrens MB, Orger MB, Robson DN, Li JM, Keller PJ. Nat. Methods. 2013;10:413. doi: 10.1038/nmeth.2434. [DOI] [PubMed] [Google Scholar]
- 4.Vladimirov N, Mu Y, Kawashima T, Bennet DV, Yang C-T, Looger LL, Keller PJ, Freeman J, Ahrens MB. Nat. Methods. 2014;11:883. doi: 10.1038/nmeth.3040. [DOI] [PubMed] [Google Scholar]
- 5.Panier T, Romano SA, Olive R, Pietri T, Sumbre G, Candelier R, Debrégeas G. Front. Neural Circuits. 2013;9 doi: 10.3389/fncir.2013.00065. [DOI] [PMC free article] [PubMed] [Google Scholar]
- 6.Dowski E, Cathey WT. Appl. Opt. 1995;34:1859. doi: 10.1364/AO.34.001859. [DOI] [PubMed] [Google Scholar]
- 7.Olarte OE, Andilla J, Artigas D, Loza-Alvarez P. Optica. 2015;2:702. [Google Scholar]
- 8.Quirin S, Peterka DS, Yuste R. Opt. Express. 2013;21:16007. doi: 10.1364/OE.21.016007. [DOI] [PMC free article] [PubMed] [Google Scholar]
- 9.Cathey WT, Dowski E. Appl. Opt. 2002;41:6080. doi: 10.1364/ao.41.006080. [DOI] [PubMed] [Google Scholar]
- 10.Quirin S, Jackson JJ, Peterka DS, Yuste R. Front. Neural Circuits. 2014;8 doi: 10.3389/fncir.2014.00029. [DOI] [PMC free article] [PubMed] [Google Scholar]
- 11.Turaga D, Holy TE. Biomed. Opt. Express. 2013;4:1654. doi: 10.1364/BOE.4.001654. [DOI] [PMC free article] [PubMed] [Google Scholar]
- 12.Tomer R, Lovett-Barron M, Kauvar I, Andalman A, Burns VM, Sankaran S, Grosenick L, Broxton M, Yang S, Deisseroth K. Cell. 2015;163:1796. doi: 10.1016/j.cell.2015.11.061. [DOI] [PMC free article] [PubMed] [Google Scholar]
- 13.Bouchard MB, Voleti V, Mendes CS, Lacefield C, Grueber WB, Mann RS, Bruno RM, Hillman EMC. Nat. Photonics. 2015;9:113. doi: 10.1038/nphoton.2014.323. [DOI] [PMC free article] [PubMed] [Google Scholar]
- 14.Fahrbach FO, Voigt FF, Schmid B, Helmchen F, Huisken J. Biomed. Opt. Express. 2013;21:21010. doi: 10.1364/OE.21.021010. [DOI] [PubMed] [Google Scholar]
- 15.Bruce MA, Butte MJ. Opt. Express. 2013;21:4766. doi: 10.1364/OE.21.004766. [DOI] [PMC free article] [PubMed] [Google Scholar]
- 16.Chhetri RK, Amat F, Wan Y, Höckendorf B, Lemon WC, Keller PJ. Nat. Methods. 2015;12:1171. doi: 10.1038/nmeth.3632. [DOI] [PubMed] [Google Scholar]


