Abstract
Gene regulatory networks depict the interactions between genes, proteins, and other components of the cell. These interactions often are stochastic that can influence behavior of the cells. Discrete Chemical Master Equation (dCME) provides a general framework for understanding the stochastic nature of these networks. However solving dCME is challenging due to the enormous state space, one effective approach is to study the behavior of individual modules of the stochastic network. Here we used the finite buffer dCME method and directly calculated the exact steady state probability landscape for the two stochastic networks of Single Input and Coupled Toggle Switch Modules. The first example is a switch network consisting of three genes, and the second example is a double switching network consisting of four coupled genes. Our results show complex switching behavior of these networks can be quantified.
I. INTRODUCTION
Gene regulatory circuits control essential cellular processes including cellular fate. A well known example is stochastic switch between the lysogenic state and the lytic state in phage lambda [1]. Another example is the transition into and from competence in the Bacillus subtilis [2].
Studying stochastic gene regulatory networks is challenging, as reactions often involve low copy number of molecules and may have large separation in time scale. The discrete Chemical Master Equation (dCME) provides a general framework for modeling of stochastic gene networks. However solution of the dCME remains difficult, as analytical solution is generally not possible. Computational methods, on the other hand, encounter the problem of enormous state space. For example for the system with 15 molecular species, each of which has 10 molecules at most, the state space size is 1015, and correspondingly the system of 1015 ordinary differential equations has to be solved. Therefore it is necessary to truncate the state space with the hope of maintaining sufficient accuracy. The finite state projection provides a method for directly solving the time evolution, however it cannot be used to calculate steady state distribution because of the introduction of the absorbing state, whose probability increases with time [3].
Here we apply the previously described Finite Buffer method, which allows efficiently enumerating state space according to predefined error tolerance, to directly calculate the steady state solution of dCME for two modules of gene regulatory networks. The first example is the single input module, consisting of three genes in which the product of the first gene inhibits the expression of the two other genes. At the same time the inhibiting gene is activated by these two other genes it inhibits. Another example is that of two coupled toggle switch. The four genes in the system are connected pairwise, so protein product can be produced when corresponding pairs of genes are inhibited. The first model consists of 7 molecular species, and the second system 12 species. Both systems are general network motifs widely found in biological systems. Our results show that the exact steady state probability landscape of two these networks can be obtained using Finite Buffer method.
II. Models and Methods
A. Discrete Chemical Master Equation
Consider a well-mixed biochemical system with constant volume and temperature. Assume this system contains n molecular species Xi which participate in m reactions Rk with reaction rate constants rk. The microstate of the system at time t is represented by the non-negative integer column vector of copy numbers of each molecular species: x(t) = (x1(t), x2(t), ⋯, xn(t))T, where T denotes the transpose. An arbitrary reaction Rk (k = 1, 2, ⋯, m) with intrinsic rate rk takes the general form:
which brings the system from a microstate xi to xj. The difference between xi and xj is the stoichiometry vector sk of the reaction . The stoichiometry matrix S for the reaction network is defined as: S = (s1, s2, ⋯, sm) ∈ ℤn × m; where each column represents a single reaction. The rate Ak(xi, xj) of reaction Rk that transforms microstate from xi to xj is determined by the intrinsic rate constant rk and the combination number of relevant reactants in the current microstate .
All possible microstates that the system can visit from a given initial condition over time t form the state space: 𝒮 = {x(t)|x(0), t ∈ (0, θ)}. We denote the probability of each microstate at time t as p(x(t)), and the probability distribution at time t over the whole state space as p(t) = {(p(x(t))|x(t) ∈ 𝒮)}: And, p(t) is also called the probability landscape of the network [1].
Discrete chemical master equation (dCME) is a set of linear ordinary differential equations describing the probability changes of each discrete microstate of the system over time. The dCME of an arbitrary microstate x = x(t) is:
| (1) |
where x′ ≠ x.
The Eqn. (1) can be further represented in matrix form:
For any xi, xj ∈ 𝒮, where A ∈ ℝ|𝒮| × |𝒮| is called the transition rate matrix formed by the collection of all A(xi, xj):
B. Finite Buffer State Space Enumeration Method with Multiple Buffers
We have developed an algorithm previously to optimally enumerate state space of arbitrary biological network, and solve the steady state probability landscape of the dCME, when an initial state is given [1], [4]. When the network is an open system, i.e., containing synthesis and degradation reactions, one finite buffer of virtual molecules is assigned to the network to limit the total copy number of species that can be synthesized.
However, to more efficiently enumerate the state space our finite buffer method can be further improved by using multiple buffers and empirically estimating the error of state space truncation for each individual buffer. This novel method has been developed in [5]. Briefly, we can partition reactions into different independent reaction groups (IRG), each of which contains reactions sharing the common species participating in synthesis and degradation type processes. We then assign different buffers to each different IRG. We can estimate the error of the dCME solution due to the finite buffer size by calculating the total probability of boundary states, which are microstates with at least one buffer depleted. Therefore, each IRG can be bounded by a separate buffer, and the minimal buffer size can be determined by comparing the error estimate of the buffer to the desired error tolerance. If the estimated error is larger that the error tolerance, the buffer size needs to be increased. Otherwise, the buffer size can be reduced to save memory space.
The error of each buffer is related to the ratio between synthesis and degradation reaction rate constants in the corresponding IRG. When the ratio is larger, the IRG has larger error with the same buffer size, or equivalently, a larger buffer is required for the IRG to achieve the same error. We develop an approach to estimate the size of each buffer a priori as 2 × s/d, where s and d are the synthesis and degradation rate constants in the IRG. We then iteratively adjust the buffer size until the pre-defined error tolerance is reached.
In the Results section, we study two important gene regulatory networks using this improved finite buffer method. We show the estimation of buffer sizes based on synthesis/ degradation ratio in each IRG, as well as the steady state probability landscapes of the dCME.
III. Results
A. Single Input Network module
Single input network motif can be found in many biological networks, in which multiple genes are regulated by the expression of a single transcription factor [7]. Here we study a simple network of three genes with two of them controlled by a master gene (Fig. 1). The molecular species, reactions and their rate constants are shown below:
This model consists of three genes GeneA, GeneB, and GeneC, expressing protein products A, B and C, respectively. Protein monomer A can bind to promoter sites of GeneB and GeneC to form protein-DNA complexes BGeneB and BGeneC, respectively, to turn off the expression of the other gene. At the same time, both genes GeneB and GeneC activate the expression of GeneA, so protein A can be synthesized if the binding sites of both GeneB and GeneC are not occupied. We take the parameters as: k1 = k3 = 0.005/s, k2 = k4 = 0.1/s, k5 = 20/s, k7 = 10/s, k9 = 11/s, k6 = k8 = k10 = 1/s.
Fig. 1.
Single Input Network module
Three IRGs are identified for this model as , and . Each is assigned a separate buffer.
We predefine the error tolerance for all of the buffers to be 1 × 10⁻⁵. When estimating the error for , we consider the extreme cases in which protein A is synthesized at the maximum rate, but degraded at the minimum rate. This corresponds to the case in which GeneB and GeneC are constantly turned off. We pre-estimate the buffer size of as 2 × k5/k6 = 40. We further reduce the error by increasing the buffer size by 1 at a time, if the boundary probability is larger than the tolerance 1 × 10⁻⁵. Otherwise, if the boundary probability is smaller than the tolerance, we decrease the buffer size by 1 at a time to achieve further saves on memory space. We obtain the final minimal buffer size for to be 44. Similarly we obtain the minimal buffer sizes for the other two IRGs and to be 27 and 28, respectively. The enumerated state space consists of 142, 912 states. The sparse transition rate matrix contains a total of 1, 016, 135 non-zero elements.
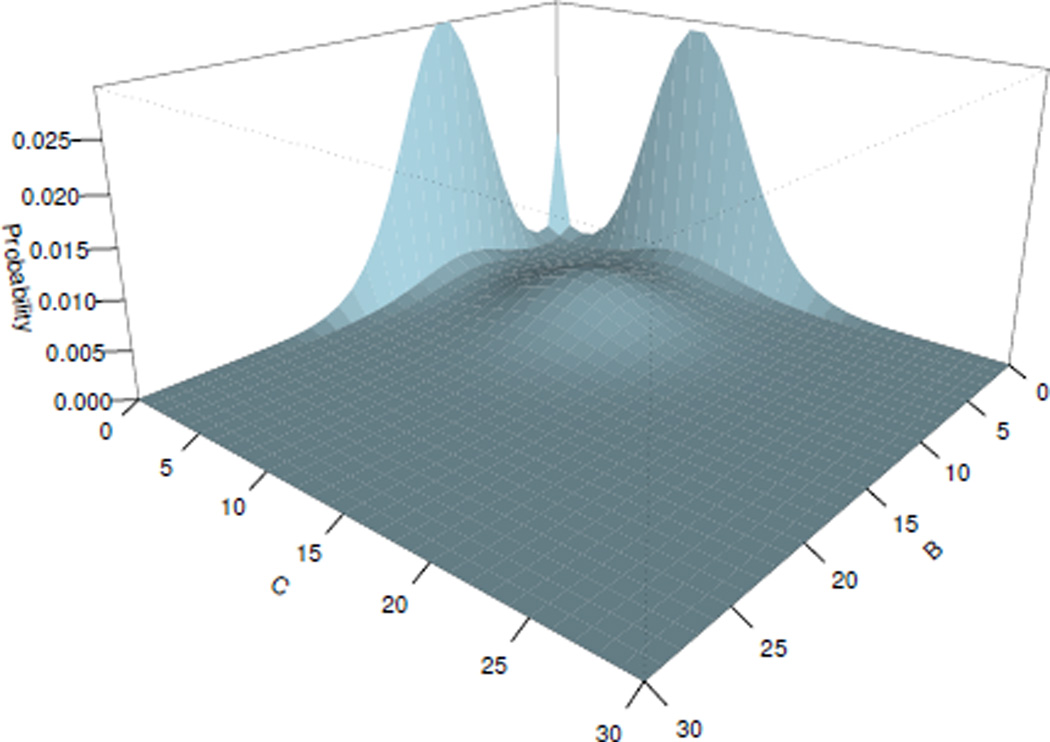
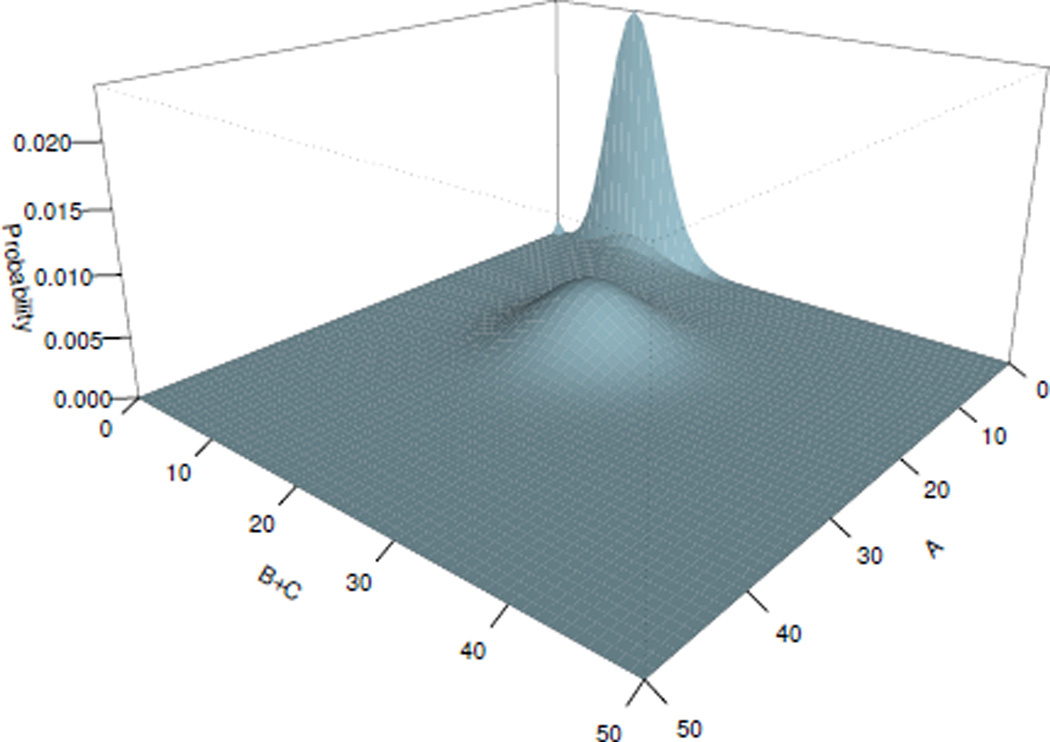
For this switch network, the steady state probability was computed and shown on Fig. 2, 3, with errors for each IRG as: and , which are all smaller than the predefined error tolerance 1 × 10⁻⁵.
Fig. 2.
Steady state probability landscape for proteins B and C
Fig. 3.
Steady state probability landscape for proteins A and B+C
The computed steady state probability landscape of species B and C is plotted on Fig. 2, in which the switch between proteins B and C can be seen. When GeneB (GeneC) is bound, protein A synthesis is suppressed, which leads to the reduction of its concentration. The probability of GeneC (GeneB) to be repressed decreases, and the number of molecules of protein C (B) increases. Fig. 3 shows the expression level of GeneA versus the total expression level of GeneB and GeneC. Oscillating behaviors can be inferred of this network. Probability of the expression of GeneB and GeneC is high, when the concentration of the protein A is low. When both genes GeneB and GeneC are unbound, the concentration of the protein A increases. We can therefore infer the following scenario: the increase of the protein A leads to the increase of the probability of GeneB or GeneC to be bound, but once one of them is inhibited, it leads to the immediate reduction of the amount of molecules of the protein A.
B. Two coupled toggle switch network
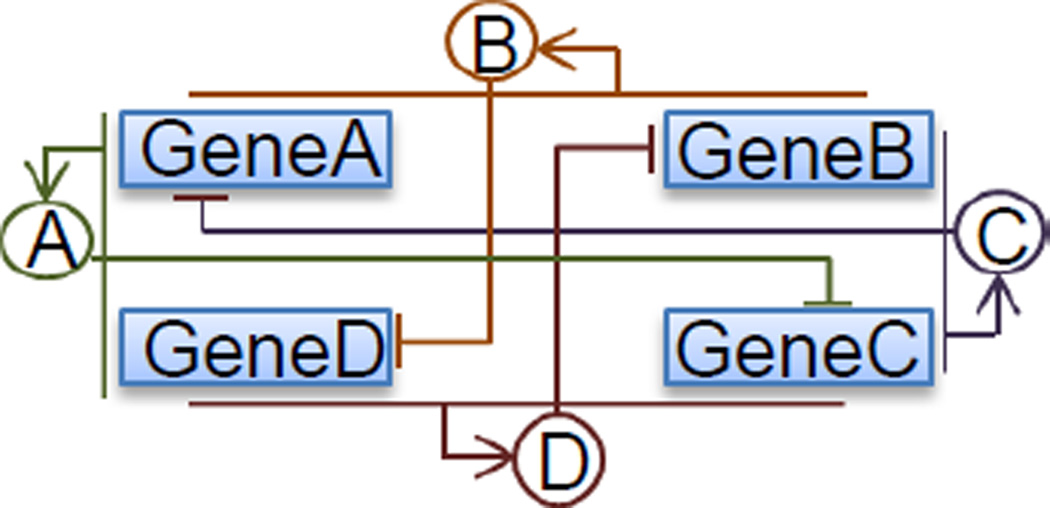
Toggle switches are an important class of biological networks playing critical roles in many biological processes, such as cell fate determination [4]. Here we studied the behavior of a biological network consisting of two coupled toggle switches (Fig. 4). The molecular species, reactions and their rate constants are shown below:
This model consists of four genes GeneA, GeneB, GeneC, and GeneD, expressing protein products A, B, C, and D, respectively, in the way that GeneA and GeneC, GeneB and GeneD repress each other pairwise. Namely GeneA (GeneB) product monomer A (B) turns off the expression of GeneC (GeneD), when forming protein-DNA complex BGeneC (BGeneD), analogously GeneC (GeneD) product monomer C (D) turns off the expression of GeneA (GeneB), when forming protein-DNA complex BGeneA (BGeneB). In the same time protein A can be synthesized, if the binding sites of both GeneA and GeneD are not occupied, protein B can be synthesized if the binding sites of both GeneA and GeneB are not occupied, protein C can be synthesized if the binding sites of both GeneC and GeneB are not occupied, protein D can be synthesized if the binding sites of both GeneD and GeneA are not occupied. We take the parameters as: k1 = k3 = k5 = k7 = 0.006/s, k2 = k4 = k6 = 0.1/s, k9 = k13 = 3/s, k11 = k15 = 4/s, k10 = k12 = k14 = k16 = 1/s. Four IRGs are identified for this model: , and each is assigned a separate buffer.
Fig. 4.
Two coupled toggle switch network
We predefine the error threshold for all of the buffers to be equal 1 × 10⁻⁵. When estimating the error for , we consider the extreme cases in which A is synthesized at the maximum rate, but degraded at the minimum rate. This corresponds to the GeneB is constantly turned off. Following the same approach as in the first example, we determine the minimal buffer sizes that can satisfy the predefined error tolerance ε = 10−5 for all four IRGs , and to be 15, 17, 15, and 17, respectively. The enumerated state space consists of 1, 177, 225 states. The sparse transition rate matrix contains a total of 11, 339, 253 non-zero elements.
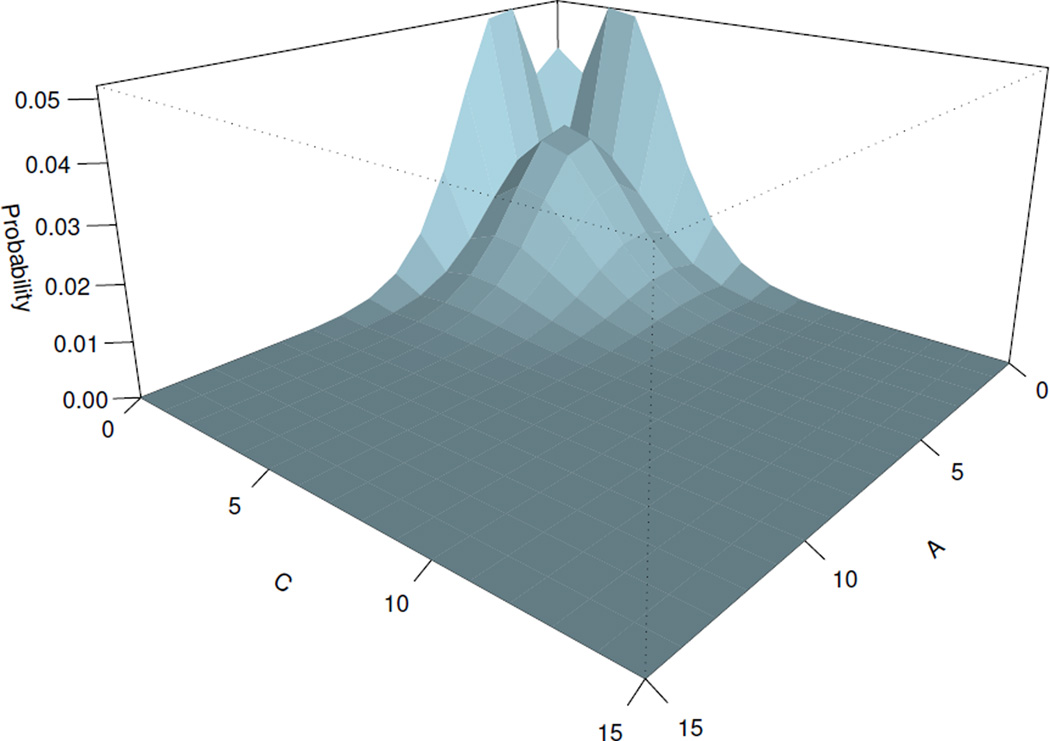
For this switch network, the steady state probability was found and shown on Fig. 5, 6 with errors for each IRG: , and which are smaller than the predefined error tolerance 10−5.
Fig. 5.
Steady state probability landscape for proteins A and C
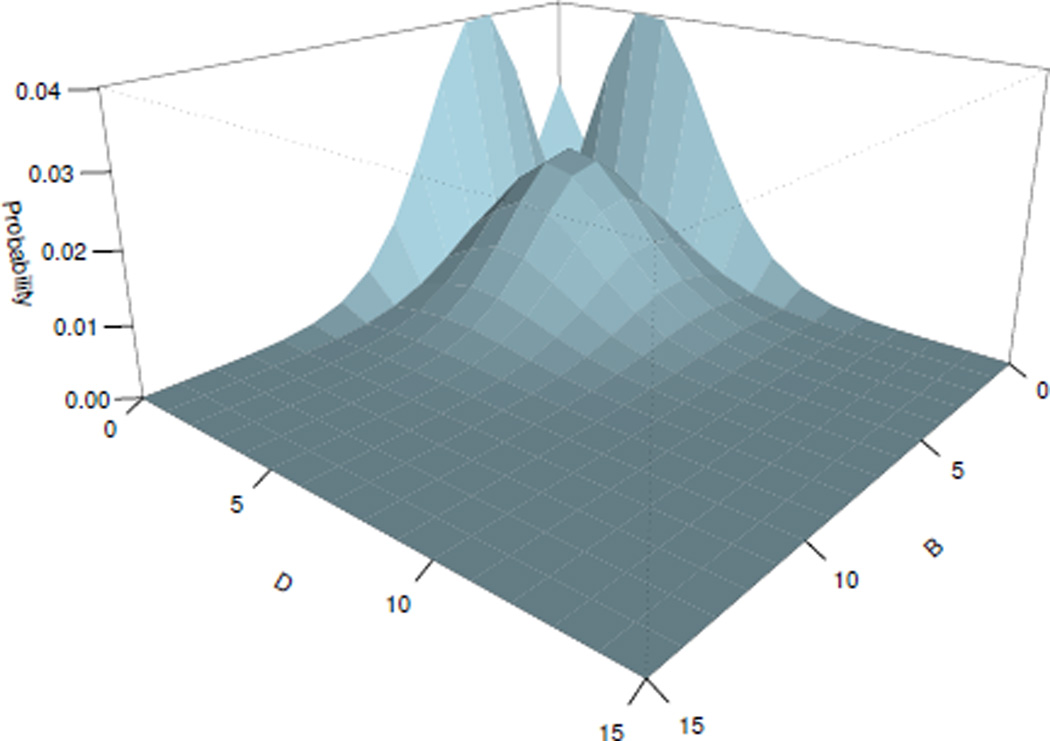
Fig. 6.
Steady state probability landscape for proteins B and D
The steady state probability landscape of species A and C is plotted on Fig. 5. The steady state probability landscape of species B and D is plotted on Fig. 6. Switching behavior of each gene pairs is shown in both plots. For example, for the pair of proteins A and C (Fig. 5), we can observe that the increase of the concentration of the protein C leads to the increase of the probability of GeneA to be bound, as well as the reduction of the concentration of the protein A. There is an opposite effect as well: the increase of the concentration of protein A leads to the decrease of the concentration of the protein C.
IV. Conclusion
Here we present results of exact calculation of steady state probability landscape of two stochastic network modules that are widely found in biological circuits [7]. Our results show that their probability landscape can be studied in details using the Finite Buffer dCME Method.
Acknowledgments
Support from NIH Grants GM079804, GM086145 and NSF Grants DBI 1062328 and the Chicago Biomedical Consortium are gratefully acknowledged.
References
- 1.Cao Y, Lu H-M, Liang J. Probability landscape of heritable and robust epigeneric state of lysogeny in phage lambda. Proceedings of the National Academy of Sciences of the United States of America. 2010;107(43):18445–18450. doi: 10.1073/pnas.1001455107. [DOI] [PMC free article] [PubMed] [Google Scholar]
- 2.Schultz D, Jacob E-B, Onuchic JN, Wolynes G. Molecular level stochastic model for competence cycles in Bacillus subtilis. Proceedings of the National Academy of Sciences of the United States of America. 2007;30(1):17582–17587. doi: 10.1073/pnas.0707965104. [DOI] [PMC free article] [PubMed] [Google Scholar]
- 3.Munsky B, Khamash M. The finite state projection algorithm for the solution of the chemical master equation. The Journal of Chemical Physics. 2006;124(4):044104. doi: 10.1063/1.2145882. [DOI] [PubMed] [Google Scholar]
- 4.Cao Y, Liang J. Optimal enumeration of state space of finitely buffered stochastic molecular networks and exact computation of steady state landscape probability. BMC Systems Biology. 2008;2(1):30. doi: 10.1186/1752-0509-2-30. [DOI] [PMC free article] [PubMed] [Google Scholar]
- 5.Cao Y, Terebus A, Liang J. Direct Solution of Discrete Chemical Master Equation For Both Time Evolution and Steady State Using Multi-Finite Buffer State Space Enumeration Method Manuscript. 2014 [Google Scholar]
- 6.Tian JP, Kannan D. Lumpability and commutativity of Markov processes. Stochastic analysis and Applications. 2006;24(3):585–702. [Google Scholar]
- 7.Alon U. Network motifs: theory and experimental approaches. Nature Reviews Genetics. 2007;(8):450–461. doi: 10.1038/nrg2102. [DOI] [PubMed] [Google Scholar]


