Abstract
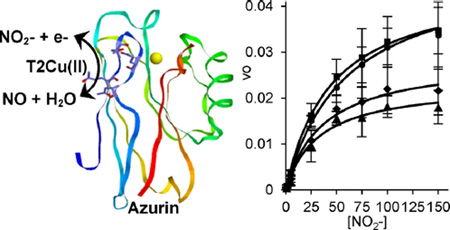
Nitrite reductase (NiR) activity was examined in a series of dicopper P.a. azurin variants in which a surface binding copper site was added through site-directed mutagenesis. Four variants were synthesized with copper binding motifs inspired by the catalytic type 2 copper binding sites found in the native noncoupled dinuclear copper enzymes nitrite reductase and peptidylglycine α-hydroxylating monooxygenase. The four azurin variants, denoted Az-NiR, Az-NiR3His, Az-PHM, and Az-PHM3His, maintained the azurin electron transfer copper center, with the second designed copper site located over 13 Å away and consisting of mutations Asn10His,Gln14Asp,Asn16His-azurin, Asn10His,Gln14His,Asn16-His-azurin, Gln8Met,Gln14His,Asn16His-azurin, and Gln8His,Gln14His,Asn16His-azurin, respectively. UV–visible absorption spectroscopy, EPR spectroscopy, and electrochemistry of the sites demonstrate copper binding as well as interaction with small exogenous ligands. The nitrite reduction activity of the variants was determined, including the catalytic Michaelis–Menten parameters. The variants showed activity (0.34–0.59 min−1) that was slower than that of native NiRs but comparable to that of other model systems. There were small variations in activity of the four variants that correlated with the number of histidines in the added copper site. Catalysis was found to be reversible, with nitrite produced from NO. Reactions starting with reduced azurin variants demonstrated that electrons from both copper centers were used to reduce nitrite, although steady-state catalysis required the T2 copper center and did not require the T1 center. Finally, experiments separating rates of enzyme reduction from rates of reoxidation by nitrite demonstrated that the reaction with nitrite was rate limiting during catalysis.
Graphical abstract
INTRODUCTION
Copper nitrite reductase (NiR) catalyzes the reduction of nitrite ions to nitric oxide within bacterial dissimilatory denitrification pathways that convert nitrate ions to dinitrogen gas.2,3 The enzyme contains two different copper centers.4 One center is classified as a type 1 (T1) copper center, with a characteristic intense blue color (absorption ~600 nm), narrow EPR hyperfine splitting value (~60 G), and an electron transfer function.5,6 The other center is a characteristic type 2 (T2) copper center with a weakly absorbing Cu(II) ion, broad EPR hyperfine coupling constants (~150 G), and catalytic function.5,6 NiR and related proteins have been referred to as noncoupled dinuclear copper proteins, as the two ions have undetectable magnetic coupling and are separated by over 12 Å.7,8
Native NiR activity, or the acceleration of conversion of nitrite to nitric oxide by the enzyme, utilizes two copper ions to fulfill the one-electron reduction of nitrite. The native enzyme is quite efficient with reported turnover numbers of 8 s−1 9 to 4000 s−1 10.11–20 Since KM values for nitrite by native NiRs are often in the micromolar range (14 µM18 to 500 µM,21 with 50 µM being common9,12,13,20,22–25), the catalytic efficiencies (kcat/KM) fall in the 105–107 s−1 M−1 range.9,13 NiRs are therefore very efficient, as diffusion-controlled limits for enzymes in general are 108–109 M−1 s−1.
Synthetic models of copper NiR have been prepared and characterized (see for example refs 26–28), including models that bind nitrite or NO. Because only a single copper ion is theoretically needed for the one-electron reduction of nitrite, some of these complexes demonstrated activity by reaction with nitrite to produce NO either in organic solvent29 or in aqueous systems.30–35 The observed activity has ranged from single turnover30,36–43 between the reduced form of the model and nitrite to full catalytic turnover in a few models.29–35 For example, recent studies of de novo designed copper binding helical peptides report nitrite reduction to NO at significant levels above background.35 Small-molecule models using a bipyridylamine ligand functioned electrocatalytically on an electrode surface.31–33 The reported turnover numbers for these and other model systems are less than those for the native systems and range from 1 × 10⁻⁴ to 5 s−1,29,31–35 while reported KM values are larger at 1–15 mM,31–33 and the resulting kcat/KM values are 10–60 s−1 M−1.31–33 These complexes all contain a single copper ion per molecule that mimics the catalytically active T2 center in native Cu NiRs.
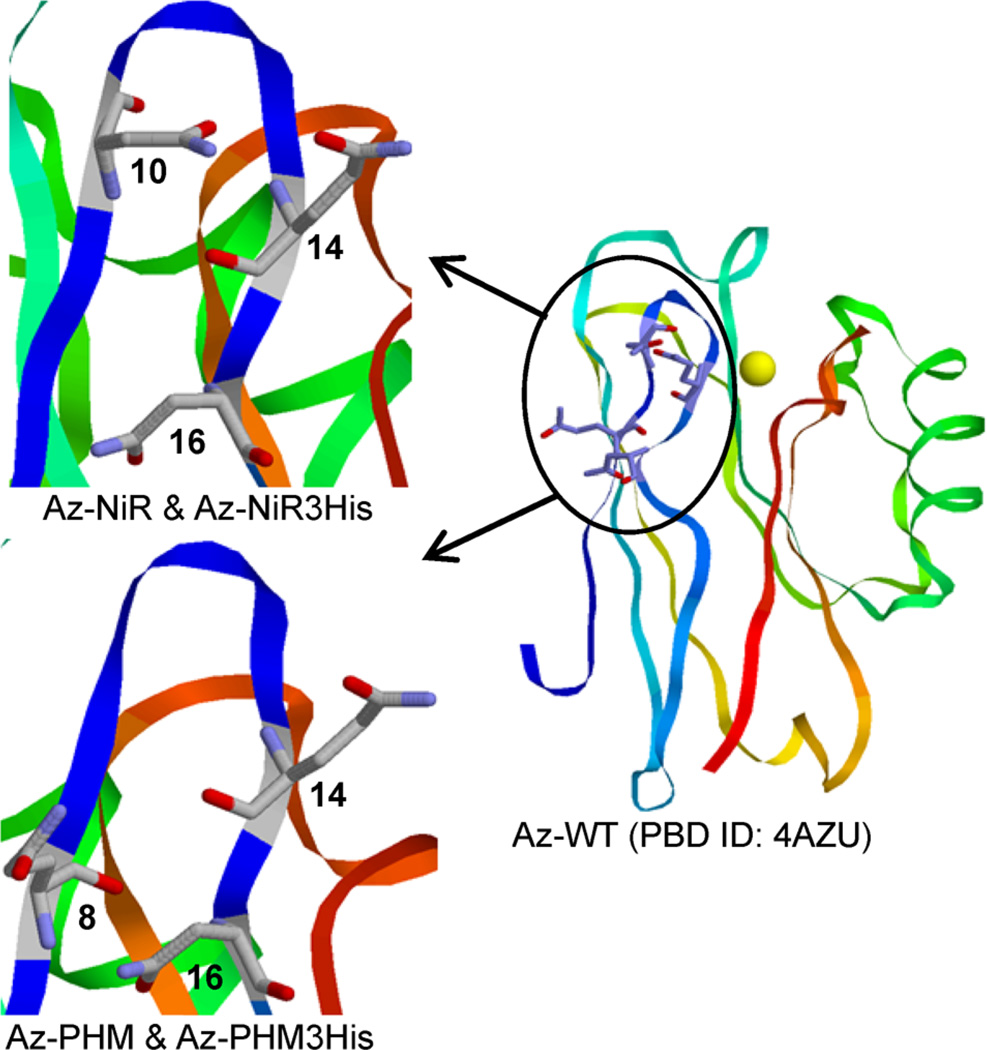
Here we report the nitrite reduction activity of four models of NiR designed into the small soluble T1 copper protein azurin. The four variants were designed after comparisons of azurin to native enzymes containing T2 catalytic Cu sites. NiR and peptidylglycine α-hydroxylating monooxygenase (PHM) contain solvent-exposed T2 catalytic copper sites, in addition to a distant electron transfer copper center. Two models in azurin, denoted Az-NiR and Az-PHM,44 were constructed by adding a second surface copper binding site in addition to the existing blue copper center (Figure 1). The amino acids mutated for the designed T2 copper site were Asn10His,Gln14Asp,Asn16His in Az-NiR and Gln8Met,Gln14His,Asn16His in Az-PHM.44 These particular residues were identified because their arrangement on an antiparallel β-sheet region of azurin resembled that of the T2 copper sites in NiR and PHM, respectively. The three residues in azurin emulated the triangular facially coordinating arrangement of residues in the native copper centers.44 Furthermore, as in the native systems, these residues were solvent exposed and estimated to be 14 and 15 Å away from the T1 Cu center in Az-NiR and Az-PHM, respectively. These two models in azurin therefore contained an added T2 copper center with two His and a potential third ligating amino acid: Asp in Az-NiR or Met in Az-PHM. In addition, the third and fourth azurin variants presented here incorporate three histidines in the designed T2 copper binding site by changing the Asp or Met in the above variants, respectively, to give rise to Az-NiR3His (Asn10-His,Gln14His,Asn16His-azurin) or Az-PHM3His (Gln8His,Gln14His,Asn16His-azurin). Here we report the NiR activity of these four NiR models along with their spectroscopic characterization.
Figure 1.
Antiparallel β-sheet section on the surface of Az-WT where mutations were made to model the catalytic T2 Cu binding site of NiR: (upper left) Az-NiR (Asn10His, Gln14Asp, Asn16His) and Az-NiR3His (Asn10His, Gln14His, Asn16His) T2 sites; (lower left) Az-PHM (Gln8Met, Gln14His, Asn16His) and Az-PHM3His (Gln8His, Gln14His, Asn16His) T2 sites. Images made from PDB ID 4AZU.1
MATERIALS AND METHODS
Reagents
All chemicals were of reagent grade or higher and used without further purification. The gene for P. aeruginosa azurin in a pET9a plasmid was kindly provided by Prof. Yi Lu (University of Illinois Urbana-Champaign, Urbana, IL) with permission from Prof. John H. Richards (California Institute of Technology, Pasadena, CA).45
Mutagenesis of the Azurin Scaffold
The models of NiR were designed into the P.a. azurin scaffold as described previously.44 To design the 3-histidine-containing active sites in azurin, the crystal structure of azurin (PDB ID: 4AZU1) was compared with that of NiR (PDB ID: 1NIR46) using RasWin Version 2.7.5.2. Upon identification of the desired mutations, pDRAW32 1.0 (ACACLONE) was used to assist in the design of DNA primers for the site-directed mutagenesis experiments. Primers (57 bps in length) for Quikchange mutagenesis (Stratagene, San Diego, CA) on the WT azurin-pET9a plasmid were synthesized and HPLC purified by Eurofins MWG Operon (Huntsville, AL). In addition to the amino acid changes, the primers incorporated (+) or deleted (−) new restriction sites for each mutation ((−) EcoRV for Az-NiR and Az-NiR3His, (+) NsiI for Az-PHM and Az-PHM3His) for screening of the desired plasmids. Quikchange mutagenesis and DNA isolation methods were described previously.44 The resulting plasmids were sequenced at the University of Minnesota Genomics Center, confirming the mutations and the integrity of the entire azurin gene. The names given here are Az-NiR (Asn10His,Gln14Asp,Asn16His-azurin; same as “Az-NiR” in ref 44), Az-NiR3His (Asn10His,Gln14His,Asn16His-azurin), Az-PHM (Gln8Met,Gln14His,Asn16His-azurin; same as “Az-PHM/DBM” in ref 44), and Az-PHM3His (Gln8His,Gln14His,Asn16His-azurin).
Protein Expression, Purification, and Metal Ion Reconstitution
The plasmid DNA was transformed and the protein was expressed in BL21*(DE3) E. coli (Novagen, Madison, WI). Azurin proteins were purified as described earlier.44 Proteins were overexpressed from E. coli grown at lower temperatures (26 °C) to minimize background expression during cell growth and thus unhealthy cell cultures. Typical yields for the purified azurin variants ranged from 15 to 60 mg/L of cell culture. The protein identities were further verified by ESI-MS (Table S1 in the Supporting Information). Proteins were isolated in the apo form and reconstituted with Cu2+ in an experiment-dependent manner: First, type 1 Cu only samples were prepared by the addition of 0.75 equiv of aqueous CuSO4 per apo azurin. Second, fully reconstituted T1 and T2 copper samples were made by the addition of 5 equiv of CuSO4 per apo azurin, followed by removal of excess ions with a size-exclusion PD-10 column with Sephadex G-25. EPR showed that this protocol resulted in 100% type 1 copper loading and >90% type 2 copper loading in 20 mM ionic strength47 sodium phosphate buffer pH 6.35. Third, type 2 copper only samples were prepared by blocking the T1 site with addition of 1.5 equiv of aqueous HgCl2 per protein, followed by size exclusion chromatography to remove excess ions. Then, 0.75 equiv of CuSO4 was added to populate T2 sites.
Spectroscopic Methods
UV–visible absorption spectra were obtained on a Shimadzu UV-2401 PC spectrophotometer at room temperature. Proteins were ~0.1 mM buffered in 50 mM ammonium acetate pH 5.1. The absorptivity of azurin (ε625 = 5000 M−1 cm−148,49) was used to determine those for the variants in this study by integrating X-band EPR signal intensities.50 Reported absorptivities were the average of three measurements and have an error of ±10%. EPR spectra were obtained on an X-band Varian EC-1365 spectrometer fit with a Wilmad (Buena, NJ) liquid-nitrogen sample Dewar at 77 K. Data were measured on ~0.5 mM protein samples in 50% glycerol and 25 mM ammonium acetate pH 5.1, with instrument parameters of frequency ~9.27 GHz, microwave power 0.5 mW, and modulation amplitude and frequency of 5 G and 100 kHz, respectively. All EPR spectra were simulated with the SIMPOW6 program.51 ESI-mass spectra were obtained at the University of Minnesota, Department of Chemistry Mass Spectrometry Facility, on a Bruker BioTOFII. Samples were prepared in 50 mM ammonium acetate buffer pH 5.1 with 1 equiv of added copper. The MS data were used to confirm the identity of each variant and the binding of the higher affinity T1 Cu(II) ions (Table S1 in the Supporting Information).
Electrochemistry
Reduction potentials of the variants were measured with cyclic voltammetry techniques using a CH Instruments 620B electrochemical analyzer and Faraday cage. A pyrolytic graphite edge (PGE) working electrode, aqueous standard calomel reference electrode (E = 0.241 V vs NHE at 25 °C), and platinum-wire counter electrode were used. The working electrode was constructed as described previously.52 Prior to each experiment, the working electrode was polished for 1–5 min with a 1 µm alumina powder paste, rinsed with deionized water, and briefly sonicated. The 200 µL ~0.1 mM deaerated protein sample was incubated at 25 °C in a 1 mL cell blanketed with argon gas inside a Faraday cage. Direct electrochemistry of the variants with a 0.025 V/s scan rate gave strong pseudo-reversible signals in 50 mM ammonium acetate pH 5.1 buffer. Broader than ideal anodic and cathodic peak separations of ~100 mV were due to slower macromolecular diffusion rates, as confirmed by scan rate dependent analyses of peak separations.53–55 All reduction potentials are reported versus NHE unless otherwise specified.
Activity Assays
All nitrite reductase activity assays were conducted in a Coy Laboratories anaerobic chamber (Grass Lake, MI, USA) under a nitrogen + 2% hydrogen gas atmosphere. Anaerobic conditions resulted in more precise data for reactions of nitrite with Cu(I)-azurin, as competition with O2 was significant over the longer (minutes to hours) reaction time scales and varied with mixing. In addition, stoichiometric amounts of the reductant ascorbate could be used to reduce copper ions anaerobically without noticeable consumption by the side reaction with O2. For the Michaelis–Menten kinetic experiments, samples were 300 µL in volume in 20 mM sodium phosphate buffer pH 6.35,47 with 86 µM azurin variant (1.2 mg/mL), 33 mM ascorbate as reductant, and sodium nitrite concentrations varying from 1–150 mM. Nitrite aliquots were added to stirred solutions of protein followed by addition of ascorbate solution to initiate the reaction. The ascorbic acid and sodium nitrite stock solutions were prepared in buffer, and pHs were adjusted to 6.35 if necessary to maintain a constant pH for all assay conditions. Ascorbic acid solutions are thus referred to as ascorbate, since addition of some NaOH was required to reach pH 6.35. The rate of nitrite reduction was determined by using the Griess method56–59 with 20 µL of the reaction removed every 1–15 min and added to Griess reagents. The 20 µL aliquots were diluted in buffer (to a concentration of less than 400 µM NO2− for the most concentrated nitrite samples) to 500 µL and then mixed with 500 µL of 58 mM sulfanilic acid (SAN) in 3 M HCl followed by 500 µL of 3.85 mM N-(1-naphthyl)ethylenediamine dihydrochloride (NED). Care was taken to add NED rapidly and consistently after the addition of SAN to minimize the side reaction of the diazonium intermediate species with ascorbate.56 If necessary, reacted samples were then diluted again with buffer to give an absorbance of less than 1 au. Absorbances were measured on a Thermo Scientific Genesys 10S scanning UV–vis spectrophotometer. Initial rates of reaction were determined from the slope of the first 5–10% loss in nitrite concentration with time. Assays at each nitrite concentration were repeated at least three times.
To determine the rates of reduction, varied concentrations of ascorbate were added to 2 mL of 100 µM azurin in a stirred cuvette in 20 mM sodium phosphate buffer pH 6.35.47 The rate of reduction of the blue type 1 Cu center (A625 nm) was monitored with time, and a rate constant was derived by fitting the curve with a first-order exponential function. The resulting rate constants were plotted versus ascorbate concentration to derive the rate dependence.
Rates of reoxidation of the type 1 Cu center with the addition of nitrite were determined by first reducing 2 mL of 100 µM azurin variant in a stirred cuvette in 20 mM sodium phosphate buffer pH 6.3547 with 1 equiv of ascorbate. Ascorbate provided two electrons to reduce both copper centers. Once the protein was fully reduced (A625 nm of the T1 copper center disappeared), varied amounts of NO2− were added. The single turnover of the enzyme was observed by monitoring the recovery of the A625 nm value with time. The rates of reoxidation were determined by finding the initial slope and plotting it against the concentration of NO2−. Experiments were performed in triplicates.
The formation of NO(g) as the reaction product was verified by bubbling 1 mL of catalyzed reaction head space gas into an Fe[EDTA]2− solution (Figure S3 in the Supporting Information).60,61 The UV–vis absorption spectrum of the readily formed characteristic yellow [Fe(NO)(EDTA)]2− complex was observed.35,37,62 In the anaerobic chamber, 0.4 mL of 0.1 M H2SO4 and 0.3 M FeSO4 and 0.6 mL of 0.5 M NaOH and 0.2 M EDTA were mixed in a cuvette to generate [Fe(EDTA)]2−. The spectrometer was base-lined with this solution before injection of 1 mL of head space gas from a reaction with 260 µM Az-NiR3His, 100 mM nitrite, and 33 mM ascorbate.
Reaction reversibility was confirmed by measuring an increasing nitrite concentration with the Griess test after adding NO(g) to a solution of 86 µM Az-NiR3His and 1 mM NaNO2. NO(g) was generated either in a sealed anaerobic mixture of copper metal and aqueous HNO3 or in a sealed reaction vessel with 86 µM Az-NiR3His, 33 mM ascorbate, and 100 mM NaNO2. Headspace gas from these reactions (2 mL) was added to the headspace of the stirred Az-NiR3His solution.
RESULTS AND DISCUSSION
Design and Synthesis
Four models of NiR were made in P.a. azurin by adding a T2 copper binding site on a surface region of antiparallel β-sheet resembling that of native NiR (Figure 1). Two azurin variants, termed Az-NiR3His and Az-PHM3His, were intended to mimic the native NiR catalytic T2 Cu sites that contain three histidines as primary coordinating ligands. These azurin variants share a similar arrangement of mutations to the other two models, named Az-NiR and Az-PHM, which themselves were designed after native catalytic T2 copper sites.44 However, the 3His variants contain a third His residue, which is known to favorably coordinate metal ions.
UV–Visible Absorption Spectroscopy
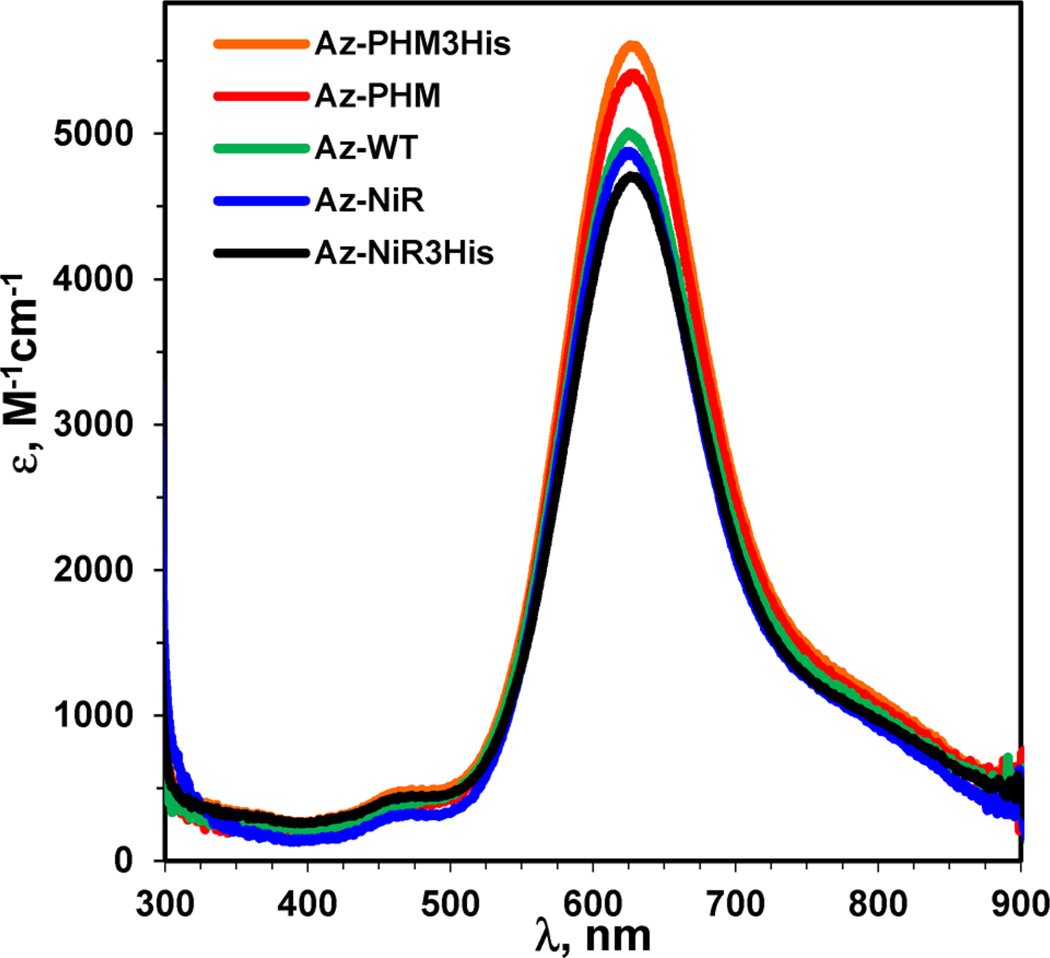
The addition of CuSO4 to all azurin variants resulted in blue solutions with UV–vis absorption spectra characteristic of azurin and T1 copper proteins. Spectra of the variants were very similar to each other and to that of WT azurin (Figure 2 and Table 1). The absorptivity values, as determined by integration of EPR signals, of the dominant S(Cys) → Cu charge transfer transition at 625 nm were all within experimental error and were around 5000 M−1 cm−1.48,49 The added mutations for the second copper binding site onto the azurin surface did not significantly perturb the T1 copper center, as might be expected from their large separation (>13 Å). Absorption peaks from the T2 Cu(II) center were not apparent in the T1 Cu(II) spectra, as absorptivity values of the former are typically around 2 orders of magnitude smaller than the latter.
Figure 2.
UV–visible absorption spectra of the four holo-azurin variants and Az-WT in 50 mM ammonium acetate pH 5.1. Spectrum labels correspond top to bottom with the peak intensity.
Table 1.
Experimental UV−Vis Absorption, EPR (from Fitted Simulations), and Reduction Potential Data for the T1 and T2 Copper Sites in the NiR Azurin Models in 50 mM Ammonium Acetate pH 5.1a
| variant | T1 Cu: S→Cu CT, nm (ε, M−1 cm−1) |
T2 Cu: peak, nm (ε, M−1 cm−1) |
T1 and T2 Cu: g∥ (A∥(G)), gx (Ax), gy (Ay) | T1/T2 E vs NHE ( ±5 mV) |
|---|---|---|---|---|
| WT azurin | 626 (5000) | T1: 2.260 (55), 2.047 (14), 2.051 (6) | 358/− | |
| Az-NiR | 625 (4850) | 722 (51) | T1: 2.258 (52), 2.048 (9), 2.048 (5) | 350/257 |
| T2: 2.315 (160), 2.068 (7), 2.070 (9) | ||||
| Az-NiR3His | 627 (4700) | 690 (65) | T1: 2.265 (47), 2.047 (12), 2.049 (4) | 359/270 |
| T2: 2.296 (160), 2.059 (2), 2.070 (2) | ||||
| Az-PHM | 627 (5400) | 677 (31) | T1: 2.262 (53), 2.046 (13), 2.051 (9) | 353/251 |
| T2: 2.297 (165), 2.050 (15), 2.074 (7) | ||||
| Az-PHM3His | 627 (5600) | 715 (43) | T1: 2.262 (53), 2.047 (13), 2.049 (2) | 357/258 |
| T2: 2.298 (165), 2.057 (12), 2.071 (11) | ||||
| native NiR | 590 (2300)18,63 | 790 (85)64 | T1: 2.19 (67), 2.06, 2.02 (50)18 | 247/21818,63 |
| T2: 2.31 (150), 2.07, 2.0763 | ||||
| CuSO4 | 764 (24) | 2.366 (142), 2.068 (6), 2.080 (6) | −/213 |
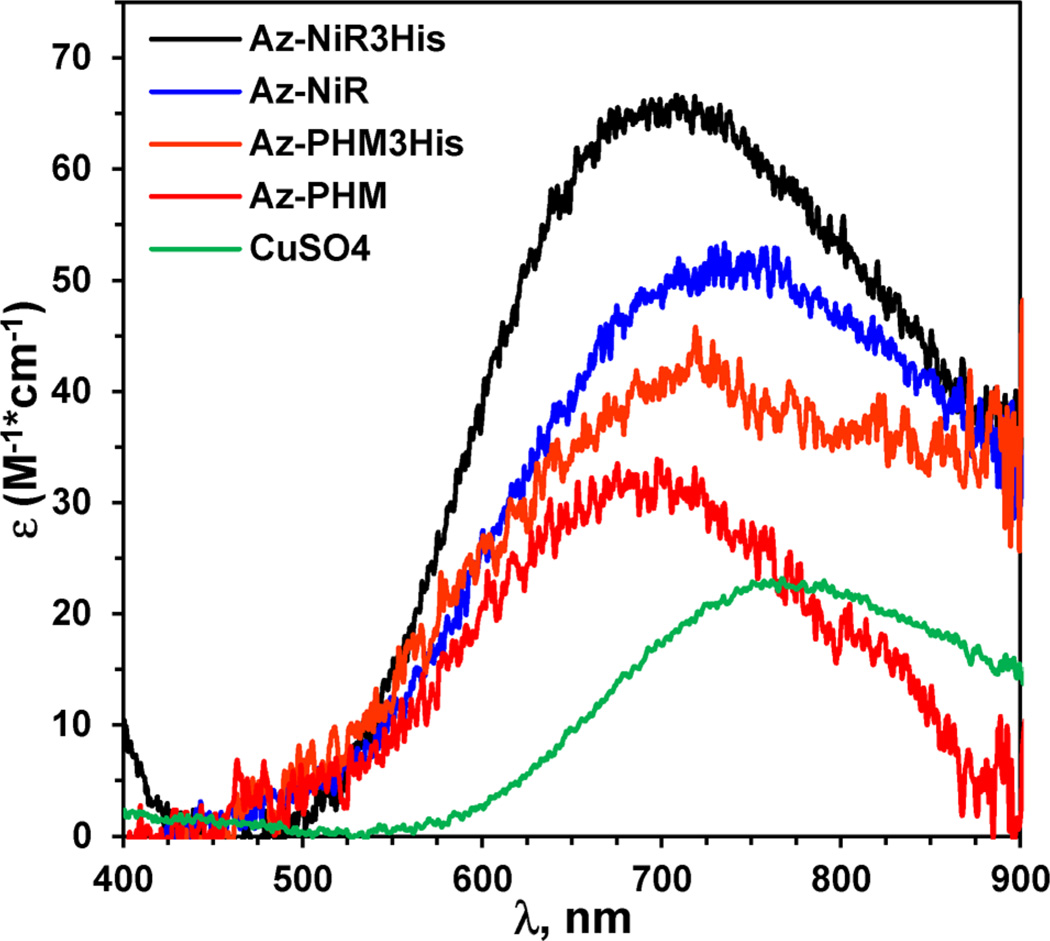
We were able to observe the absorption spectra of the T2 Cu(II) centers alone by blocking the higher affinity T1 site of our azurin models with colorless Hg(II). Azurin with a T1 site saturated by Hg(II) yielded weak-intensity blue samples following reconstitution of the T2 site with CuSO4 (Figure 3). Samples required protein concentrations of over 0.25 mM in order to discern the weakly absorbing Cu(II) centers. Overall, the spectra of the mutants were similar to each other in that they contained broad and low-intensity Cu(II) d → d transitions located around 700 nm (Figure 3 and Table 1) with absorbance maxima of 722, 690, 677, and 715 nm for Az-NiR, Az-NiR3His, Az-PHM, and Az-PHM3His, respectively. Their absorption spectra were distinct from that of free CuSO4 in buffer. The absorbance maxima and absorptivity values were consistent with those of other native and designed T2 copper centers, which vary depending on geometry, ligand number and type, and protonation state of the Cu(II) complex. They were similar to other histidine-rich Cu(II) centers in distorted-square-pyramidal geometries.65–71 T2 Cu(II) centers in superoxide dismutase (SOD), for example, demonstrated broad Cu(II) d–d transitions at 670–700 nm,66,72 and those of the trihelical peptides were around 640 nm,34,35 while those of other N,O-rich square-pyramidal synthetic model complexes were ~650–720 nm.36,43,68–70 The spectrum of a native NiR T2 copper center was reported to be 790 nm with an absorptivity of 85 M−1 cm−1.64 The absorptivity values of the T2 centers on azurin were low, as expected for Cu(II) d → d transitions. They were ε722 = 51, ε690 = 65, ε677 = 31, and ε715 = 43 M−1 cm−1 for Az-NiR, Az-NiR3His, Az-PHM, and Az-PHM3His, respectively. They were on the low end of values of ε ≈ 70–150 M−1cm−1 reported for similar aqueous systems.34,35,43,64,66,67,72
Figure 3.
UV–visible absorption spectra of the four T1HgIIT2CuII-azurin variants and free CuSO4 in 50 mM ammonium acetate pH 5.1. Spectrum labels correspond top to bottom with the peak intensity.
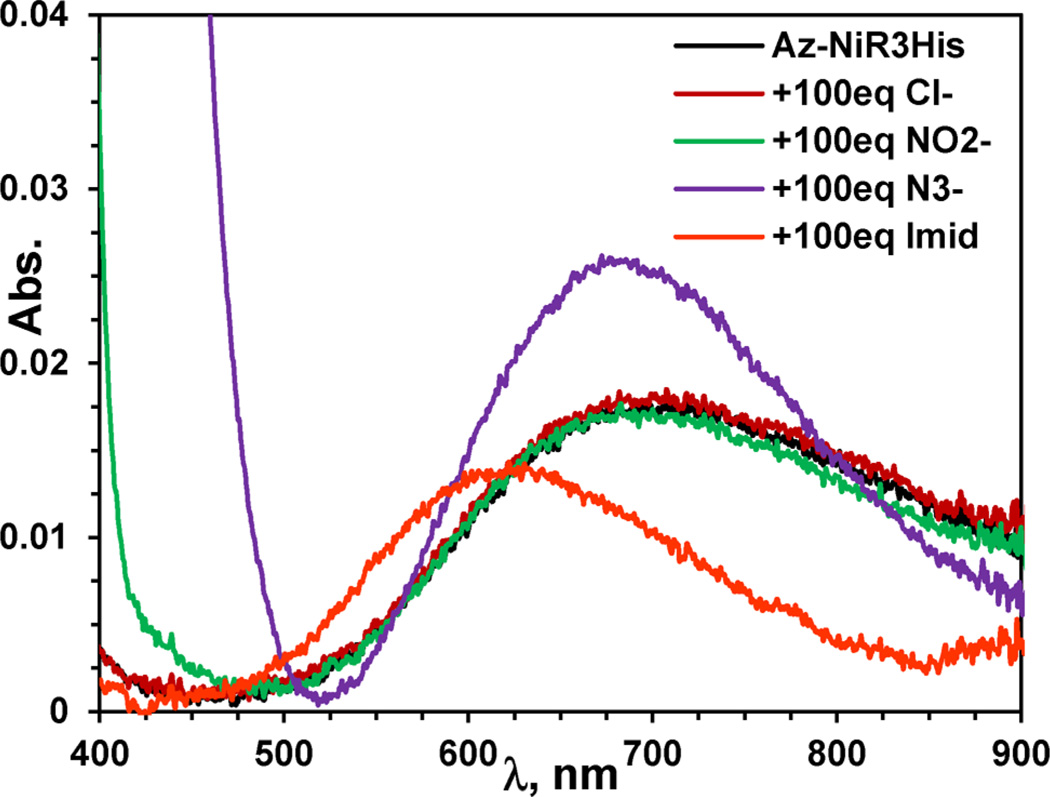
Furthermore, the effects of the small exogenous ligands nitrite, azide, chloride, and imidazole on the absorption spectra of T2 Cu(II) only samples were explored, in order to probe their substrate binding abilities (Figure 4 for Az-NiR3His and Figure S1 in the Supporting Information for all variants). Overall, the results were similar to other related T2 Cu(II) systems where the absorption spectra were not very sensitive to small ligands, as the observed changes occurred only with addition of multiple equivalents.35,73,74 Titration with azide or imidazole perturbed the spectra for all of the azurin variants in the same way. Azide (at 10–20 equiv and higher) resulted in peaks that were blue-shifted for each variant with an ~50% increase in absorptivity. The addition of azide to free CuSO4 resulted in a similar increase in absorptivity, but the peak was about 100 nm lower in energy than the azurin variants (Figure 4 and Figure S1). The exogenous ligand imidazole did not initially affect the spectra of any variants up to 10–20 equiv. Upon addition of greater amounts (20–100 equiv), the spectrum began to shift to an intensity and position approaching that of free CuSO4 and imidazole in solution (Figure S1), thus indicating that Cu(II) was pulled from the protein binding site. Finally, the addition of nitrite or chloride ions to the variants and free CuSO4 did not appreciably influence their spectra up to 100 equiv (25 mM). Furthermore, there was no significant difference between titrations performed in 50 mM ammonium acetate pH 5.1 buffer and 20 mM sodium phosphate pH 6.35 buffer for the Az-NiR3His variant. The absorption titrations, particularly with azide, suggest that ligand binding is possible to the designed T2 copper centers on azurin. Data on other systems are sparse due to T2 Cu(II)’s low absorptivity and frequent interference from other copper centers. However, the weak response of these azurin variants, to nitrite in particular, were consistent with the UV–vis absorption data for T2 centers in the CuM site of PHM, which required 1500 equiv of nitrite to observe full perturbation of the MCD spectrum.73 EPR, however, was more sensitive in this regard.
Figure 4.
UV–visible absorption spectra of the Az-NiR3His T2 Cu center with added ligands NaCl, NaNO2, NaN3, and imidazole. All samples are 0.25 mM in 50 mM ammonium acetate buffer pH 5.1. The top ~700 nm peak is for azide, while chloride, nitrite, and Az-NiR3His are overlapping, and imidazole is shifted to ~620 nm.
EPR Spectroscopy
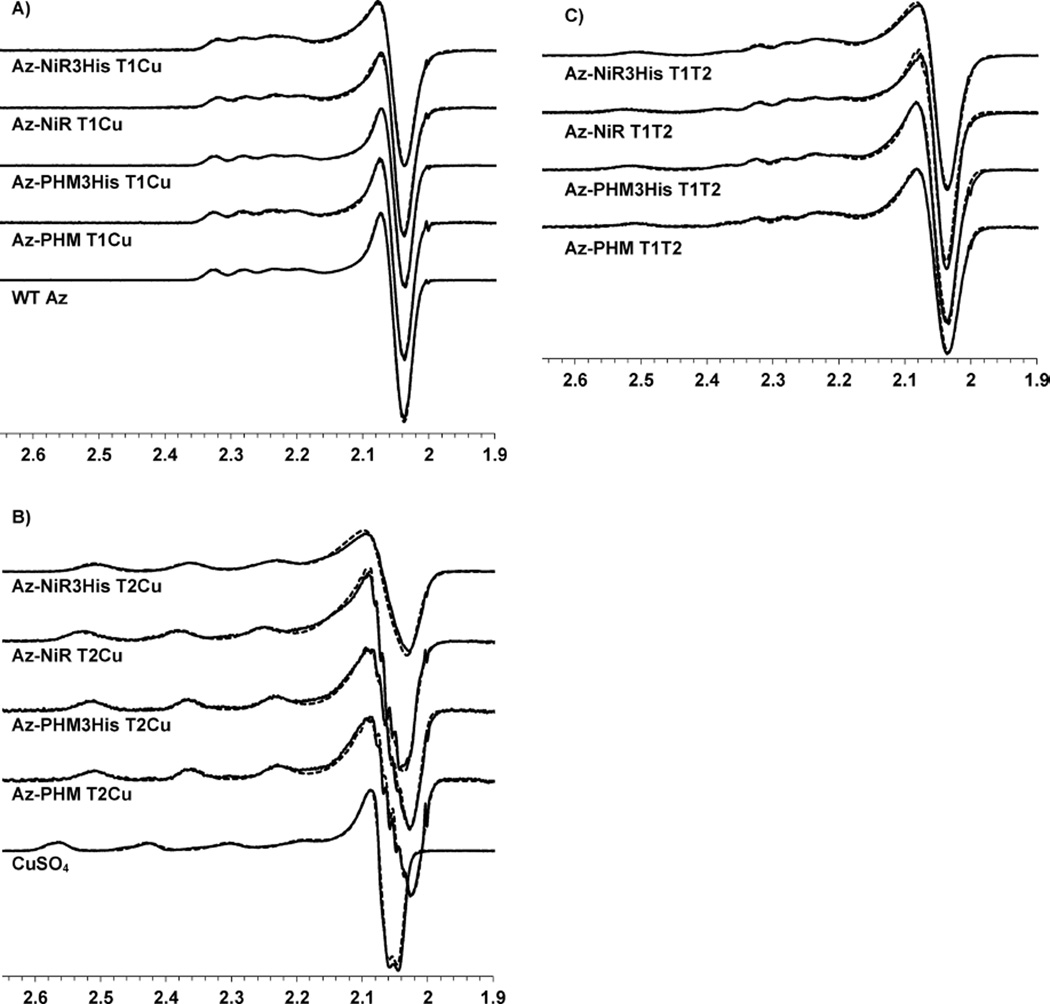
X-band EPR spectra of the copper sites in the azurin variants were obtained on all proteins reconstituted with a single T1 Cu(II), both T1 Cu(II) and T2 Cu(II), and a single T2 Cu(II) (T1 Hg(II)–T2 Cu(II) sample) (Figure 5). All spectra were simulated for accurate determination of g and A values51 (Figure 5 and Table 1).
Figure 5.
X-band EPR spectra (solid lines) and overlaid simulated fits (dashed lines) for (A) T1 Cu(II) only, (B) T2 Cu(II) (T1 Hg(II)), and (C) T1 Cu(II) + T2 Cu(II) azurin variants, ~1 mM in 50% glycerol and 25 mM ammonium acetate pH 5.1 buffer. WT azurin (A) and free CuSO4 (B) in buffer are shown for comparison. The sharp derivative signal around g ≈ 2.0 is iron impurity in the EPR cavity.
The T1 Cu(II) EPR spectral parameters for all the variants were similar to those of WT azurin (Figure 5A) and characteristic of the T1 blue copper protein family with axial line shapes and narrow Cu hyperfine splittings.75 The g∥ values were ~2.26, while gx and gy were similar to each other, in the range of 2.04–2.05 across the variants. The T1 Cu(II) A∥ hyperfine splitting values were similar for all azurin variants, ranging from 47 to 53 G, in comparison to the WT A∥ value of 55 G. The common EPR parameters across the variants indicated a conserved T1 Cu(II) site structure that was largely unperturbed by the addition of the second surface T2 Cu binding site.
EPR spectra of the T2 Cu(II) centers in each variant were similar to each other (Table 1 and Figure 5B), likely resulting from the common His-supported, solvent-exposed surface binding site (Figure 1). The EPR line shapes and parameters were characteristic of T2Cu(II) proteins, including native NiR. The axial spectra (g∥ ≈ 2.30, gx,y ≈ 2.05–2.07) were slightly more rhombic than the T1 centers (g∥ ≈ 2.26, gx,y ≈ 2.04–2.05) and were similar to those of native NiR T2 Cu(II) sites, which have comparable values of g∥ ≈ 2.30–2.35 and gx,y ≈ 2.04–2.10.10,14,17,18,63,76–79 The g∥ values and the A∥ hyperfine splittings (160–165 G) were clearly discerned from that of free Cu(II) in solution (Figure 5B) and from that of 1 equiv of Cu(II) added to WT azurin (g∥ ≈ 2.37 and A∥ ≈ 142 G).44 The A∥ values of the variants were similar to those of other T2 Cu(II) proteins and slightly larger than those of native NiR T2 Cu(II) sites, which have A∥ ≈ 110–150 G.10,14,17,18,63,76–79 The EPR axial line shape and spectroscopic parameters of the azurin variant T2 Cu(II) centers were consistent with those of other five-coordinate copper sites of mixed nitrogen- and oxygen-donating ligands in a distorted-square-pyramidal geometry.36,43,66–68,80 The readily discerned copper hyperfine splittings in the g∥ region demonstrated a dx2–y2 ground state common in T2 Cu(II) centers.81 Small differences in the spectroscopic values between the variants reported here are likely results of the different residues in the four azurin variants in varied locations on the protein surface.
Finally, the T1 Cu(II)–T2 Cu(II) doubly bound samples were analyzed by EPR spectroscopy. This was an effective tool for discerning the T1 and T2 coppers in these models, as well as the presence of any free Cu(II) ions. Simulations of these spectra were accomplished by simply summing the simulated parameters for the T1 Cu(II) site with those of the T2 Cu(II) site. The sum of these two species accurately recreated the doubly bound spectra (Figure 5C) and illustrated their noncoupled nature.7
These EPR simulations also allowed us to measure the relative loading of the T1 versus T2 sites. The relative amount of the T2 Cu(II) signal needed to accurately simulate the experimental EPR curves never exceeded the amount of T1 Cu(II) signal and was in the 70–100% range. Our method for reconstituting these model systems with Cu(II) prior to assays was effective. The simulations demonstrated that, in 50 mM ammonium acetate at pH 5.1, the samples bound T1 Cu(II) with 70–100% T2 Cu(II) loadings and no apparent free Cu(II). Similar experiments using assay conditions (20 mM sodium phosphate buffer pH 6.35) showed 90–100% Cu(II) loadings of the T2 copper site with no free copper.
EPR was more sensitive to the influence of small exogenous ions on the T2 Cu(II) site, with similar but more clearly discerned changes in comparison to those observed above by UV–vis absorption spectroscopy. EPR spectra demonstrated small changes with added nitrite, while azide and imidazole gave the largest perturbations (Figure S2 in the Supporting Information). Nitrite up to 200 mM resulted in small decreases (3–5 G) in the hyperfine coupling values for the four azurin variants, with very small decreases in g values of ~0.005. Azide effects on the EPR spectra of all four azurin variants were observed at smaller concentrations (50 mM) with decreased A∥ values (2–6 G) and large decreases in g∥ of ~0.05 (~2.29 to ~2.24). Finally, addition of imidazole to the variants resulted in the most dramatic perturbations, where ~30 G increases in A values and about 0.05 decreases in g values were observed with addition of up to 20 mM imidazole. Addition of further amounts of imidazole resulted in the appearance of a free copper signal, consistent with the UV–visible absorption titration data discussed above.
The overall trends in small-molecule interactions with the T2 Cu(II) sites as observed by EPR were consistent with those found by UV–vis absorption data and consistent with those of native systems. Azide and imidazole resulted in the largest changes, while the spectra were only slightly perturbed by the addition of nitrite. In native NiR and related systems, the effects were similar; however, they required as little as a few equivalents of added nitrite76,78 to as much as 1500 equiv.73 Where reported, the changes in EPR parameters upon nitrite binding included either small increases14,73,76,78 or decreases18,35,79 in A∥ values of around 10 G, with a correspondingly decreased18,76,78,79 or sometimes unperturbed14,35,73 g∥ value. In summary, the data on the azurin variants suggest that exogenous ligands interact with the designed surface copper centers in a manner consistent with T2 Cu(II) centers, such as those of native NiR.
Electrochemistry of T1 and T2 Centers
Cyclic voltammetry was used to measure the reduction potential of the azurin variants. The cyclic voltammograms for WT and the four azurin variants were obtained by direct electrochemistry on ~100 µM samples with a PGE working electrode (Figure 6 and Table 1). Quasi-reversible signals with peak separations of about 100 mV were observed. The larger peak separations were due to the slower diffusion rate of macromolecules, consistent with experimental work on similar samples.53 We first measured samples with only a T1 Cu(II) ion. The measured reduction potentials of all of the T1 Cu centers were very similar within experimental error and were around 355 mV vs NHE.
Figure 6.
Cyclic voltammograms for (left) T1 Cu(II) loaded azurin variants and (right) T2 Cu(II) (T1 Hg(II)) azurin variants in 50 mM ammonium acetate pH 5.1 buffer. Scan rate: 25 mV/s with PGE working electrode and plotted vs standard calomel reference electrode.
Cyclic voltammetry was performed on T2 Cu(II) only samples by first blocking the T1 center with Hg(II) before reconstituting the designed T2 centers with Cu(II) (Figure 6 and Table 1). The reduction potentials of the resulting T2 Cu(II) centers were about 100 mV lower than those of the T1 Cu(II) centers and showed some variation within the variants. The potential for Az-NiR3His, Az-NiR, Az-PHM3His, and Az-PHM were 270, 257, 258, and 251 mV, respectively, vs NHE. The reduction potentials were similar to those reported for the T2 Cu(II) sites of native NiRs that range from 230 to 280 mV76,82–84 at pH 7.0 and 310–340 mV82,83 at pH 6.0. Furthermore, the native T2 Cu(II) reduction potentials are reported to be similar to or higher than those of the native T1 sites.5 The finding that the azurin variants have lower T2 Cu(II) reduction potentials than the T1 Cu(II) reduction potentials indicates that the equilibrium could be shifted toward a reduced T1 Cu center.
Nitrite Reduction Activity: Control Reactions
All four azurin variants were found to catalytically reduce nitrite using ascorbate as a reductant. Nitrite degradation was monitored using the colorimetric Griess assay that detects nitrite. Assays were conducted with 86 µM protein loaded with 1 or 2 equiv of Cu(II) in the presence of varied sodium nitrite (1–150 mM) and excess ascorbate (33 mM). The milder ascorbate was used as the reductant because sodium dithionite was harmful to azurin’s stability and because dithionite was found to have a significant background rate of reaction with nitrite. It was determined in control reactions with varied ascorbate concentrations from 1 to 60 mM that concentrations as low as 10 mM could be used with no change in observed rates of nitrite reduction. An ascorbate concentration of 33 mM, about 400-fold higher than that of the enzyme, was used in the assays. In addition (vide infra), it was found that the rate of azurin reduction by ascorbate was at least ~100 times faster than the rate of azurin oxidation by nitrite. Therefore, the reduction of the azurin variants by ascorbate was not rate limiting. Finally, the resting Cu(II) form of the azurin variants did not result in any NO2− loss; consequently, reactions were initiated by the addition of ascorbate.
As with native NiR enzymes, the reaction pH was important. A reaction pH of 6.35 was used in our assays. The azurin variants were similar to native enzymes that have catalytic rate optima around pH 5.5 with slower product formation at higher pHs (>7.0).2,5 However, at lower pHs (<6.0) our assays showed significant background or uncatalyzed reaction rates between nitrite and ascorbate. At pH 6.35 only ~0.05% of the nitrite disappeared in the background uncatalyzed reaction between 33 mM ascorbate and 100 mM nitrite over the 2 h reaction times, whereas in the presence of azurin variants under these conditions, 5–20% of the nitrite was reduced.
NO(g) was found to be the product of nitrite reduction with the azurin variants by generating the characteristic yellow NO adduct of [Fe(EDTA)]2− (Figure S3 in the Supporting Information).35,37,60–62 Addition of 1 mL of reaction headspace gas to a sealed [Fe(EDTA)]2− solution generated the signature absorption spectrum of the Fe(II)–NO adduct with a peak at 432 nm, thus demonstrating the ready production of NO by the azurin variants.
WT azurin was tested as a catalyst, prepared in the same way as the protein models by addition of 5 equiv of Cu(II) followed by treatment with a desalting column to remove excess ions. WT azurin, lacking a T2 Cu(II), gave little to no reduction of nitrite with 33 mM ascorbate and varied nitrite concentrations from 1 to 150 mM (Figure S4 in the Supporting Information). Second, the rates with WT azurin were comparable to the background uncatalyzed rate of nitrite reduction (Figure S4). Third, the rates of nitrite reduction of the four azurin variants with only a T1 Cu(II), lacking the second T2 Cu(II) ion, yielded kinetics that were the same as that of WT azurin, with rates at least 100 times slower than the dicopper(II) populated proteins. These experiments highlighted the critical role of a catalytic T2 Cu center in the reaction with nitrite, which is well-known with native NiR species.5,19,77
In further control reactions the reversibility of the chemistry catalyzed by the azurin variants was demonstrated by the production of nitrite from NO gas. NO was generated under an inert atmosphere either by mixing aqueous nitric acid with copper metal or by mixing 86 µM Az-NiR3His with 33 mM ascorbate and 100 mM NaNO2. Headspace gas (2 mL) from this reaction was added to the headspace of a buffered solution of azurin variant in the oxidized Cu(II) state. The resulting solution faded to blue, indicating a reduction of the azurin variant T1 copper center, presumably as a result of the T2 Cu center being reduced first, since reactions with WT azurin or T1 Cu(II) only variants did not result in a reduced protein. Wever et al. observed T1 Cu(II) sites to reduce slightly under 1 atm of NO(g) (~15% yield of Cu+–NO+), while here no reaction was observed under such mild addition of NO.85 Removal of reduced solutions from an inert atmosphere to an oxygen atmosphere resulted in a full recovery of the blue color, demonstrating the turnover capability of the azurin variants. Furthermore, we used the Griess assay (as well as the appearance of a 350 nm peak characteristic of nitrite) to confirm that nitrite was formed and increased in concentration over time with the addition of NO(g). No nitrite was observed with WT azurin. This confirmed the ability of the azurin variants to catalyze the nitrite redox chemistry in both directions, as was demonstrated with native NiR systems.13,86
In single enzyme turnover experiments, the azurin variants were reduced with ascorbate and then reoxidized with excess nitrite. For reduction, the addition of 0.5 equiv of ascorbate was required to fully reduce the blue T1 copper center of WT azurin, which contains only one Cu(II) center. However, the addition of 1.0 equiv of ascorbate was required to fully reduce both Cu(II) centers in the model systems. Addition of 0.5 equiv of ascorbic acid to these dicopper variants resulted in a decrease in blue color of ~50%. This demonstrated that two copper ions were present in the model proteins, as verified by EPR. The reduction reaction was also probed by EPR. After 60 s of mixing Az-NiR3His with 1 equiv of ascorbate, EPR showed that more T2 copper was reduced than T1 copper, indicating that T2 copper reacted with reductant ahead of the T1 Cu (Figure S5 in the Supporting Information). All reduced azurin variants remained stably reduced under the inert atmosphere but fully returned to the blue color if exposed to oxygen gas or nitrite.
The addition of excess sodium nitrite to reduced azurin variants resulted in a return of blue color or reoxidation of the T1 and T2 copper centers. This reaction was also monitored by EPR, which showed the T2 copper center reoxidized before the T1 center. The amount of nitrite reduced upon this single turnover reoxidation of the azurin variant was quantified, and results indicated that two nitrites were consumed per azurin protein. This was demonstrated by the loss of 185 µM nitrite following the addition of 1 mM nitrite to 100 µM Az-NiR3His, which was prereduced with 100 µM ascorbate. On the other hand, with the singly T2 Cu(II) loaded T1 Hg(II)–T2 Cu(II) Az-NiR3His protein, about 60 µM nitrite was reduced using 100 µM protein (100 µM T2 Cu(II)), which was prereduced with 1/2 equiv of ascorbate (50 µM). This showed that electrons from both the T1 and the T2 copper centers were delivered to reduce nitrite by consecutive reaction with two different nitrite molecules. Finally, although WT azurin was readily reduced by ascorbate, the T1 Cu(I) center did not revert to blue or reoxidize with the addition of nitrite over days of monitoring in the glovebox. This demonstrated that the designed T2 copper surface site was important for catalysis in the azurin variants and that any reduction of nitrite directly by the T1 copper center was negligible.
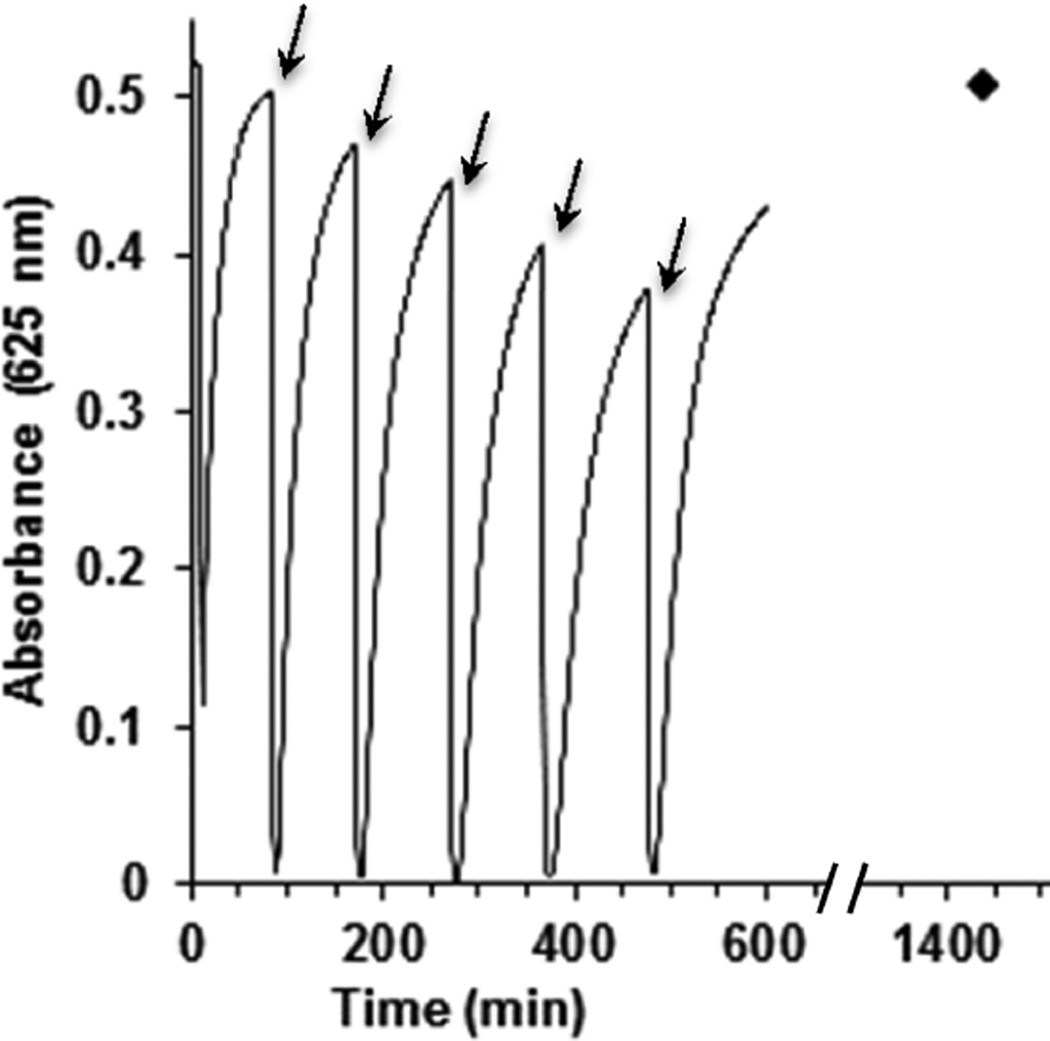
Finally, to evaluate the robustness of the azurin catalysts, their stability was tested by repeating a single turnover experiment multiple times. In the experiment, 100 µM Az-NiR3His was equilibrated with 10 mM NaNO2 in an anaerobic chamber. The absorbance at 625 nm, of the T1 copper center in the dicopper azurin variant, was monitored. The addition of 2 equiv of ascorbic acid reduced the T1 copper center, as evidenced by the decrease in blue color. Nitrite was consumed and the blue color returned, indicating reoxidation by NO2−. Upon recovery of A625, 2 equiv more of ascorbic acid was added. This process was repeated multiple times for 10 h (Figure 7). The multiple turnover cycles and the full recovery of T1 Cu(II) confirmed the catalytic capability of the azurin variants and their robust nature. This indicated that the protein was not readily denatured under these conditions and that it was capable of catalyzing multiple turnovers.
Figure 7.
Az-NiR3His (100 µM) under multiple turnovers of reduction with ascorbic acid and reoxidation in the presence of 10 mM NO2 in 20 mM phosphate buffer at pH 6.35. The arrows indicate points where 2 equiv of ascorbic acid was added. The data point at 24 h indicates full reoxidation by nitrite.
Results from all of the above nitrite reduction experiments demonstrated the robust nature and catalytic capabilities of the azurin variants. The formation of NO product from nitrite reduction, as well as the reversible production of nitrite from NO, was similar to that of native copper NiRs. The above reactions also demonstrated the requirement of the T2 surface copper site for activity, as WT azurin and all variants with a T1 Cu(II) only had no activity above background. Finally, it was shown that electrons from both the T1 copper site and T2 copper were donated to nitrite by following the gain in characteristic blue color with stoichiometric reduction of nitrite. We therefore further determined the catalytic Michaelis–Menten parameters of the four azurin variants with regard to nitrite.
Nitrite Reduction Activity: Michaelis–Menten Kinetics
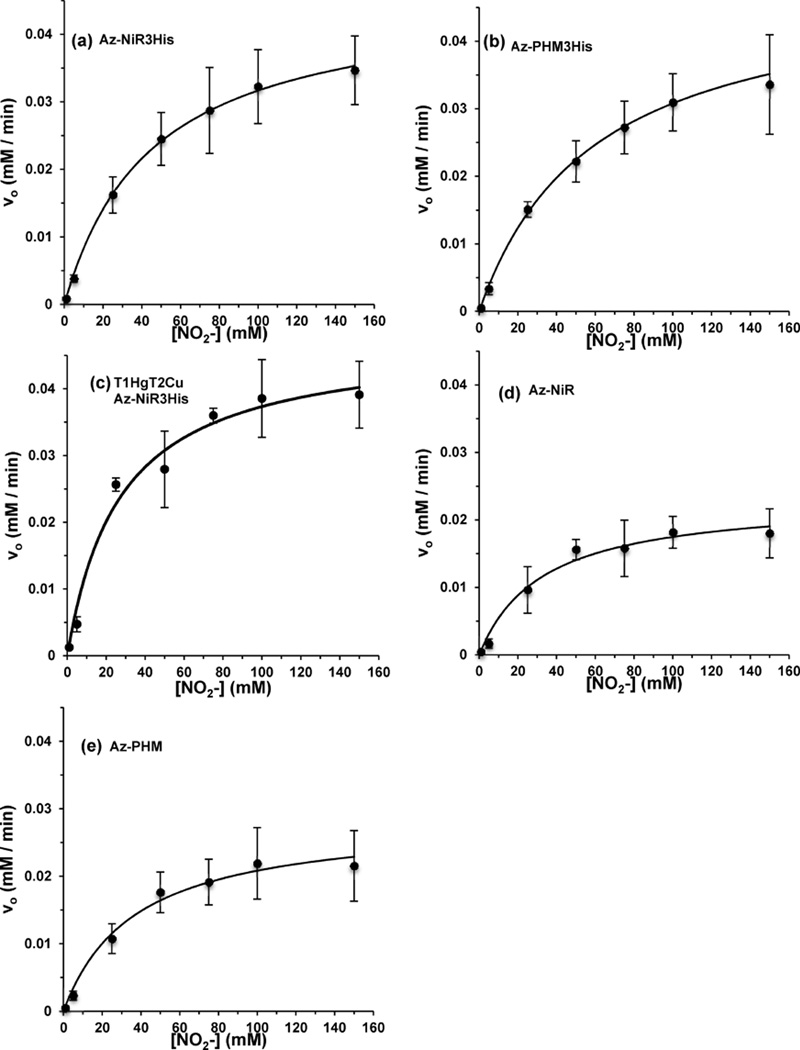
Michaelis–Menten parameters of our azurin variants were determined by monitoring the concentration of nitrite with time using the colorimetric Griess assay. The initial rate of reduction (v0) was found by following the concentration of nitrite until a 5% decrease was observed. Assays for each variant were run in triplicate and at nitrite concentrations from 1 to 150 mM. Tests of solution ionic strength influences were conducted where the ionic strength of the solution was held to a constant level by supplementing varied amounts of NaNO2 with NaCl to maintain a total salt concentration of 100 mM. The rates derived from these reactions were the same as those where only NaNO2 was varied without the addition of NaCl. Each reaction assay used 86 µM protein, with 2 equiv of Cu(II) as confirmed by EPR, and excess ascorbic acid (33 mM) with pH adjusted to 6.35 in 20 mM phosphate buffer. The rates were plotted versus the corresponding nitrite concentrations to generate the Michaelis–Menten plots (Figure 8).
Figure 8.
Michaelis–Menten plots for the azurin variants: (a) Az-NiR3His; (b) Az-PHM3His; (c) T1 Hg(II)–T2 Cu(II) Az-NiR3His; (d) Az-NiR; (e) Az-PHM.
The azurin variants show significant nitrite reduction activity (Figure 8) in comparison to WT azurin, which showed no detectable activity above background (Figure S4 in the Supporting Information). The KM and Vmax values are reported in Table 2, and the turnover numbers were determined using 86 µM azurin variant. Among the azurin variants, Az-PHM3His and Az-NiR3His had the highest turnover numbers of 0.59(13) and 0.56(5) min−1, respectively. Az-NiR and Az-PHM had lower turnover numbers with 0.34(5) and 0.38(9) min−1, respectively. The higher turnover numbers of Az-NiR3His and Az-PHM3His may reflect the importance of the third histidine. The Az-PHM and Az-NiR variants have a Met or Asp in addition to two added histidines on the designed T2 site, whereas Az-NiR3His and Az-PHM3His have three histidines, similar to the native NiR. We have observed by EPR that three histidines in the T2 site retain the copper(II) ion better following size exclusion chromatography and thus could indicate a more stable active site. The histidines could also assist in the important role of providing the necessary proton in the formation of the product OH−/H2O from NO2− reduction.
Table 2.
KM, Vmax, and Turnover Number of Azurin Variants in Comparison with Native NiR13
| variant | KM (mM) |
Vmax (mM/ min) |
turnover no. ((mM NO2− )/(min (mM Az))) |
|---|---|---|---|
| native AfNiR | 0.053(5) | NA | 62760(2000) |
| Az-NiR | 36(5) | 0.029(4) | 0.34(5) |
| Az-NiR3His | 35(6) | 0.048(4) | 0.56(5) |
| Az-NiR3His- T1HgT2Cu |
27(7) | 0.047(7) | 0.55(8) |
| Az-PHM | 55(26) | 0.033(8) | 0.38(9) |
| Az-PHM3His | 46(13) | 0.051(11) | 0.59(13) |
The KM and Vmax values for the variant Az-NiR3His with only a T2 copper ion were also determined. The T1 site was blocked with Hg(II) ions prior to reconstitution of the T2 site with Cu(II). This variant displayed kinetic parameters that were very similar to those of Az-NiR3His with two copper ions (Figure 8 and Table 2). This result indicated that the T1 copper center had no influence on the rates of catalytic nitrite reduction by these catalysts. Although single enzyme turnover experiments above showed that electrons from both copper sites can be delivered to nitrite, as examined further below it was observed that the rate-limiting step of catalysis is the reaction with nitrite, presumably at the T2 copper center, since this was required for activity. If reduction by ascorbate is much faster than nitrite reduction, then it is possible that turnover could occur with a T2 copper alone. This same phenomenon was observed in native NiRs containing a T2 copper site only, where significant activity was observed using small-molecule reductants, which presumably directly reduced the T2 copper center.77
The turnover numbers of the azurin variants were smaller than those of native NiRs and comparable with those of other reported synthetic small-molecule models. The rates are 3–4 orders of magnitude slower than those of many native NiRs (1630 min−1,18 8870 min−1,19 90000 min−1,13 and 24960 min−1)11 but similar to those of other model copper NiR’s (200 and 270 min−1) in methanol solvent29 or aqueous solution (0.021 min−1 at pH 5.834). There are likely multiple factors leading to higher rates in the native NiRs. A primary factor that is missing in our models is a dedicated proton donor for the leaving oxygen atom as nitrite transitions to NO and OH− products upon reduction. The native enzyme has conserved His and Asp residues that are thought to provide the proton through a hydrogen-bonding network with water.2,8,87,88 Another possible reason for the slower kinetics in our models is the lack of a direct covalent link between the T1 and T2 copper centers, like the one observed in native NiRs.8,46 The link allows for efficient electron transfer from the reductant through the T1 to T2 copper centers upon nitrite binding in native systems.87,88
The KM values of the azurin variants were similar within error (Table 2) and found to be around 40 mM. This value is 100–1000 times larger than the KM values of native NiRs, which range from 0.5 to 0.034 mM.13,21–23,25 The lower nitrite affinity in the azurin variants can be explained by a number of factors. The designed copper binding site on the azurin surface has two nearby anionic aspartic acid residues that could decrease the affinity for an anionic substrate such as nitrite.89,90 In addition, in this first phase of copper site design, we did not add additional hydrogen bonding capable amino acids. The extra aspartate and histidine residues found in native NiR proteins, in addition to those residues binding the copper ion, are important for nitrite binding.4 Studies with native NiRs demonstrated the strong influence of such residues on KM. For example, mutating the Asp residue in native AxNiR to Ala, Asn, or Glu increased KM values by factors of 14–170.91 Addressing these points in future rounds of design may improve the activity of our designed variants, particularly when the reaction with nitrite is rate limiting.
Nitrite Reduction Activity: Single Turnover Reduction vs Reoxidation Rates of Azurin Variants
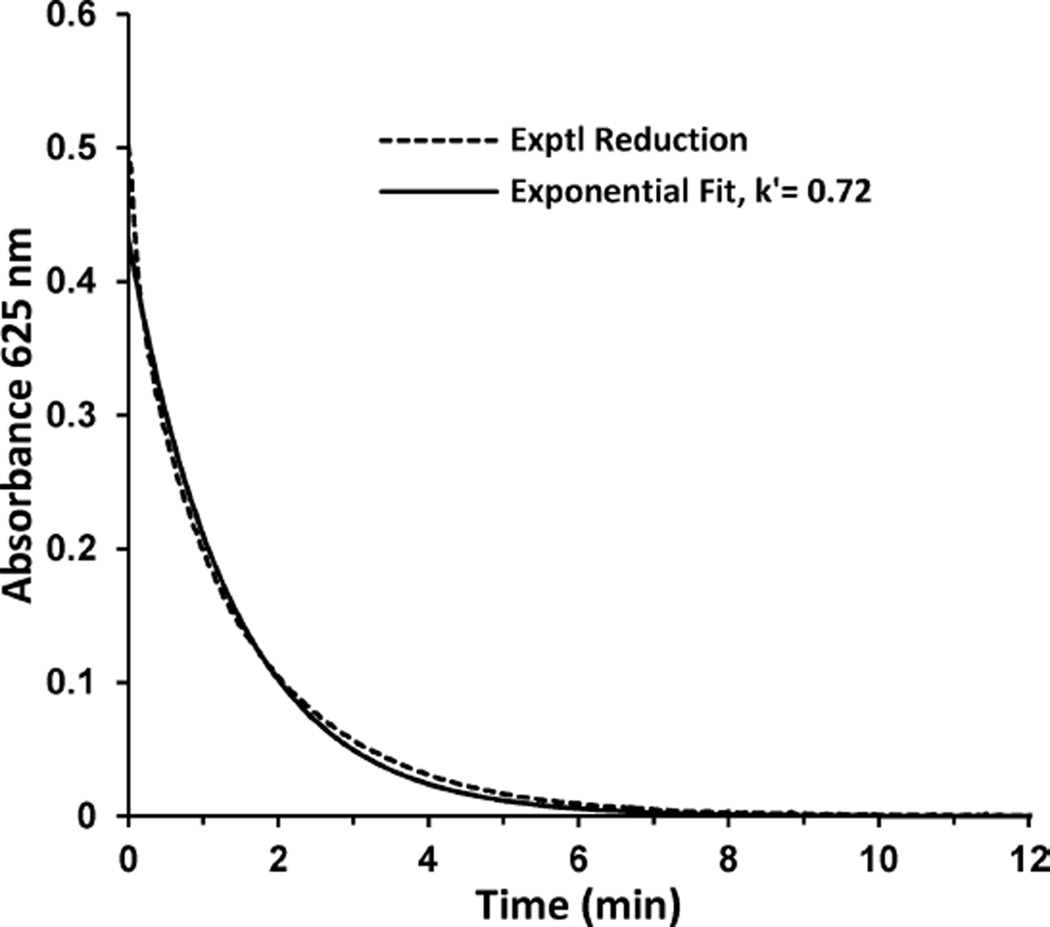
To further probe the reaction kinetics of nitrite and ascorbate with the azurin model-NiRs, we independently examined the reduction behavior of the azurin variants with ascorbate and then their reoxidation by nitrite. First, rates of reduction were determined by varying ascorbic acid concentrations and monitoring the loss of blue color, or A625, of azurin variants with time. As mentioned above, EPR studies demonstrated the T2 copper was also reduced under these conditions and was slightly ahead of the T1 center (Figure S5 in the Supporting Information). The reduction of Az-NiR3His with 0.5 mM ascorbic acid is shown in Figure 9, with a single-exponential fit to the data. All of the variants demonstrated fits comparable to that shown in Figure 9. Deviations from a perfect fit with a single-exponential function could be attributed to possible trace oxygen in the sample, to any non fully T1 + T2 Cu reconstituted azurin proteins, and to the fact that different protonation states of ascorbate exist in solution,92,93 all of which would result in another component in the reduction curve.
Figure 9.
Reduction of 100 µM Az-NiR3His by 0.5 mM ascorbic acid, with an exponential fit to determine the pseudo-first-order rate constant, k′.
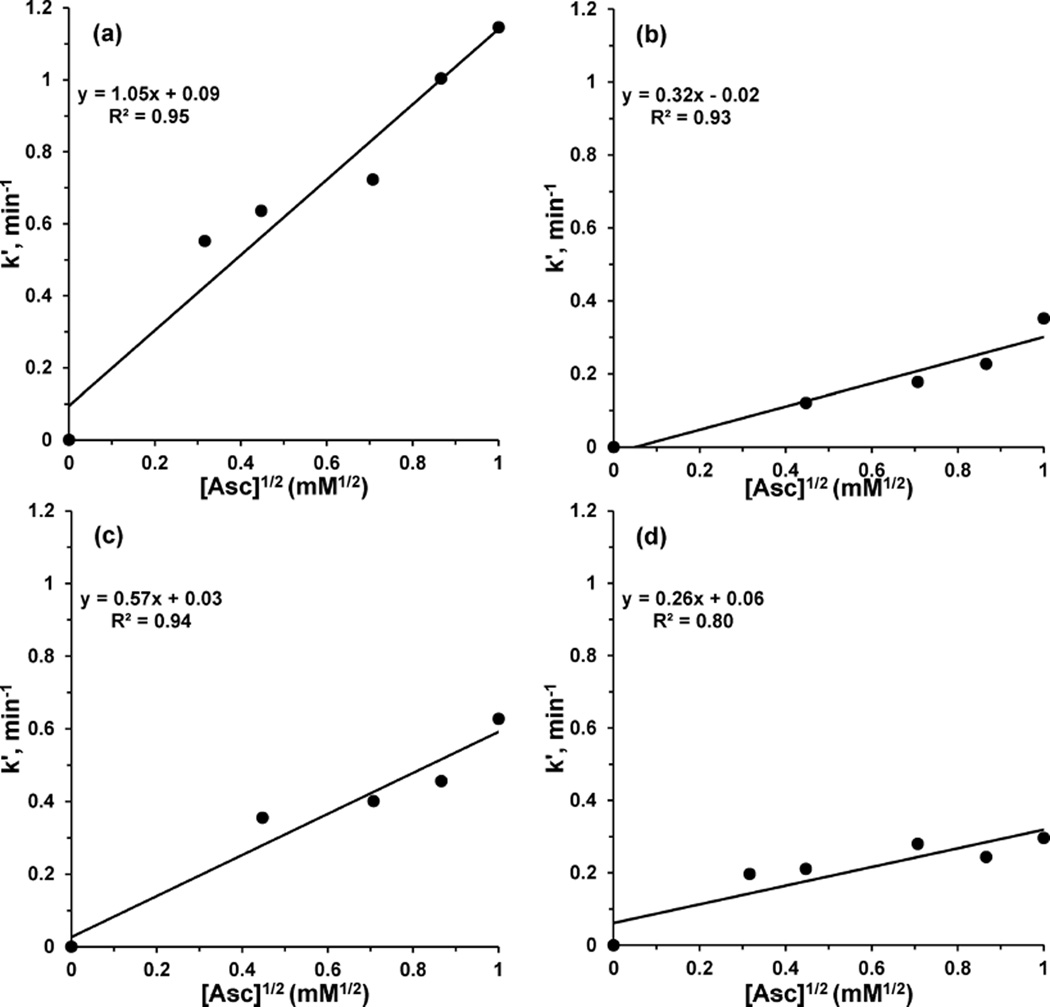
The reductions of azurin variants by excess ascorbic acid were consistent with a first-order reaction with respect to azurin. The resulting pseudo-first-order rate constants, k′, were plotted and linear fits were found versus the square root of ascorbic acid concentration (Figure 10). The linear fits thus supported a half-order reaction with respect to ascorbic acid, which has been observed in other systems94–96 and could arise from a rate-determining outer-sphere electron transfer to the T1 Cu center via the T2 Cu center or some other surface site. Indeed, the reduction of the T2 Cu center before the T1 Cu center is consistent with the EPR experiment discussed above (Figure S5 in the Supporting Information). The resulting rate constant, k, for the overall 1.5-order reaction between the azurin variant and ascorbic acid was determined from the slope (Table 3).
Figure 10.
Plots of the pseudo-first-order rate constants, k′, versus the square root of the ascorbic acid concentration for reduction of azurin variants: (a) Az-NiR3His; (b) Az-PHM3His; (c) Az-NiR; (d) Az-PHM.
Table 3.
Overall Rate Constant, k, and Calculated Absolute Rates of Reduction for 0.5 mM Ascorbic Acid with 100 µM Azurin Variants in 20 mM Sodium Phosphate Buffer pH 6.35
| variant | rate constant, k (min/(mM Asc1/2)) |
abs reduction rate with 0.5 mM ascorbate ((mM Az)/min) |
|---|---|---|
| Az-WT | 0.25(2) | 0.017 |
| Az-NiR | 0.57(4) | 0.043 |
| Az-NiR3His | 1.05(7) | 0.083 |
| Az-PHM | 0.26(4) | 0.024 |
| Az-PHM3His | 0.36(2) | 0.021 |
The overall rate constant (k) for the reaction of azurin with ascorbic acid (Table 3) was found to be highest for Az-NiR3His (1.05 min/(mM Asc1/2)), followed by Az-NiR (0.57 min/(mM Asc1/2)). The values for Az-PHM (0.26 min/(mM Asc1/2)) and Az-PHM3His (0.32 min/(mM Asc1/2)) were even lower. The rate constants were slightly higher or comparable to those of WT azurin (0.26 min/(mM Asc1/2)).
For ready comparison, the absolute rates of reduction of 100 µM azurin with 0.5 mM ascorbate were calculated using the experimentally derived rate constants (Table 3). These reduction rates for the variants with a surface T2 copper site were slightly faster than for WT azurin (0.017 (mM Az)/min), with some variation among the variants themselves. The rate of reduction of Az-NiR3His with 0.5 mM ascorbic acid was the fastest at 0.083 (mM Az)/min. The rate was slower for Az-PHM3His (0.021 (mM Az)/min) and Az-PHM (0.024 (mM Az)/min), while the reduction rate for Az-NiR (0.043 (mM Az)/min) was intermediate in the group. Given that the T1 Cu(II) sites of azurin are conserved in all of these variants, the varied rates of reduction could be due to influences of the different T2 copper centers. Overall, reduction rates for the azurin variants by ascorbate was at least 2 orders of magnitude faster than their reoxidation by nitrite (vide infra), particularly at catalytic ascorbate concentrations of 33 mM.
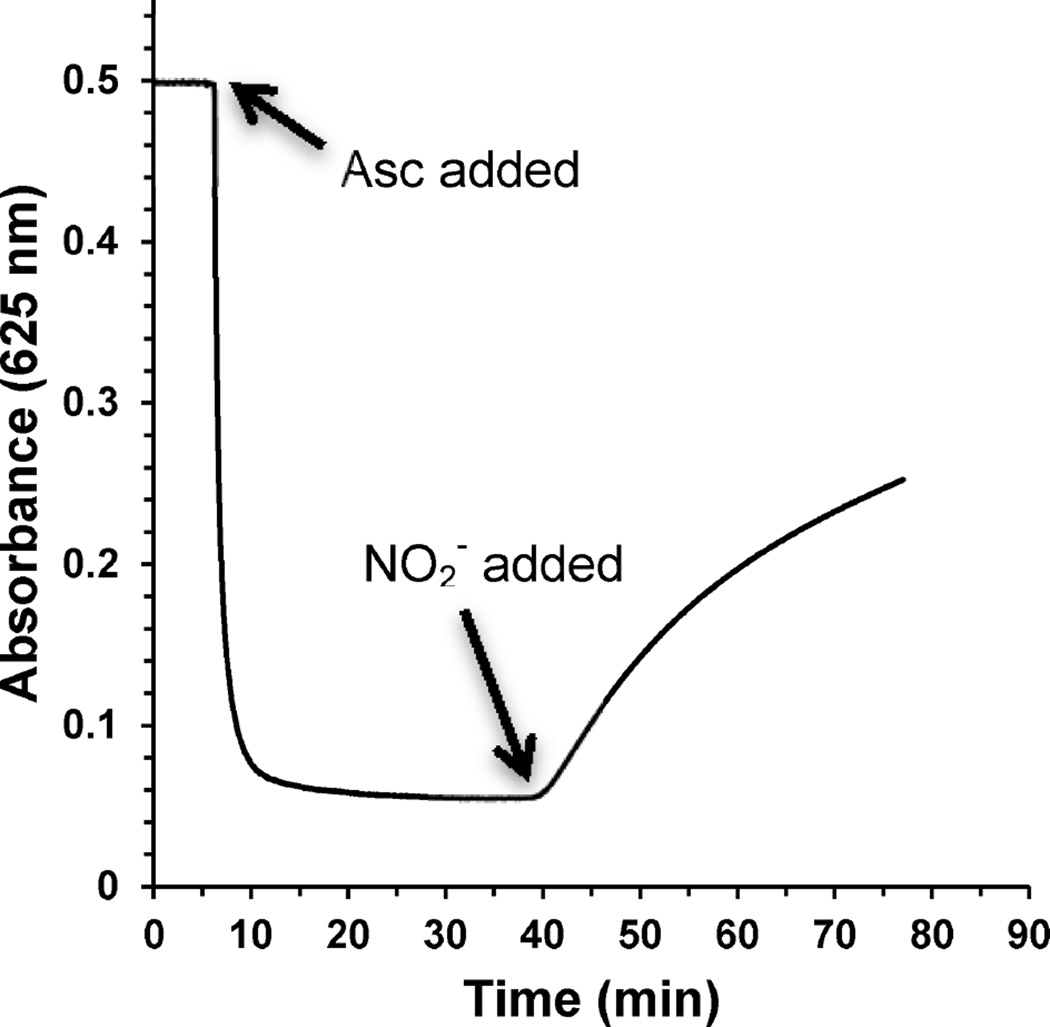
Following the determination of reduction rates of the T1 copper sites, their rates of reoxidation by nitrite were determined. Reduction of azurin variants with 1 equiv of ascorbic acid and the subsequent recovery of blue color (reoxidation of T1 site) with the addition of NO2− was monitored. Since each ascorbic acid molecule provides two electrons, addition of 1 equiv was required to reduce both the T1 and T2 Cu(II) sites in 1 equiv of azurin variant. Experiments with WT azurin required only 0.5 equiv of ascorbic acid for complete reduction, indicating that only one electron was needed per WT azurin. With the protein stably reduced (Figure 11) in the absence of oxygen, NO2− was added in concentrations ranging from 1 to 150 mM. Wild type azurin was not found to reoxidize with addition of up to 150 mM nitrite and after hours of monitoring. However, all azurin variants fully returned blue with the addition of nitrite. As mentioned above, EPR studies demonstrated that the T2 Cu center also reoxidized, but ahead of the T1 Cu center (Figure S5 in the Supporting Information).
Figure 11.
Reduction of 100 µM Az-NiR3His by 1 equiv of ascorbic acid, followed by reoxidation with 5 mM NO2− at 40 min.
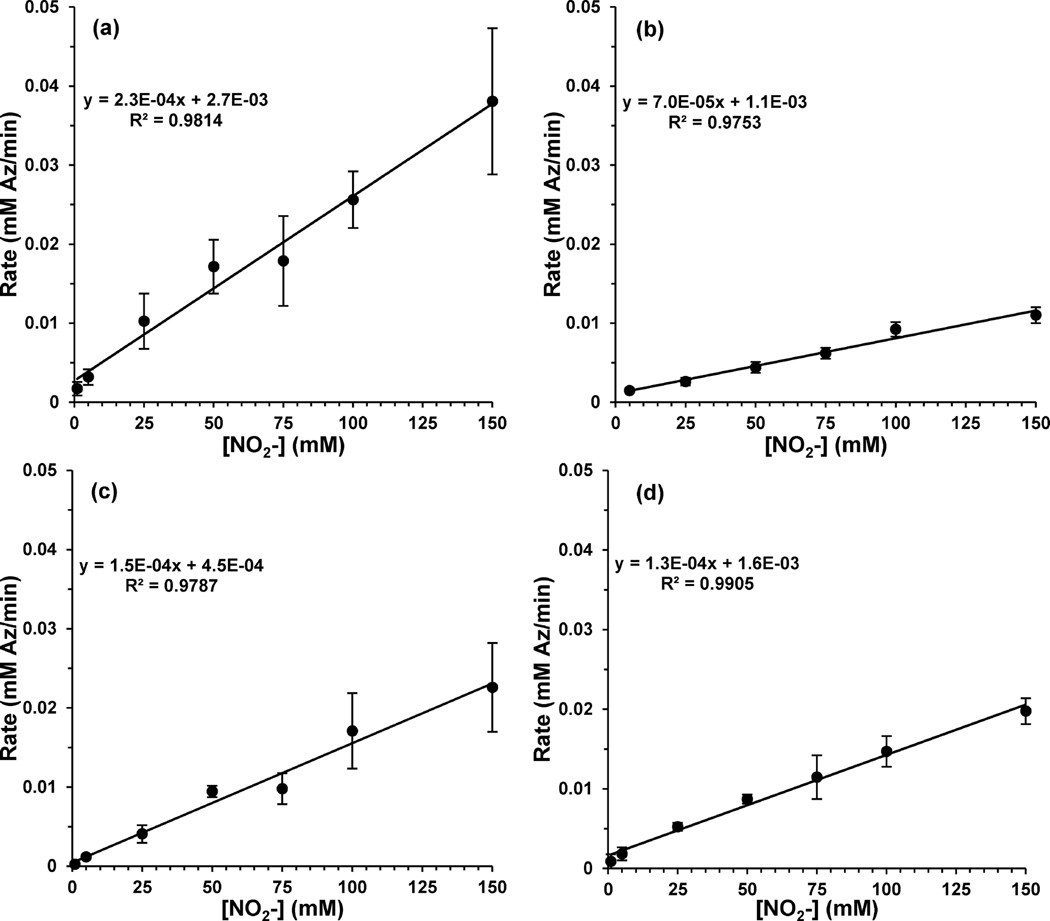
The resulting rates of reoxidation were determined from plots of A625 with time (Figure 11). Griess tests of the reaction or monitoring the A350 nitrite absorption confirmed that nitrite was consumed as the azurin variants reoxidized. The reoxidation curves were fit to an exponential function (data not shown) supporting a first-order reaction with respect to reduced azurin. The initial reoxidation rates were plotted versus nitrite concentration, and the slope of the linear plots yielded reoxidation rate constants for the reaction of nitrite with reduced azurin (Figure 12 and Table 4).
Figure 12.
Plots of the initial reoxidation rates versus nitrite concentration for reduced azurin variants: (a) Az-NiR3His; (b) Az-PHM3His; (c) Az-NiR; (d) Az-PHM.
Table 4.
Rate Constants for the Reoxidation of the Reduced Azurin Variants with NO2−
| variant | reoxidation rate constant (10−4 (mM Az)/(min (mM NO2−))) |
|---|---|
| Az-NiR | 1.5(4) |
| Az-NiR3His | 2.3(7) |
| Az-PHM | 1.3(2) |
| Az-PHM3His | 0.7(1) |
The rate constants for reoxidation of the reduced azurin variants by NO2− were found to be much lower than those found above for azurin reduction by ascorbate. Under typical catalytic Michaelis–Menten conditions discussed above, for example 10 mM nitrite and 33 mM ascorbate, the rate of reduction of azurin is over 100 times faster than reoxidation by NO2− (0.61 versus 0.0023 mM Az/min, respectively, for Az-NiR3His). This therefore makes the reaction with NO2− the rate-determining factor in catalysis.
If reaction with nitrite is rate-limiting, then the catalytic rates might be comparable to the rates of reoxidation. Indeed, Az-NiR3His had the highest rate constant for single turnover reoxidation by NO2− ([2.3(7)] × 10−4 (mM Az)/(min (mM NO2−)) (Table 4), consistent with its highest activity from catalytic Michaelis–Menten parameters (Table 2). Similarly, rates of reoxidation by NO2− for Az-NiR ([1.5(4)] × 10−4 (mM Az)/(min (mM NO2−))) and Az-PHM ([1.3(2)] × 10−4 (mM Az)/(min (mM NO2−))) were slower, consistent with their slower Michaelis–Menten rates. The rate of reoxidation for Az-PHM3His (0.7(1) × 10−4 (mM Az)/(min (mM NO2−))) on the other hand, was the slowest among the variants and inconsistent with its faster Michaelis–Menten parameters. The reason for this anomaly with the Az-PHM3His variant is unclear but could be explained by a slower transfer of electrons from the T1 Cu site to the catalytically necessary T2 Cu center in the single enzyme turnover experiments. Michaelis–Menten parameters were found by observing nitrite loss with time under an excess of reductant, where it was shown that the turnover could be sustained by a T2 copper alone, without the T1 copper necessarily participating. It is possible, therefore, when observing the T1 copper center reoxidize without excess reductant in a single enzyme turnover experiment, that a slower transfer of electrons from the T1 center to the T2 center or nitrite could result in a slower rate.
To summarize, the recovery of the A625 peak upon the addition of NO2− demonstrated that the reoxidation of T1 Cu(I) is correlated with the reduction of NO2− at the T2 center. First, WT azurin did not reoxidize or react with nitrite under these conditions, demonstrating the necessity of a T2 copper center. This suggests that NO2− reacts with the T2 copper site. Furthermore, these reoxidation experiments demonstrated that electrons are transferred from the T1 site to reduce nitrite, thus lending support to the possibility of electron transfer between the T1 and T2 copper centers during catalysis. As further evidence, we used the Griess test to determine that, with 100 µM Az-NiR3His, there was 185 µM nitrite consumed from an addition of 1 mM nitrite. This corresponds to each of the T1 and T2 copper centers donating an electron to reduce nitrite. Finally, for three of the azurin variants (Az-NiR3His, Az-NiR, and Az-PHM), the rates of reoxidation of the T1 copper center are comparable to the rates of nitrite reduction by the Griess assays (see below), indicating a correlation between the rates of nitrite consumption to the rates of loss of electrons from the T1 copper center.
Rates of Reoxidation of Azurin Variants, in Comparison to Michaelis–Menten Rates
The rate of reduction of the azurin variants by ascorbate was at least 2 orders of magnitude larger than the rates of reoxidation with nitrite. This suggested that the rate-limiting step in catalysis is not the reduction of the enzyme but rather the reaction with nitrite. If this were true, then the rates of reduction of nitrite and the rates of reoxidation of the azurin variants would be comparable, depending on the rates of electron transfer between the T1 and T2 copper centers. We indeed found the rates of nitrite reduction, obtained from the catalytic Michaelis–Menten assays using the Griess test, to be comparable within error to the rates of reoxidation, obtained with the azurin variants’ single turnover reoxidation by nitrite. For example, the experimentally determined rate of nitrite reduction using the Griess assay (0.0038(5) mM NO2−/min at 5 mM NO2− (Figure 8)) was similar to the initial rate of reoxidation for Az-NiR3His (0.0032(9) mM Az/min at 5 mM NO2− (Figure 12a)). The same was true for Az-NiR and Az-PHM variants. For example, the Griess assay rates at 5 mM NO2− for Az-NiR was 0.0016(7) (mM NO2−)/min and the reoxidation rate for same nitrite concentration was 0.0011(2) mM Az/min, while the Griess assay rates at 5 mM NO2− for Az-PHM was 0.0023(7) mM NO2−/min and its reoxidation rate was 0.0018(8) mM Az/min. On the other hand, as discussed above, Az-PHM3His showed slower reoxidation rates than Griess assay rates. For example, the Griess assay rate at 5 mM NO2− for Az-PHM3His was 0.0033(9) (mM NO2−)/min and the reoxidation rate at the same nitrite concentration was about 2 times smaller at 0.0014(4) (mM Az/min. As mentioned above, this could be due to a slower rate of electron transfer from the T1 copper site in Az-PHM3His than in the other variants under the single enzyme turnover conditions. Overall, the similarity between the nitrite reduction rates obtained by the Griess assay and the reoxidation rates suggest that the reaction with nitrite was rate limiting.
CONCLUSIONS
The catalytic nitrite reduction behavior of four T2 copper site variants of azurin was characterized. Experiments showed that a T2 copper ion was required for nitrite reduction to NO product and that electrons from the reduced T1 copper center could also be transferred to reduce nitrite. Furthermore, the catalysis was reversible, with the addition of NO(g) resulting in reduction of the T1 copper center and concomitant formation of nitrite. Single turnover experiments showed that the fast step was reduction of the copper centers by ascorbate, thus making the reaction with NO2− the rate-limiting step. This study does not more specifically clarify which part of the NO2− reaction is rate limiting, such as its binding to the active site, electron transfer to bound NO2−, the protonation of the leaving oxide, or product dissociation.
Michaelis–Menten parameters Vmax and KM were reported for the four T2 copper site variants in azurin. The rates of nitrite reduction of azurin variants lacking a surface T2 copper center were the same as WT azurin and background rates. However, T2 Cu only proteins demonstrated rates that were comparable to the T1 Cu + T2 Cu doubly loaded proteins, suggesting that the T1 copper was not involved in the rate-limiting step. This was consistent with the finding that reduction of Cu(II) is very rapid in comparison to the reaction with nitrite, making it likely that the T2 Cu(II) center can be directly reduced by ascorbate, as was suggested previously for native NiRs lacking a T1 Cu center where significant nitrite reduction rates were achieved with small -molecule reductants.77
The differences in Michaelis–Menten parameters for the four T2 azurin variants can be attributed to differences in the T2 copper site motifs. In addition, the discovery that the rate-limiting step is the reaction of nitrite with the T2 copper center puts focus on its redesign as a future direction to improve activity. This could therefore include future rounds of design with variants that improve the KM value for nitrite, such as by modulating nearby charged surface residues that interfere with anion binding.89,90 It could also include variants with proton-donating residues, such as those in native NiR, which were shown to be important for triggering electron transfer in addition to proton transfer to nitrite during the formation of the OH−/H2O product.5,87,88,97
Supplementary Material
Acknowledgments
This work was funded by the U.S. National Institutes of Health award to S.M.B. NIH 1R15-GM097676-01A1. The authors also thank the Swenson Family Foundation for student stipends and support of UMD.
Footnotes
ASSOCIATED CONTENT
Supporting Information
The Supporting Information is available free of charge on the ACS Publications website at DOI: 10.1021/acs.inorgchem.5b03006.
Additional data as described in the text (PDF)
The authors declare no competing financial interest.
REFERENCES
- 1.Nar H, Messerschmidt A, Huber R, van der Kamp M, Canters GW. J. Mol. Biol. 1991;221:765–772. doi: 10.1016/0022-2836(91)80173-r. [DOI] [PubMed] [Google Scholar]
- 2.Suzuki S, Kataoka K, Yamaguchi K. Acc. Chem. Res. 2000;33:728–735. doi: 10.1021/ar9900257. [DOI] [PubMed] [Google Scholar]
- 3.Murphy MEP, Lindley PF, Adman ET. Protein Sci. 1997;6:761–770. doi: 10.1002/pro.5560060402. [DOI] [PMC free article] [PubMed] [Google Scholar]
- 4.Dodd FE, van Beeumen J, Eady RR, Hasnain SS. J. Mol. Biol. 1998;282:369–382. doi: 10.1006/jmbi.1998.2007. [DOI] [PubMed] [Google Scholar]
- 5.Adman ET, Murphy MEP. Copper Nitrite Reductase. In: Messerschmid A, Huber R, Poulos T, Wieghardt K, editors. Handbook of Metalloproteins. Vol. 2. Chichester, UK: Wiley; 2001. pp. 1381–1390. [Google Scholar]
- 6.Averill BA. Chem. Rev. 1996;96:2951–2964. doi: 10.1021/cr950056p. [DOI] [PubMed] [Google Scholar]
- 7.Solomon EI, Chen P, Metz M, Lee SK, Palmer AE. Angew. Chem. Int. Ed. 2001;40:4570–4590. doi: 10.1002/1521-3773(20011217)40:24<4570::aid-anie4570>3.0.co;2-4. [DOI] [PubMed] [Google Scholar]
- 8.Murphy MEP, Turley S, Adman ET. J. Biol. Chem. 1997;272:28455–28460. doi: 10.1074/jbc.272.45.28455. [DOI] [PubMed] [Google Scholar]
- 9.Kuznetsova S, Zauner G, Aartsma TJ, Engelkamp H, Hatzakis N, Rowan AE, Nolte RJM, Christianen PCM, Canters GW. Proc. Natl. Acad. Sci. U. S. A. 2008;105:3250–3255. doi: 10.1073/pnas.0707736105. [DOI] [PMC free article] [PubMed] [Google Scholar]
- 10.Kataoka K, Yamaguchi K, Sakai S, Takagi K, Suzuki S. Biochem. Biophys. Res. Commun. 2003;303:519–524. doi: 10.1016/s0006-291x(03)00381-4. [DOI] [PubMed] [Google Scholar]
- 11.Wijma HJ, MacPherson I, Alexandre M, Diederix REM, Canters GW, Murphy MEP, Verbeet MP. J. Mol. Biol. 2006;358:1081–1093. doi: 10.1016/j.jmb.2006.02.042. [DOI] [PubMed] [Google Scholar]
- 12.Chi Q, Zhang J, Jensen PS, Christensen HEM, Ulstrup J. Faraday Discuss. 2006;131:181–195. doi: 10.1039/b506136a. [DOI] [PubMed] [Google Scholar]
- 13.Wijma HJ, Canters GW, de Vries S, Verbeet MP. Biochemistry. 2004;43:10467–10474. doi: 10.1021/bi0496687. [DOI] [PubMed] [Google Scholar]
- 14.Pinho D, Besson S, Brondino CD, De Castro B, Moura I. Eur. J. Biochem. 2004;271:2361–2369. doi: 10.1111/j.1432-1033.2004.04155.x. [DOI] [PubMed] [Google Scholar]
- 15.Boulanger MJ, Murphy MEP. Protein Sci. 2003;12:248–256. doi: 10.1110/ps.0224503. [DOI] [PMC free article] [PubMed] [Google Scholar]
- 16.Prudencio M, Eady RR, Sawers G. Biochem. J. 2001;353:259–266. doi: 10.1042/0264-6021:3530259. [DOI] [PMC free article] [PubMed] [Google Scholar]
- 17.Boulanger MJ, Kukimoto M, Nishiyama M, Horinouchi S, Murphy MEP. J. Biol. Chem. 2000;275:23957–23964. doi: 10.1074/jbc.M001859200. [DOI] [PubMed] [Google Scholar]
- 18.Olesen K, Veselov A, Zhao Y, Wang Y, Danner B, Scholes CP, Shapleigh JP. Biochemistry. 1998;37:6086–6094. doi: 10.1021/bi971603z. [DOI] [PubMed] [Google Scholar]
- 19.Strange RW, Dodd FE, Abraham ZH, Grossmann JG, Brueser T, Eady RR, Smith BE, Hasnain SS. Nat. Struct. Biol. 1995;2:287–292. doi: 10.1038/nsb0495-287. [DOI] [PubMed] [Google Scholar]
- 20.Shoun H, Kobayashi M. J. Biol. Chem. 1995;270:4146–4151. doi: 10.1074/jbc.270.8.4146. [DOI] [PubMed] [Google Scholar]
- 21.Iwasaki H, Matsubara T. J. Biochem. (Tokyo) 1972;71:645–652. [PubMed] [Google Scholar]
- 22.Wijma HJ, Jeuken LJC, Verbeet MP, Armstrong FA, Canters GW. J. Biol. Chem. 2006;281:16340–16346. doi: 10.1074/jbc.M601610200. [DOI] [PubMed] [Google Scholar]
- 23.Abraham ZHL, Smith BE, Howes BD, Lowe DJ, Eady RR. Biochem. J. 1997;324:511–516. doi: 10.1042/bj3240511. [DOI] [PMC free article] [PubMed] [Google Scholar]
- 24.Wojciech P, Nicholas MDJD. Biochim. Biophys. Acta. Protein Struct. Mol. Enzymol. 1985;828:130–137. [Google Scholar]
- 25.Kakutani T, Watanabe H, Arima K, Beppu T. J. Biochem. (Tokyo) 1981;89:453–461. doi: 10.1093/oxfordjournals.jbchem.a133220. [DOI] [PubMed] [Google Scholar]
- 26.Merkle AC, Lehnert N. Dalton Trans. 2012;41:3355–3368. doi: 10.1039/c1dt11049g. [DOI] [PubMed] [Google Scholar]
- 27.Tolman WB. JBIC, J. Biol. Inorg. Chem. 2006;11:261–271. doi: 10.1007/s00775-006-0078-9. [DOI] [PubMed] [Google Scholar]
- 28.Wasser IM, de Vries S, Moenne-Loccoz P, Schroeder I, Karlin KD. Chem. Rev. 2002;102:1201–1234. doi: 10.1021/cr0006627. [DOI] [PubMed] [Google Scholar]
- 29.Woollard-Shore JG, Holland JP, Jones MW, Dilworth JR. Dalton Trans. 2010;39:1576–1585. doi: 10.1039/b913463h. [DOI] [PubMed] [Google Scholar]
- 30.Nagao H, Komeda N, Mukaida M, Suzuki M, Tanaka K. Inorg. Chem. 1996;35:6809–6815. doi: 10.1021/ic960303n. [DOI] [PubMed] [Google Scholar]
- 31.Isoda N, Yokoyama H, Nojiri M, Suzuki S, Yamaguchi K. Bioelectrochemistry. 2010;77:82–88. doi: 10.1016/j.bioelechem.2009.06.013. [DOI] [PubMed] [Google Scholar]
- 32.Hiratsu T, Suzuki S, Yamaguchi K. Chem. Commun. (Cambridge, U. K.) 2005:4534–4535. doi: 10.1039/b507932b. [DOI] [PubMed] [Google Scholar]
- 33.Migita Y, Yokoyama H, Minami A, Mori T, Nojiri M, Suzuki S, Yamaguchi K. Electroanalysis. 2009;21:2441–2446. [Google Scholar]
- 34.Yu F, Penner-Hahn JE, Pecoraro VL. J. Am. Chem. Soc. 2013;135:18096–18107. doi: 10.1021/ja406648n. [DOI] [PMC free article] [PubMed] [Google Scholar]
- 35.Tegoni M, Yu F, Bersellini M, Penner-Hahn JE, Pecoraro VL. Proc. Natl. Acad. Sci. U. S. A. 2012;109:21234–21239. doi: 10.1073/pnas.1212893110. [DOI] [PMC free article] [PubMed] [Google Scholar]
- 36.Halfen JA, Mahapatra S, Wilkinson EC, Gengenbach A, Young VG, Jr, Que L, Tolman WB. J. Am. Chem. Soc. 1996;118:763–776. [Google Scholar]
- 37.Casella L, Carugo O, Gullotti M, Doldi S, Frassoni M. Inorg. Chem. 1996;35:1101–1113. doi: 10.1021/ic950392o. [DOI] [PubMed] [Google Scholar]
- 38.Beretta M, Bouwman E, Casella L, Douziech B, Driessen WL, Gutierrez-Soto L, Monzani E, Reedijk J. Inorg. Chim. Acta. 2000;310:41–50. [Google Scholar]
- 39.Komeda N, Nagao H, Kushi Y, Adachi Gy, Suzuki M, Uehara A, Tanaka K. Bull. Chem. Soc. Jpn. 1995;68:581–589. [Google Scholar]
- 40.Kujime M, Fujii H. Angew. Chem. Int. Ed. 2006;45:1089–1092. doi: 10.1002/anie.200503555. [DOI] [PubMed] [Google Scholar]
- 41.Chen CS, Yeh W-Y. Chem. Commun. (Cambridge U. K.) 2010;46:3098–3100. doi: 10.1039/b927513d. [DOI] [PubMed] [Google Scholar]
- 42.Chuang WJ, Lin IJ, Chen HY, Chang YL, Hsu SCN. Inorg. Chem. 2010;49:5377–5384. doi: 10.1021/ic100083b. [DOI] [PubMed] [Google Scholar]
- 43.Kujime M, Izumi C, Tomura M, Hada M, Fujii H. J. Am. Chem. Soc. 2008;130:6088–6098. doi: 10.1021/ja075575b. [DOI] [PubMed] [Google Scholar]
- 44.Berry SM, Mayers JR, Zehm NA. JBIC, J. Biol. Inorg. Chem. 2009;14:143–149. doi: 10.1007/s00775-008-0432-1. [DOI] [PubMed] [Google Scholar]
- 45.Chang TK, Iverson SA, Rodrigues CG, Kiser CN, Lew AYC, Germanas JP, Richards JH. Proc. Natl. Acad. Sci. U. S. A. 1991;88:1325–1329. doi: 10.1073/pnas.88.4.1325. [DOI] [PMC free article] [PubMed] [Google Scholar]
- 46.Nurizzo D, Silvestrini MC, Mathieu M, Cutruzzola F, Bourgeois D, Fulop V, Hajdu J, Brunori M, Tegoni M, Cambillau C. Structure (Oxford, U. K.) 1997;5:1157–1171. doi: 10.1016/s0969-2126(97)00267-0. [DOI] [PubMed] [Google Scholar]
- 47.Boyd WC. J. Biol. Chem. 1965;240:4097–4098. [PubMed] [Google Scholar]
- 48.Berry SM, Gieselman MD, Nilges MJ, Van der Donk WA, Lu Y. J. Am. Chem. Soc. 2002;124:2084–2085. doi: 10.1021/ja0169163. [DOI] [PubMed] [Google Scholar]
- 49.Ralle M, Berry SM, Nilges MJ, Gieselman MD, Van der Donk WA, Lu Y, Blackburn NJ. J. Am. Chem. Soc. 2004;126:7244–7256. doi: 10.1021/ja031821h. [DOI] [PubMed] [Google Scholar]
- 50.Minakata K, Suzuki O, Horio F. Clinical Chemistry (Washington, DC, United States) 2001;47:1863–1865. [PubMed] [Google Scholar]
- 51.Nilges MJ. SIMPOW6, EPR simulation program. Urbana-Champaign, IL: EPR Research Center (IERC), University of Illinois; [Google Scholar]
- 52.Jeuken LJC, Armstrong FA. J. Phys. Chem. B. 2001;105:5271–5282. [Google Scholar]
- 53.Berry SM, Baker MH, Reardon NJ. J. Inorg. Biochem. 2010;104:1071–1078. doi: 10.1016/j.jinorgbio.2010.06.004. [DOI] [PubMed] [Google Scholar]
- 54.Armstrong FA. Struct. Bonding (Berlin) 1990;72:137–221. [Google Scholar]
- 55.Eddowes MJ, Hill HAO. Adv. Chem. Ser. 1982;201:173–197. [Google Scholar]
- 56.Moody AJ, Shaw FL. Anal. Biochem. 2006;356:154–156. doi: 10.1016/j.ab.2006.05.026. [DOI] [PubMed] [Google Scholar]
- 57.Miranda KM, Espey MG, Wink DA. Nitric Oxide. 2001;5:62–71. doi: 10.1006/niox.2000.0319. [DOI] [PubMed] [Google Scholar]
- 58.Tracey WR. NeuroProtocols. 1992;1:125–131. [Google Scholar]
- 59.Giustarini D, Rossi R, Milzani A, Dalle-Donne I. Methods Enzymol. 2008;440:361–380. doi: 10.1016/S0076-6879(07)00823-3. [DOI] [PubMed] [Google Scholar]
- 60.Steiner AA, Van Winden H. Plant Physiol. 1970;46:862–863. doi: 10.1104/pp.46.6.862. [DOI] [PMC free article] [PubMed] [Google Scholar]
- 61.Monzani E, Koolhaas GJAA, Spandre A, Leggieri E, Casella L, Gullotti M, Nardin G, Randaccio L, Fontani M, Zanello P, Reedijk J. JBIC, J. Biol. Inorg. Chem. 2000;5:251–261. doi: 10.1007/s007750050369. [DOI] [PubMed] [Google Scholar]
- 62.Brown CA, Pavlosky MA, Westre TE, Zhang Y, Hedman B, Hodgson KO, Solomon EI. J. Am. Chem. Soc. 1995;117:715–732. [Google Scholar]
- 63.Jacobson F, Pistorius A, Farkas D, De Grip W, Hansson O, Sjoelin L, Neutze R. J. Biol. Chem. 2006;282:6347–6355. doi: 10.1074/jbc.M605746200. [DOI] [PubMed] [Google Scholar]
- 64.Wijma HJ, Boulanger MJ, Molon A, Fittipaldi M, Huber M, Murphy MEP, Verbeet MP, Canters GW. Biochemistry. 2003;42:4075–4083. doi: 10.1021/bi027270+. [DOI] [PubMed] [Google Scholar]
- 65.Amundsen AR, Whelan J, Bosnich B. J. Am. Chem. Soc. 1977;99:6730–6739. doi: 10.1021/ja00462a042. [DOI] [PubMed] [Google Scholar]
- 66.Pantoliano MW, Valentine JS, Nafie LA. J. Am. Chem. Soc. 1982;104:6310–6317. [Google Scholar]
- 67.Lu Y, Roe JA, Bender CJ, Peisach J, Banci L, Bertini I, Gralla EB, Valentine JS. Inorg. Chem. 1996;35:1692–1700. doi: 10.1021/ic9513189. [DOI] [PubMed] [Google Scholar]
- 68.Romanowski SMdM, Tormena F, dos Santos VA, Hermann MdF, Mangrich AS. J. Braz. Chem. Soc. 2004;15:897–903. [Google Scholar]
- 69.Tomlinson AAG, Hathaway BJ. J. Chem. Soc. A. 1968:2578–2583. [Google Scholar]
- 70.Tomlinson AAG, Hathaway BJ. J. Chem. Soc. A. 1968:1905–1909. [Google Scholar]
- 71.Hathaway BJ. J. Chem. Soc. Dalton Trans. 1972:1196–1199. [Google Scholar]
- 72.Pantoliano MW, Valentine JS, Mammone RJ, Scholler DM. J. Am. Chem. Soc. 1982;104:1717–1723. [Google Scholar]
- 73.Chen P, Bell J, Eipper BA, Solomon EI. Biochemistry. 2004;43:5735–5747. doi: 10.1021/bi0362830. [DOI] [PubMed] [Google Scholar]
- 74.Chufan EE, Prigge ST, Siebert X, Eipper BA, Mains RE, Amzel LM. J. Am. Chem. Soc. 2010;132:15565–15572. doi: 10.1021/ja103117r. [DOI] [PMC free article] [PubMed] [Google Scholar]
- 75.Lu Y. Electron transfer: Cupredoxins. In: Que LJ, Tolman WB, editors. Biocoordination Chemistry. Vol. 8. Oxford, U.K: Elsevier; 2004. pp. 91–122. [Google Scholar]
- 76.Suzuki S, Deligeer, Yamaguchi K, Kataoka K, Kobayashi K, Tagawa S, Kohzuma T, Shidara S, Iwasaki H. JBIC, J. Biol. Inorg. Chem. 1997;2:265–274. [Google Scholar]
- 77.Kukimoto M, Nishiyama M, Murphy MEP, Turley S, Adman ET, Horinouchi S, Beppu T. Biochemistry. 1994;33:5246–5252. doi: 10.1021/bi00183a030. [DOI] [PubMed] [Google Scholar]
- 78.Howes BD, Abraham ZHL, Lowe DJ, Bruser T, Eady RR, Smith BE. Biochemistry. 1994;33:3171–3177. doi: 10.1021/bi00177a005. [DOI] [PubMed] [Google Scholar]
- 79.Fittipaldi M, Wijma HJ, Verbeet MP, Canters GW, Groenen EJJ, Huber M. Biochemistry. 2005;44:15193–15202. doi: 10.1021/bi0513913. [DOI] [PubMed] [Google Scholar]
- 80.Nairn AK, Archibald SJ, Bhalla R, Gilbert BC, Maclean EJ, Teat SJ, Walton PH. Dalton Trans. 2006:172–176. doi: 10.1039/b512296c. [DOI] [PubMed] [Google Scholar]
- 81.Boas JF. Electron Paramagnetic Resonance of Copper Proteins. Vol. 1. Boca Raton, FL: CRC Press; 1984. pp. 5–62. [Google Scholar]
- 82.Kobayashi K, Tagawa S, Deligeer, Suzuki S. J. Biochem. 1999;126:408–412. doi: 10.1093/oxfordjournals.jbchem.a022465. [DOI] [PubMed] [Google Scholar]
- 83.Suzuki S, Kataoka K, Yamaguchi K, Inoue T, Kai Y. Coord. Chem. Rev. 1999:190–192. 245–265. [Google Scholar]
- 84.Farver O, Eady RR, Abraham HL, Pecht I. FEBS Lett. 1998;436:239–242. doi: 10.1016/s0014-5793(98)01120-x. [DOI] [PubMed] [Google Scholar]
- 85.Gorren ACF, De Boer E, Wever R. Biochim. Biophys. Acta, Protein Struct. Mol. Enzymol. 1987;916:38–47. doi: 10.1016/0167-4838(87)90208-1. [DOI] [PubMed] [Google Scholar]
- 86.Tocheva EI, Rosell FI, Mauk AG, Murphy MEP. Biochemistry. 2007;46:12366–12374. doi: 10.1021/bi701205j. [DOI] [PubMed] [Google Scholar]
- 87.Ghosh S, Dey A, Sun Y, Scholes CP, Solomon EI. J. Am. Chem. Soc. 2009;131:277–288. doi: 10.1021/ja806873e. [DOI] [PMC free article] [PubMed] [Google Scholar]
- 88.Ghosh S, Dey A, Usov OM, Sun Y, Grigoryants VM, Scholes CP, Solomon EI. J. Am. Chem. Soc. 2007;129:10310–10311. doi: 10.1021/ja072841c. [DOI] [PMC free article] [PubMed] [Google Scholar]
- 89.Getzoff ED, Cabelli DE, Fisher CL, Parge HE, Viezzoli MS, Banci L, Hallewell RA. Nature. 1992;358:347–351. doi: 10.1038/358347a0. [DOI] [PubMed] [Google Scholar]
- 90.Getzoff ED, Tainer JA, Weiner PK, Kollman PA, Richardson JS, Richardson DC. Nature. 1983;306:287–290. doi: 10.1038/306287a0. [DOI] [PubMed] [Google Scholar]
- 91.Kataoka K, Furusawa H, Takagi K, Yamaguchi K, Suzuki S. J. Biochem. 2000;127:345–350. doi: 10.1093/oxfordjournals.jbchem.a022613. [DOI] [PubMed] [Google Scholar]
- 92.Akhtar MJ, Haim A. Inorg. Chem. 1988;27:1608–1610. [Google Scholar]
- 93.Creutz C. Inorg. Chem. 1981;20:4449–4452. [Google Scholar]
- 94.Pap JS, Szywriel L, Rowinska-Zyrek M, Nikitin K, Fritsky IO, Kozlowski H. J. Mol. Catal. A: Chem. 2011;334:77–82. [Google Scholar]
- 95.Jameson RF, Blackburn NJ. J. Inorg. Nucl. Chem. 1975;37:809–814. [Google Scholar]
- 96.Jameson RF, Blackburn NJ. J. Chem. Soc. Dalton Trans. 1976:1596–1602. [Google Scholar]
- 97.Adman ET, Godden JW, Turley S. J. Biol. Chem. 1995;270:27458–27474. doi: 10.1074/jbc.270.46.27458. [DOI] [PubMed] [Google Scholar]
Associated Data
This section collects any data citations, data availability statements, or supplementary materials included in this article.


