Abstract
Context
Transitional disks are structures of dust and gas around young stars with large inner cavities in which planet formation may occur. Lopsided dust distributions are observed in the dust continuum emission at millimeter wavelengths. These asymmetrical structures can be explained as being the result of an enhanced gas density vortex where the dust is trapped, potentially promoting the rapid growth to the planetesimal scale.
Aims
AB Aur hosts a transitional disk with a clear horseshoe morphology which strongly suggests the presence of a dust trap. Our goal is to investigate its formation and the possible effects on the gas chemistry.
Methods
We used the NOEMA (NOrthern Extended Millimeter Array) interferometer to image the 1mm continuum dust emission and the 13CO J=2 →1, C18OJ=2 →1, SO J=56 →45, and H2CO J=303 →202 rotational lines.
Results
Line integrated intensity ratio images are built to investigate the chemical changes within the disk. The I(H2CO J=303 →202)/I(C18O J=2→1) ratio is fairly constant along the disk with values of ~0.15±0.05. On the contrary, the I(SO J=56 →45)/I(C18O J=2 →1) and I(SO J=56 →45)/I(H2CO J=303 →202) ratios present a clear northeast-southwest gradient (a factor of 3–6) with the minimum towards the dust trap. This gradient cannot be explained by a local change in the excitation conditions but by a decrease in the SO abundance. Gas densities up to ~109 cm−3 are expected in the disk midplane and two-three times larger in the high pressure vortex. We have used a single point (n,T) chemical model to investigate the lifetime of gaseous CO, H2CO, and SO in the dust trap. Our model shows that for densities >107 cm−3, the SO molecules are depleted (directly frozen, or converted into SO2 and then frozen out) in less than 0.1 Myr. The lower SO abundance towards the dust trap could indicate that a larger fraction of the gas is in a high density environment.
Conclusions
Gas dynamics, grain growth and gas chemistry are coupled in the planet formation process. We detect a chemical signature of the presence of a dust trap in a transitional disk. Because of the strong dependence of SO abundance on the gas density, the sulfur chemistry can be used as a chemical diagnostic to detect the birthsites of future planets. However, the large uncertainties inherent to chemical models and the limited knowledge of the disk’s physical structure and initial conditions are important drawbacks.
Keywords: stars: formation; stars: individual AB Aur; stars: pre-main sequence; stars: variables: T Tauri, Herbig Ae/Be; circumstellar matter; protoplanetary disks
1. Introduction
Transitional disks are objects around young stars with large cavities cleared of small dust grains in the inner disk regions. The formation of planetesimals requires that primordial dust grains grow from micron-to km-sized bodies. Lopsided dust distributions have been commonly identified in transitional disks using the dust continuum emission at millimeter wavelengths (Espaillat et al. 2014). It is possible that the size distribution of the dust grains is not uniform throughout the disk: micron-and millimeter-sized grains may have different distributions (van der Marel et al. 2013, 2015; Pinilla et al. 2015). Asymmetrical structures tend to be formed when dust grains become trapped in a high gas density vortex potentially promoting rapid growth to the planetesimal scale (Birnstiel et al. 2013). Dust traps are, therefore, exciting features that could be related to protoplanets buried in the disk. However, the detection of dust traps remains difficult in molecular lines.
The Herbig Ae star AB Aurigae (AB Aur) hosts a well-known transitional disk. AB Aur has a spectral type A0-A1 (Hernández et al. 2004). It has M⭑ ~2.4 Mʘ, Teff ~ 9500 K, and it is located at a distance of 145 pc (van den Ancker et al. 1998). Several single-dish and interferometric molecular studies have been carried out towards this disk (Semenov et al. 2005; Corder et al. 2005; Piétu et al. 2005; Lin et al. 2006; Schreyer et al. 2008; Tang et al. 2012). Interferometric images of the CO J=2→1 and 13CO J=2→1 lines and the continuum emission at 1.3 mm revealed that the AB Aur dusty disk is truncated at an inner radius of about 70 AU (~0″.5) (Piétu et al. 2005). Subsequent higher angular resolution observations proved the existence of a compact inner disk with a different inclination from that of the outer ring (Tang et al. 2012). The 1.3mm continuum emission from the dusty ring is highly asymmetric in azimuth presenting a lopsided morphology with the maximum toward the southwest. Thus far, this horseshoe morphology has been observed in a few transitional disks (e.g., IRS 48: van der Marel et al. 2013; HD 142527: Casassus et al. 2013) and has been interpreted as the birthsite of future planets. This horseshoe morphology is expected when a so-called Rossby-Wave instability is developed at the sharp edge of the gap. The dust emission maximum corresponds to a gas pressure maximum where the dust particles are trapped for long timescales, a few 0.1 Myr, permitting the formation of planetesimals (km-sized particles).
Earlier observational studies have shown a scarcity of molecular line detections in AB Aur (Semenov et al. 2005; Schreyer et al. 2008). A similar result was found by Öberg et al. (2011) in a larger sample of Herbig Ae stars. This is mainly due to the low molecular abundances in the gas disk caused by the intense UV radiation from the central star and the freeze out of the molecules onto dust grains. Recently, Pacheco-Vázquez et al. (2015) have carried out a molecular search towards AB Aur using the IRAM 30m telescope. As a result, they detected several lines of CO and its isotopologues the HCO+, H2CO, HCN, CN, and CS lines. In addition, they detected the SO J=54→33 and J=56→45 lines for the first time. AB Aur is the only protoplanetary disk detected in SO thus far, and its detection is consistent with the interpretation of this disk being younger than those associated with T Tauri stars.
In this paper we present high angular resolution interferometric images of the 1mm continuum, the 13CO J=2→1, C18O J=2→1, H2CO J=30,3 → 20,2, and SO J=56 → 45 lines. Sulfur monoxide (SO) has been imaged in the transitional disk around the Herbig Ae star, AB Auriga. This species presents an odd spatial distribution with lack of emission toward the dust trap. Time-dependent chemical models are used to explain the observed behavior.
Our high angular resolutions images show, for the first time, a potential chemical footprint of a dust trap in a transitional disk.
2. Observations
The interferometric observations were carried out with the NOEMA interferometer in CD configuration between October and December, 2014 with six antennas providing the angular resolution and rms shown in Table 1. We targeted AB Aur (αJ2000=04h 55 m 45.8 s, δJ2000=30° 33’ 04”.2) to simultaneously observe the H2CO J=30,3 →20,2 line at 218.222 GHz, the SO J=56 →45 line at 219.949 GHz, the C18O J=2→1 line at 219.560 GHz, and the 13CO J=2→1 line at 220.398 GHz. The beam size was 1″6×1″5. The channels free of line emission were used to estimate the continuum flux that was subtracted from the spectral maps. To improve the S/N, all maps were created with a velocity resolution of 0.25 km s−1.
Table 1.
NOEMA interferometer map parameters.
| Species | Freq. GHz | Beam arcsec | PA ° | Eu K | Aul s–1 | Noise Jy beam–1 | Δv km s–1 |
| 13CO 2-1 | 220.398684 | 1.64×1.53 | 1 | 15.9 | 6.08e-07 | 2.3e-02 | 0.2 |
| C18O 2-1 | 219.560357 | 1.64×1.53 | 1 | 15.8 | 6.01e-07 | 2.3e-02 | 0.2 |
| H2CO 303-202 | 218.222192 | 1.65×1.55 | 3 | 21.0 | 2.82e-04 | 3.1e-02 | 0.1 |
| SO 56-45 | 219.949442 | 1.65×1.53 | 1 | 35.0 | 1.36e-04 | 3.2e-02 | 0.1 |
We used 3C84, 3C454.3, MWC349, J0433, and J0418 as phase and flux calibrators. The uncertainty in the calibration is about 10%. Data reduction and image synthesis were carried out using the GILDAS software.
In Fig. A.1 we compare the interferometric fluxes measured with NOEMA with those obtained with the 30m telescope by Pacheco-Vázquez et al. (2015). The interferometric spectra were obtained by fitting an elliptical Gaussian to the emission of each channel in the uv-plane. The interferometer recovers almost all the flux for the C18O J=2→1, H2CO J=40,3→20,2, and SO J=56→ 45 lines. As expected, a significant fraction of the flux (>75%) is missing in the 13CO J=2→1 line. We note that in some channels of the C18O line, the NOEMA flux is higher than that of the 30m telescope. This is physically unacceptable and most likely due to errors in the baseline of the 30m data. We note that the 30m observations were performed using the wobbler switching procedure and the cloud emission is, at least partially, subtracted with the OFF position. The absence of missing flux does not imply the absence of an extended component, which indeed exists in the case of C18O (see Fuente et al. 2002, 2010; Semenov et al. 2005).
3. Results
3.1. NOEMA data
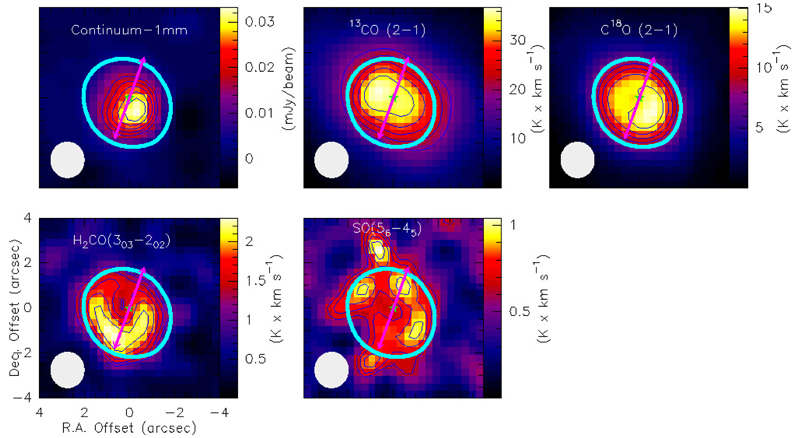
Figure 1 shows our interferometric images of the 13CO J=2→1, C18O J=2→1, H2CO J=30,3 → 20,2, and SO J=56 → 45 lines as observed with NOEMA (IRAM) providing an angular resolution of ~ 1”.6 (~ 230 AU). The emission of the molecular lines coincides with the ring detected in the dust continuum emission, but significant differences exist among their azimuthal spatial distributions (see Fig. A.4). The asymmetry observed in the continuum emission is smeared out in the map of the 13CO J=2→1 line. This is not surprising since this line is optically thick and it mainly traces the gas temperature at an intermediate gas layer between the disk surface and the equatorial plane.
Fig. 1.
NOEMA images of the circumstellar disk around AB Aur. The 1mm continuum dust emission map, and the velocity-integrated intensity images from 3.5 to 8 km s−1 of the 13CO J=2 →1, C18O J=2 →1, SO J=56 →45, and H2CO J=303 →202 lines. White ellipses in the bottom left corner of each panel represents the beam size (~1″.6×1″5). Contour levels are 50% to 90% in steps 10% of the maximum value (34 mJy beam–1 for the continuum, 37 K × km s−1 for the 13CO J=2→0, 15 K × km s−1 for the C18O J=2→0, 2.3 K × km s−1 for the H2CO J=30,3 → 20,2, and 1.0 K × km s−1 for the SO). The thick blue contour indicates the 50% level of the C18O emission. The arrow shows the direction of the ionized jet (Rodríguez et al. 2014).
The spatial distribution of the C18O J=2→1 line is very similar to that of the dust continuum emission. The ratio between 1mm continuum and C18O J=2→1 emission (1mm continuum)/(C18O 2→1) is uniform in the disk within a factor of < 2. Taking into account the uncertainties in the dust temperature and dust opacities and based on our observations, we considered that there is no clear evidence that the gas-to-dust mass ratio varies inside the dust trap. We cannot discard possible variations of the gas-to-dust mass ratio at smaller scales (<< 230 AU) that are not detected with the angular resolution of our observations. The H2CO J=30,3 → 20,2 emission peak is not coincident with the dust trap defined by the 1mm continuum and the C18O J=2→1 emissions, but extends toward the south. The most extreme case is that of the SO J=56 → 45 line that presents an almost uniform emission along the ring, with an enhancement toward the northeast.
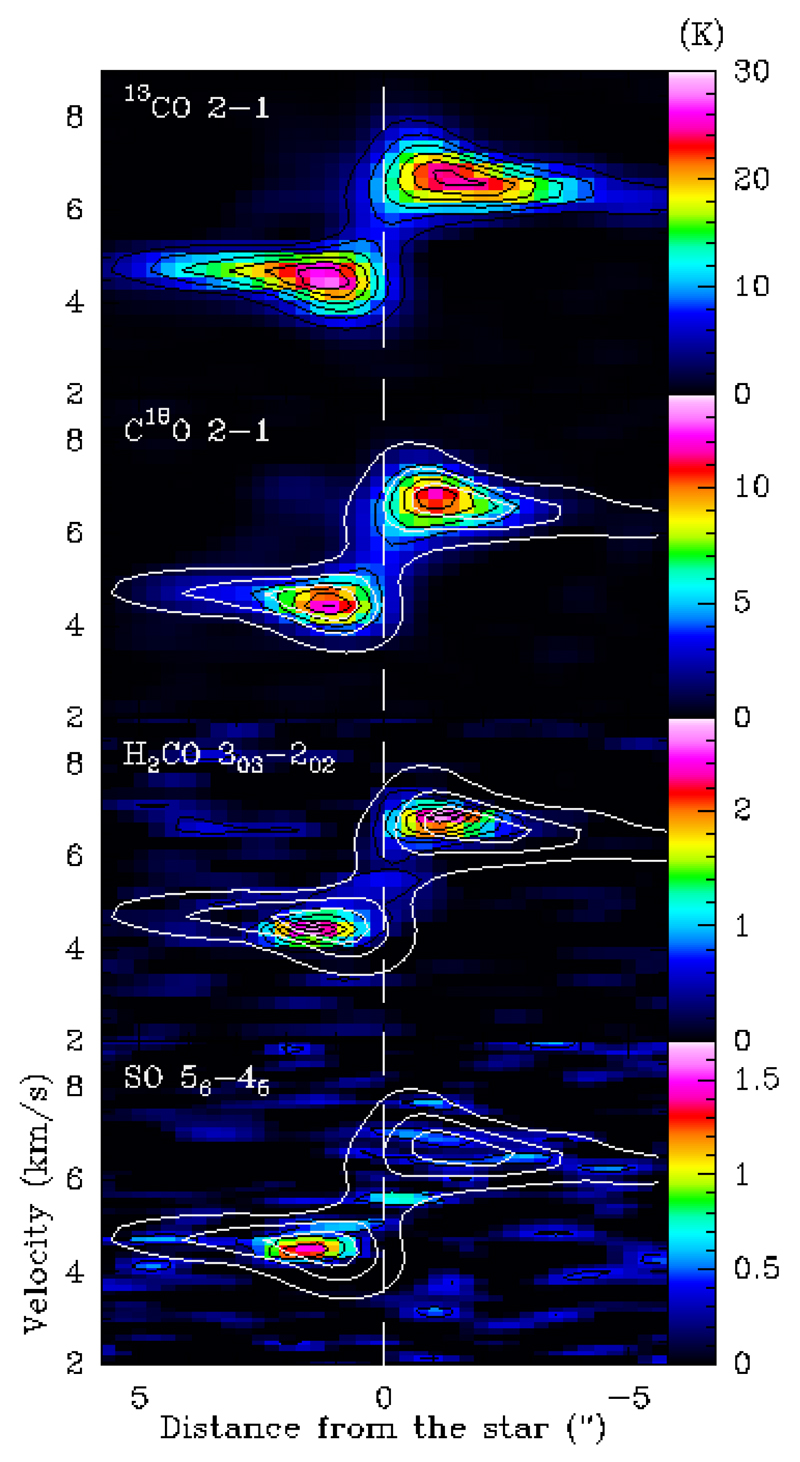
The SO molecule is a well-known tracer of shocked gas and has been widely studied in the bipolar outflows associated with low mass Class 0 and I protostars (Chernin & Masson 1993; Bachiller et al. 2001; Wakelam et al. 2005; Codella et al. 2005; Tafalla et al. 2010). Recently, the high spatial resolution observations provided by ALMA have permitted the detection of a new component of the SO emission in very young protostars. Sakai et al. (2014) and Podio et al. (2015) have detected disksize rotating rings around the Class 0 protostars L1527 and HH 212, respectively. In both cases, they have been interpreted as the consequence of the shocks produced by the accretion of material in the disk-envelope interface. In order to investigate the origin of the SO emission in AB Aur, we studied the velocity structure of its emission. The velocity structure of the SO emission is consistent with the rotating disk pattern traced by 13CO J=2→1 (see Fig. 2), suggesting that its emission could be coming from the protoplanetary disk. However, the poor S/N ratio of our observations prevents us from drawing a firm conclusion. We cannot discard other interpretations such as the emission coming from a rotating ring. Surprisingly, towards the dust trap the SO emission is not detected down to our sensitivity limit (rms=2 mJy/beam=0.2 K in a channel of 0.25 km s−1).
Fig. 2.
Position-velocity diagrams along the major axis of the disk, from the NE to the SW as defined in Piétu et al. (2005). For comparison, we have overlaid the contours of the 13CO J=2→1 line in all panels. We note that there is an important asymmetry in the SO emission with very weak emission in the southwestern half.
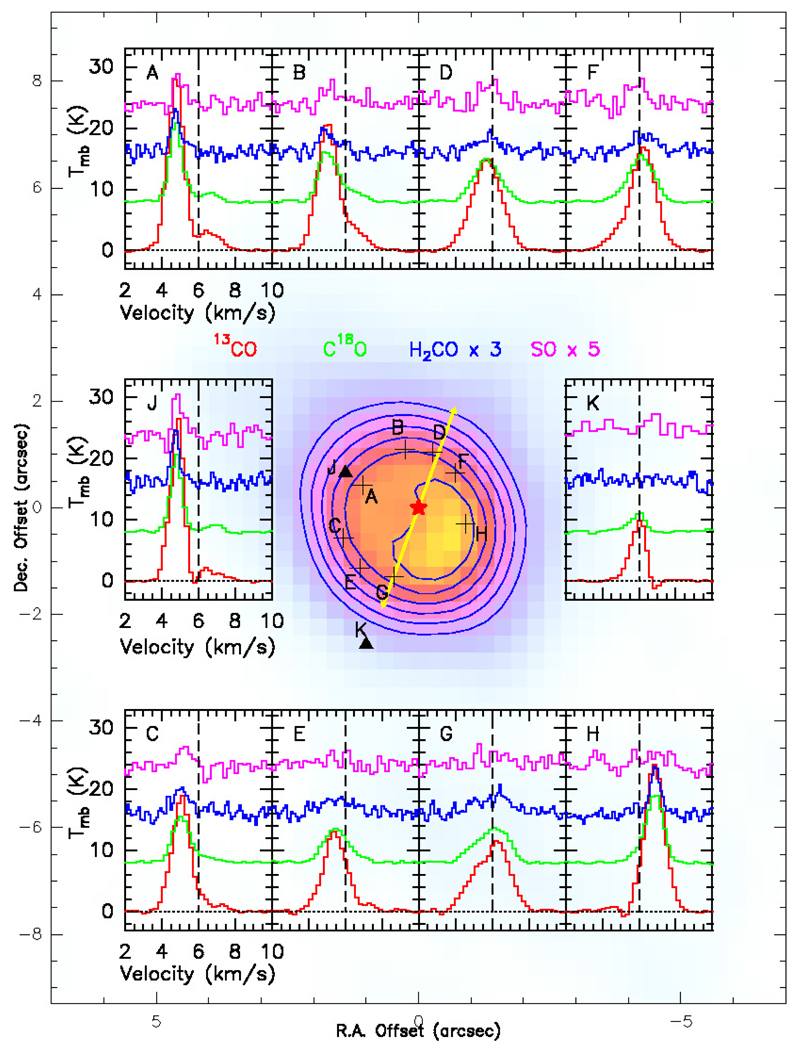
Figure 4 shows the 13CO J=2→1, C18O J=2→1, SO J=56→45, and H2CO J=30,3→20,2 spectra from ten points labeled from A to K, overplotted with the C18O J=2→1 integrated intensity map. We note that the SO emission is extremely weak (even undetected) toward the southwest.
Fig. 4.
Spectra of detected molecules over ten points around the AB Aur disk. In color gradient, the C18O J=2→1 integrated intensity map from Fig. 1. Contour levels are from 40% to 90% in steps of 10% the maximum (15 K × km s−1). The position of the central source is marked by a red star. The arrow indicates the direction of the ionized jet (Rodríguez et al. 2014). The ten boxes labeled from A to K show the spectra of the 13CO J=2→1, C18O J=2→1, SO J=56→45, and H2CO J=30,3→20,2 lines toward selected positions. We note that the SO emission is extremely weak (even undetected) toward the southwest.
3.2. Model fits in the UV plane
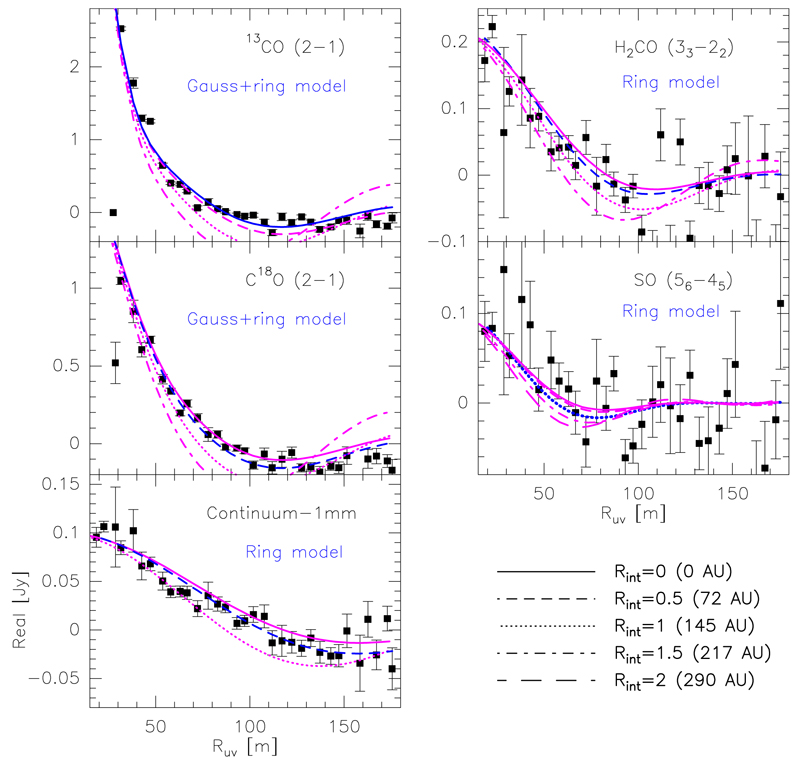
We have attempted to model the continuum and line emissions in order to have a more accurate estimate of the dust and gas spatial distributions. Fig. 3 shows the real part of the visibilities as a function of the radius in the uv plane. In the case of 13CO and C18O, the curve does not cut the y-axis, which indicates the existence of an extended component whose flux is not fully recovered by our observations. Fig. A.2 shows the imaginary part of the visibilities as a function of the radius. Values of the imaginary part different from zero indicate an azimuthal asymmetry (Pinilla et al. 2015). The azimuthal asymmetry is clear in 13CO, C18O, and the continuum emissions. In the case of 13CO, the asymmetry is located at very short uv distances (i.e., large radii) and is more likely related to the extended emission component. The plots of H2CO and SO suggest more symmetric distributions. We used a ring model to fit the continuum, H2CO, and SO data and we used a ring + circular Gaussian model to fit 13CO and C18O. The best fits to these data are shown in Table 2 and the residual images in Fig. A.3. For 13CO and C18O, we have significant residuals towards the east, because there is extended emission coming from a flattened envelope. The continuum, H2CO, and SO data are well fitted with a ring model. As expected, there is some weak continuum and C18O residual emissions towards the dust trap. Our fits prove that the emission of the continuum is more compact than that of the molecular lines. Moreover, the SO emission has larger inner and outer radii than the other molecules, suggesting that it is coming from an outer part of the disk. The width of the ring, ~200 AU, is significantly larger than those detected in the case of the younger objects L1527 and HH212 (Sakai et al. 2014; Podio et al. 2015).
Fig. 3.
Real part of the observed visibilities as functions of uv distance of the dust emission and the 13CO J=2→1, C18O J=2→1, SO J=56→45, H2CO J=303 →202 lines. Blue lines represent the best fit models given in Table 2. Magenta lines represent the same models, but varying the inner radius from 0 to 2 arcsec in steps of 0.5.
Table 2.
Fit model parameters. These values were directly obtained by fitting the visibilities.
| 13CO, rms= 1.65 Jy | |||
|---|---|---|---|
| Ring | R.A. | 0.0 | fixed |
| Dec. | 0.0 | fixed | |
| + | Flux | 1.5 | ± 0.05 |
| Rin (AU) | 0.0 | ± 72 | |
| Rout (AU) | 286 | ± 3 | |
| Gaussian | R.A. | -0.4 | ± 0.01 |
| Dec. | -0.2 | ± 0.02 | |
| Flux | 7.3 | ± 0.15 | |
| H.W.H.P. | 460 | ± 6 | |
| C18O, rms= 1.37 Jy | |||
| Ring | R.A. | 0.0 | fixed |
| Dec. | 0.0 | fixed | |
| + | Flux | 0.8 | ± 0.07 |
| Rin (AU) | 72 | ± 72 | |
| Rout (AU) | 283 | ± 4 | |
| Gaussian | R.A. | -0.05 | ± 0.04 |
| Dec. | -0.29 | ± 0.07 | |
| Flux | 1.25 | ± 0.06 | |
| H.W.H.P. | 310 | ± 15 | |
| Continuum 1mm, rms= 0.41 Jy | |||
| Ring | R.A. | 0.01 | ± 0.03 |
| Dec. | -0.30 | ± 0.04 | |
| Flux | 0.1 | ± 0.004 | |
| Rin (AU) | 72 | ± 36 | |
| Rout (AU) | 209 | ± 6 | |
| H2CO, rms=1.25 Jy | |||
| Ring | R.A. | 0.3 | ± 0.08 |
| Dec. | -0.4 | ± 0.10 | |
| Flux | 0.22 | ± 0.01 | |
| Rin (AU) | 72 | ± 72 | |
| Rout (AU) | 302 | ± 11 | |
| SO, rms= 1.34 Jy | |||
| Ring | R.A. | 0.5 | ± 0.2 |
| Dec. | -0.3 | ± 0.2 | |
| Flux | 0.10 | ± 0.01 | |
| Rin (AU) | 145 | ± 72 | |
| Rout (AU) | 384 | ± 38 | |
4. Abundance calculations
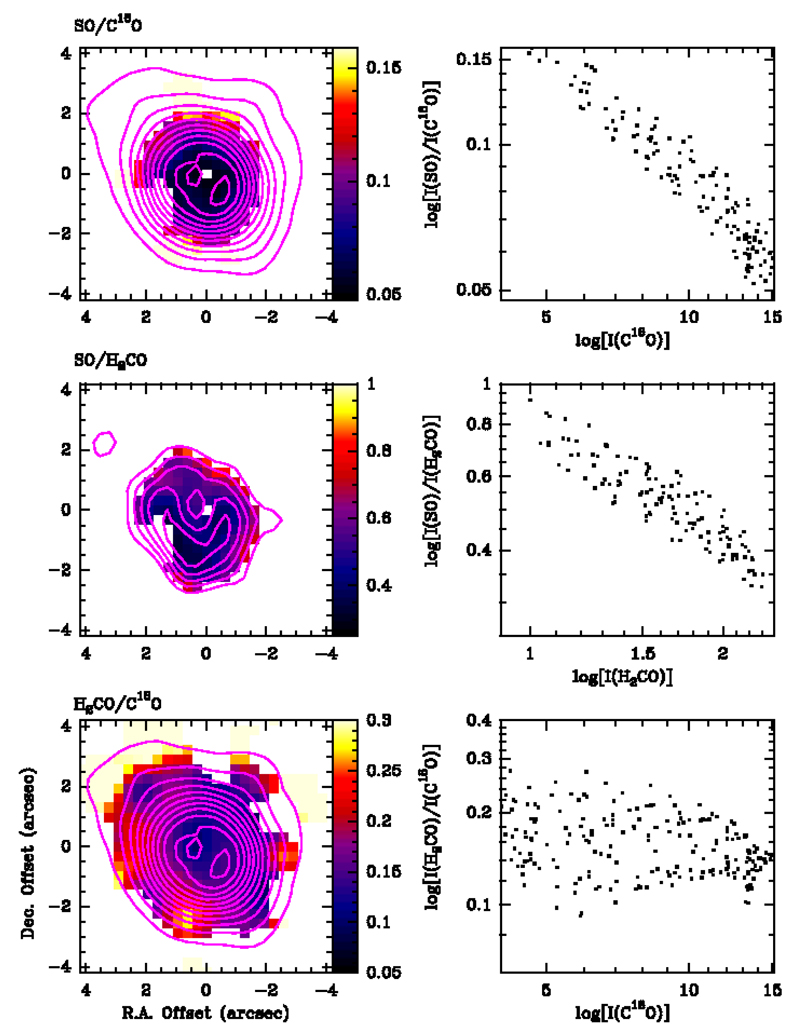
To investigate the chemical structure of the AB Aur disk, we produced maps of the line integrated intensity ratios of the observed SO, H2CO, and C18O lines (see Fig. 5). In the case of optically thin emission and uniform physical conditions along the disk, these maps would be proxy of the relative abundances. The I(SO J=56→45)/I(C18O J=2→1) and I(SO J=56→45)/I(H2CO J=30,3→20,2) line integrated intensity ratios present a clear northeast-southwest gradient (a factor of 3–6) with the minimum in the dust trap as defined by the continuum peak at 1mm. The I(H2CO J=303 →202)/I(C18O J=2→1) ratio is fairly constant, with values from ~ 0.15 in the western part to ~ 0.2 in the eastern part of the disk, but towards the south this ratio increases to values > 0.3, which are a factor of 2 higher than the averaged value in the disk. This position is coincident with the jet direction, which means that the enhancement of the H2CO abundance might be related to the jet-disk interaction.
Fig. 5.
Line integrated intensity ratios. The color maps correspond to I(SO J=56→45)/I(C18 O J=2→1), I(SO J=56→45)/I(H2CO J=30,3→20,2), and I(H2CO J=303 →202)/I(C18O J=2→1) in temperature units. While the I(H2CO)/I(C18O) ratio is fairly constant in the disk, the I(SO)/I(C18O) and I(SO)/I(H2CO) present a clear NE-SW gradient with its minimum value toward the dust trap. Although there is a large dispersion, there appears to be an anticorrelation with C18O intensity, which is a measure of column density, which in turn is thought to correlate (assuming a disk-like or ring morphology) with the local density.
One possibility to explain the weak SO emission towards the dust trap would be that the envelope or larger scale emission are optically thick and mask the emission at certain velocities and thus, at certain positions in the disk. We detect the weak SO emission towards the dust trap. The emission from the dust trap is at ~ 7 km s−1 (see Fig. 2), i.e., about 1 km s−1 shifted from the central velocity of the molecular cloud (Fuente et al. 2010). The emission from the cloud is narrow, ∆v = 0.5 km s−1, and centered at v = 5.9 km s−1, making it impossible to mask the emission from the dust trap.
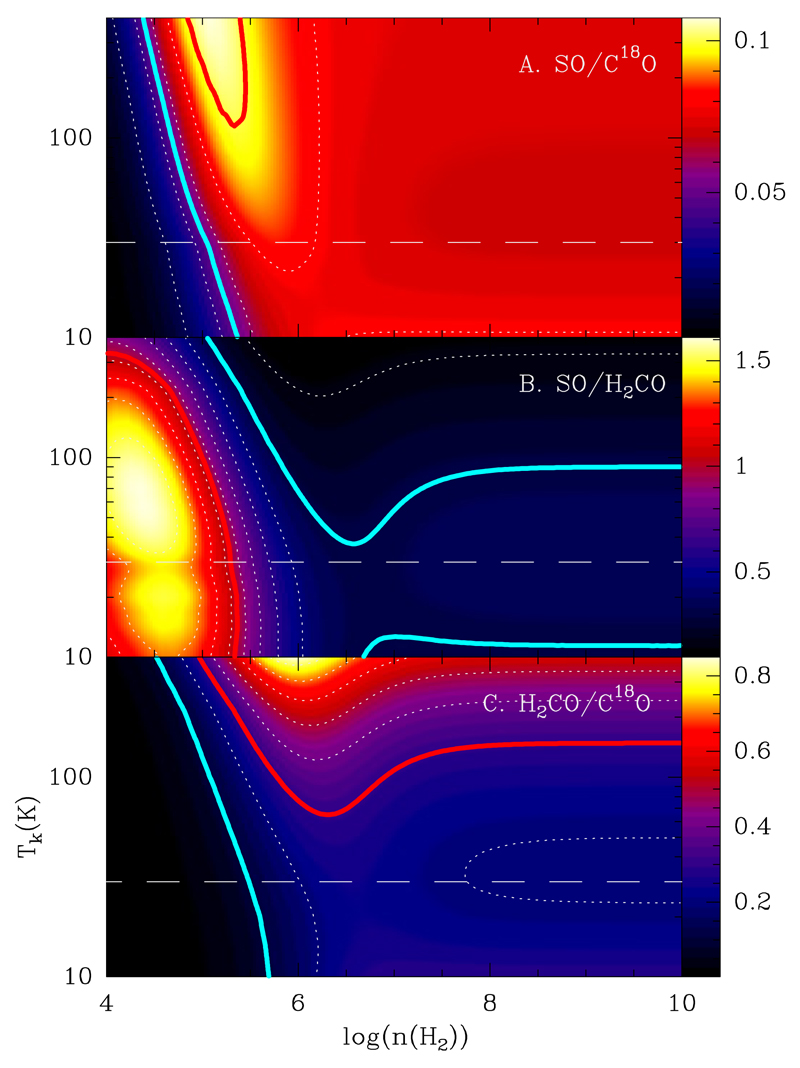
LVG (Large Velocity Gradient) calculations have been carried out to determine whether the gradients observed in the I(SO J=56→45)/I(C18O J=2→1) and I(SO J=56→45)/I(H2CO ratios are due to the different physical conditions (higher densities and slightly lower temperatures in the dust trap) or to variations in the chemical composition of the gaseous disk. Fig. 6 shows the results of our LVG calculations for a grid of reasonable physical conditions in the disk. The molecular column densities have been fixed to N(SO)=2×1013 cm−2N(H2CO)=1×1013 cm−2, and N(C18O)= 2×1016 cm−2. The velocity dispersion is assumed to be 1.5 km s−1 and the gas kinetic temperature and molecular hydrogen density vary within the range of values, Tk = 20 – 510 K and n(H2)= 104 – 1010 cm−3.
Fig. 6.
LVG calculations. We assumed N(SO)=2×1013 cm−2, N(H2CO)=1×1013 cm−2, and N(C18O)= 2×1016 cm−2. From top to bottom, we plot the I(SO J=56→45)/I(C18O J=2→1), I(SO J=56→45)/I(H2CO J=30,3→20,2), and I(H2CO J=303 →202)/I(C18O J=2→1) line intensity ratios. The long-dashed line corresponds to a gas kinetic temperature of Tk=30 K, which is the midplane temperature derived by Piétu et al. (2005) and Pacheco-Vázquez et al. (2015). Solid lines indicate the values derived from our maps (Fig. 5). The red and blue lines trace the maximum and minimum observed ratios, respectively.
In Fig. 6, we plot the calculated I(SO J=56→45)/I(C18O J=2→1), I(SO J=56→45)/I(H2CO J=30,3→20,2), and I(H2CO J=303 →202)/I(C18O J=2→1) ratios as a function of gas kinetic temperature and molecular hydrogen density. The long-dashed line corresponds to a gas kinetic temperature of Tk=30 K, which is the midplane temperature as derived by Piétu et al. (2005) and Pacheco-Vázquez et al. (2015). Solid lines indicate the values derived from our maps (Fig. 5). The gas kinetic temperature does not have a major effect in the calculated line intensity ratios unless we go to unrealistic values of Tk > 100 K. The observed species are easily photodissociated and their emissions are not expected to come from the highly irradiated surface but from colder regions in between the surface and the midplane.
The values of I(SO J=56→45)/I(C18O J=2→1), I(SO J=56→45)/I(H2CO J=30,3→20,2), and I(H2CO J=303 →202)/I(C18O J=2→1) observed in the eastern half can be explained with a density of a few ×106 cm−3 (red lines in Fig. 6), which is consistent with most of the molecular emission coming from an intermediated layer between the midplane and the disk surface. We encounter difficulties, however, when fitting the values observed towards the dust trap (blue lines in Fig. 6). Assuming the same N(SO)/N(C18O) and N(CO)/N(H2CO) ratios as for the eastern half, the low values of I(SO J=56→45)/I(C18O J=2→1) towards the dust trap would require a hydrogen density lower than 105 cm−3. However, the I(SO J=56→45)/I(H2CO J=30,3→20,2) would need gas kinetic temperatures > 200 K and a density of ~ 106 cm−3. The only way to explain the observations is to decrease the SO abundance with respect to C18O. This would imply that the SO abundance is changing in the protoplanetary disk with a minimum in the dust trap. This decrease in the SO abundance can be considered the chemical footprint of the local pressure maximum.
In Table 3 we show the molecular column densities and fractional abundances estimated for the positions shown in Fig. 4. In these calculations, we assume Tk= 30 K and n(H2)= 1×106 cm−3. The SO abundances were derived from the obtained N(SO)/N(C18O) ratios assuming a canonical C18O abundance of X(C18O)=1.7×10⁻⁷. Values of the SO abundance close to 2×10⁻¹⁰ are found in the eastern part, and 2-3 times lower toward the dust trap. This abundance is > 4 orders of magnitude smaller than those measured in bipolar outflows (Bachiller & Pérez Gutiérrez 1997) and about 3 orders of magnitude lower than those in young disks (Sakai et al. 2014; Podio et al. 2015). This suggests that an important evolution occurs in the chemistry of the gas between accretion disk phase and the formation of a planetary system, and SO is tracing non-shocked gas within the protoplanetary disk around AB Aur.
Table 3.
LVG estimation for column densities and abundances. We adopted a molecular hydrogen density of n(H2)= 1×106 cm−3 and Tk= 30 K. Fractional abundances are calculated assuming X(C18O)=1.7×10⁻⁷. The velocity dispersion is assumed to be 1.5 km s−1. Notation: 1(15) means 1×10¹⁵.
| Positions | NC18O cm−2 | Np−H2CO cm−2 | NSO cm−2 | |||
|---|---|---|---|---|---|---|
| A | 9.5(15) | 4.0(12) | 1.0(13) | 1.7(-10) | 2.9(-10) | 0.6 |
| B | 1.0(16) | 4.0(12) | 7.0(12) | 1.1(-10) | 2.7(-10) | 0.4 |
| C | 7.0(15) | 5.5(12) | 6.0(12) | 1.4(-10) | 5.4(-10) | 0.3 |
| D | 1.1(16) | 4.0(12) | 1.0(13) | 1.5(-10) | 2.5(-10) | 0.6 |
| E | 7.5(15) | 5.0(12) | < 6.0(12) | < 1.4(-10) | 4.5(-10) | < 0.3 |
| F | 1.1(16) | 4.5(12) | 1.0(13) | 1.5(-10) | 2.8(-10) | 0.5 |
| G | 1.1(16) | 7.0(12) | < 9.0(12) | < 1.4(-10) | 4.3(-10) | < 0.3 |
| H | 1.2(16) | 4.7(12) | < 5.0(12) | < 7.1(-11) | 2.7(-10) | < 0.3 |
| J | 8.0(15) | 4.4(12) | 1.0(13) | 2.1(-10) | 3.7(-10) | 0.6 |
| K | 2.2(15) | < 4.0(12) | < 5.0(12) | < 3.9(-10) | < 1.2(-09) | - |
Following the same procedure, we derive H2CO fractional abundances of a few 10−10 in this protoplanetary disk. This abundance is a factor of 20 lower than that derived toward the IRS 48 transitional disk on the basis of high spatial resolution (25 - 38 AU) observations (van der Marel et al. 2014). However, it is similar to the averaged H2CO abundances found in other protoplanetary disks (Fuente et al. 2010). In fact, IRS 48 is the only protoplanetary disk with such a high H2CO abundance thus far. Further observations are required to determine whether IRS 48 has a peculiar chemistry compared with other transitional disks.
In this section, we assume that C18O, H2CO, and SO are coeval and that their emissions come from a uniform layer with constant temperature and density. One would expect, however, the existence of structure at scales <200 AU. For instance, we cannot discard the possibility that the emission of SO and/or H2CO is concentrated in several unresolved rings, each one with a different abundance relative to C18O. However, the results of our fittings (see Table 2) do not support this interpretation. We also note also that the abundances of these compounds are expected to vary by several orders of magnitude in the vertical scale, from the midplane to the disk surface (Pacheco-Vázquez et al. 2015). Higher spatial resolution observations and a multitransitional study are necessary to further constrain the H2CO and SO spatial distributions and have a deeper insight into their chemistry.
5. Chemical model
The time-dependent chemical model described by Pacheco-Vázquez et al. (2015) was used to investigate the molecular chemistry in the dust trap. This model is an updated version of that reported by Agúndez et al. (2008) and Fuente et al. (2010) and includes the elements H, C, N, O, and S. The model considers adsorption onto dust grains and desorption processes, such as thermal evaporation, photodesorption, and desorption induced by cosmic rays, but surface reactions are not included. Desorption energies are adopted from the compilations by Hasegawa & Herbst (1993) and Willacy & Woods (2009). All the grains are assumed to be of the same size.
The initial molecular composition corresponds to that of a dark cloud (nH =2×104 cm−3, Tk =10 K) at a time of 0.1 Myr assuming the so-called low metal values (model M1 in Pacheco-Vázquez et al. 2015). The initial ionization fraction is 7×10⁻⁸, which is typical of dark cores (Caselli et al. 1998; Agúndez & Wakelam 2013). We assume that the molecules are located close to the midplane and well shielded from the stellar UV radiation (Av>10 mag). The gas and dust temperature is fixed to 45 K, which is slightly higher than that derived from Piétu et al. (2005) from interferometric observations and assumed for the abundance calculations here. We note, however, that the value of the temperature is not relevant for our results as long as T~ <50 K, the SO evaporation temperature; a lower temperature would produce a larger SO depletion. We vary the grain size, gas-to-dust mass ratio, and the molecular hydrogen density in order to investigate the possible effect of the dust trap on the gas chemistry.
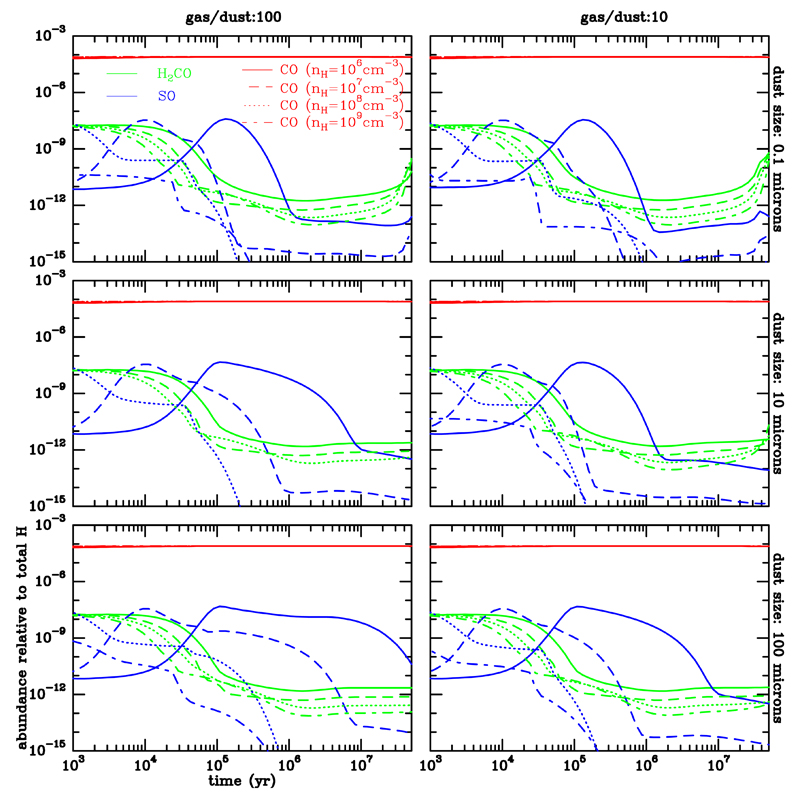
Figure 7 shows the CO, H2CO, and SO abundances as a function of time for different molecular hydrogen densities, gas-to-dust mass ratios, and grain sizes. The gas-to-dust mass ratio has a minor effect on the chemistry of these compounds. The grain size has some impact on the SO abundance. For large grains, the SO remains in gas phase until later times because of the decrease in the total grain surface. In particular, the molecular hydrogen density is the parameter that determines the chemistry of this species.
Fig. 7.
Chemical model abundance results. Predicted CO, H2CO, and SO fractional abundances as a function of time for different molecular hydrogen densities, gas-to dust mass ratios, and grain sizes.
The SO abundance presents variations of more than 3 orders of magnitude between 0.1 and a few Myr depending on the molecular hydrogen density. For high densities (>107 cm−3), the SO abundance decreases to values <10−12 in less than 0.1 Myr, the typical age of the dust trap. This is due to the adsorption of SO on dust grains and the rapid conversion of SO into SO2 via the reaction SO+O→SO2+hv. The desorption energy of SO2 is higher (3070 K) than that of SO (desorption energy= 2000 K) and once formed, is rapidly frozen onto the grain mantles. Below the SO evaporation temperature, the depletion of SO and SO2 is proportional to the gas density. These predictions could explain the low average density obtained from our LVG calculations (<107 cm−3) and the uniform SO emission all over the disk.
In the case of H2CO, the desorption energy is lower, 1760 K, and adsorption is less important than for SO, although its abundance decreases at later times because of the decrease of the atomic carbon in gas phase that becomes locked in CO. The decrease of the H2CO abundance is mainly a consequence of the gas phase chemistry and contrary to SO, initial conditions have a large impact on the resulting H2CO abundance (see discussion by Pacheco-Vázquez et al. 2015.)
The CO abundance is practically constant over time and is equal to the assumed initial C elemental abundance. On the basis of these calculations, the differentiated CO, H2CO, and SO spatial distributions mainly trace the gas density structure within the disk. The SO abundance is very sensitive to the gas density and might be a good tracer of the disk evolution.
We have to note, however, that there are large uncertainties inherent in the modeling of the sulfur chemistry. First of all, the binding energies of SO and H2CO depend on the chemical nature of the substrate. Garrod & Herbst (2006) consider a water ice substrate and give higher desorption energies, by 15% and 30% for SO and H2CO, respectively, than the values computed by Hasegawa & Herbst (1993). Adopting these higher values we obtain the same qualitative behavior for the SO abundance, which decreases with increasing density, while the H2CO abundance does not vary significantly. The decrease in the abundance of SO is related to the rapid conversion into SO2 via the radiative association with atomic oxygen and the further depletion of SO2 onto dust grains. More important are the uncertainties in the rate constant of the SO + O reaction and in the amount of atomic oxygen in the gas phase. The rate coefficient adopted for the reaction of SO and O, 3.2 × 10⁻¹⁶(T/300)−1.5 cm3 s−1, is based on a theoretical calculation by Millar & Herbst (1990), although it has a large uncertainty as do most radiative associations. Initial conditions also play a role in our results since the amount of atomic oxygen present in the gas phase depends on the assumed elemental C/O abundance ratio, among other physical and chemical parameters.
6. Summary and conclusions
We present the high spatial resolution images of the 13CO J=2 →1, C18O J=2 →1, SO J=56 →45, and H2CO J=303 →202 lines toward the transitional disk around AB Aur. Our results and conclusions can be summarized as follows.
The integrated intensity images of CO and H2CO lines and the dust 1 mm continuum emission toward AB Aur disk trace a lopsided horseshoe-shaped distribution. Sulfur monoxide presents an odd spatial distribution with lack of emission toward the dust trap.
The I(SO)/I(C18O) and I(SO)/I(H2CO) ratios present a clear NE-SW gradient with its minimum value toward the dust trap. Although with a large dispersion, there is an anticorrelation of the I(SO)/I(C18O) and I(SO)/I(H2CO) ratios with the gas density. Our calculations show that the I(SO)/I(H2CO) and the I(SO)/I(C18O) ratios cannot be explained by spatial variations in the physical conditions, but by the decrease of the SO abundances toward the dust trap.
The time-dependent model described by Pacheco-Vázquez et al. (2015) was used to follow the chemical evolution of the gas in the dust trap. Assuming the chemical composition of a dark cloud as the initial conditions, under high density conditions (n(H2)>107 cm−3), the SO abundance would be drastically reduced in less than 0.1 Myr. However, the CO abundance would remain constant as long as the gas temperature is >25 K.
The physical conditions in the AB Aur disk are far from being uniform, with strong temperature and density gradients in the vertical scale due to the heating of the disk surface by the UV radiation from the star. The physical conditions also vary in azimuth, with the gas pressure maximum located in the southwestern part of the disk. Because of the strong dependence of SO abundance on the gas density, we propose that the SO emission does not arise from the midplane but from an intermediate layer between the midplane and disk surface with a moderate density of a few 106 cm−3. For this reason, its emission seems to avoid the high pressure vortex associated with the dust trap, which is clearly detected in the dust continuum emission and C18O.
AB Aur is a good example of the tight interplay of the gas dynamics, grain growth and gas chemistry in the planet formation process. Because of its characteristics, the sulfur chemistry is potentially an excellent tool to understanding the planet formation process and detecting the birthsites of future planets. The large uncertainties inherent to chemical models and the scarcity of molecules detected in disks are still important drawbacks.
Future ALMA and NOEMA observations could allow a full test of the chemistry of simple and more complex molecules in transitional disks such as those around AB Aur.
Appendix
Acknowledgements
We thank the Spanish MINECO for funding support from grants CSD2009-00038, FIS2012-32096 and AYA2012-32032, and ERC under ERC-2013-SyG, G. A. 610256 NANOCOSMOS. S. P-V acknowledge the financial support of CONACyT, Mexico. We thank the referee for the fruitful comments.
Footnotes
Based on observations carried out under project number S14AO with the IRAM NOEMA Interferometer. IRAM is supported by INSU/CNRS (France), MPG (Germany) and IGN (Spain)
References
- Agúndez M, Cernicharo J, Goicoechea JR. A&A. 2008;483:831. [Google Scholar]
- Agúndez M, Wakelam V. Chemical Reviews. 2013;113:8710. doi: 10.1021/cr4001176. [DOI] [PubMed] [Google Scholar]
- Bachiller R, Pérez Gutiérrez M. ApJ. 1997;487:L93. [Google Scholar]
- Bachiller R, Pérez Gutiérrez M, Kumar MSN, Tafalla M. A&A. 2001;372:899. [Google Scholar]
- Birnstiel T, Dullemond CP, Pinilla P. A&A. 2013;550:L8. [Google Scholar]
- Casassus S, van der Plas G, M SP, et al. Nature. 2013;493:191. doi: 10.1038/nature11769. [DOI] [PubMed] [Google Scholar]
- Caselli P, Walmsley CM, Terzieva R, Herbst E. ApJ. 1998;499:234. [Google Scholar]
- Chernin L, Masson C. ApJ. 1993;403:L21. [Google Scholar]
- Codella C, Bachiller R, Benedettini M, et al. MNRAS. 2005;361:244. [Google Scholar]
- Corder S, Eisner J, Sargent A. ApJ. 2005;622:L133. [Google Scholar]
- Espaillat C, Muzerolle J, Najita J, et al. Protostars and Planets VI. 2014:497. [Google Scholar]
- Fuente A, Cernicharo J, Agúndez M, et al. A&A. 2010;524:A19. [Google Scholar]
- Fuente A, Martin-Pintado J, Bachiller R, Rodriguez-Franco A, Palla F. A&A. 2002;387:977. [Google Scholar]
- Garrod RT, Herbst E. A&A. 2006;457:927. [Google Scholar]
- Hasegawa TI, Herbst E. MNRAS. 1993;263:589. [Google Scholar]
- Hernández J, Calvet N, Briceño C, Hartmann L, Berlind P. AJ. 2004;127:1682. [Google Scholar]
- Lin S-Y, Ohashi N, Lim J, et al. ApJ. 2006;645:1297. [Google Scholar]
- Millar TJ, Herbst E. A&A. 1990;231:466. [Google Scholar]
- Öberg KI, Qi C, Fogel JKJ, et al. ApJ. 2011;734:98. [Google Scholar]
- Pacheco-Vázquez S, Fuente A, Agúndez M, et al. A&A. 2015;578:A81. [Google Scholar]
- Piétu V, Guilloteau S, Dutrey A. A&A. 2005;443:945. [Google Scholar]
- Pinilla P, van der Marel N, Pérez LM, et al. ArXiv e-prints. 2015 [Google Scholar]
- Podio L, Codella C, Gueth F, et al. ArXiv e-prints. 2015 [Google Scholar]
- Rodríguez LF, Zapata LA, Dzib SA, et al. ArXiv e-prints. 2014 [Google Scholar]
- Sakai N, Oya Y, Sakai T, et al. ApJ. 2014;791:L38. [Google Scholar]
- Schreyer K, Guilloteau S, Semenov D, et al. A&A. 2008;491:821. [Google Scholar]
- Semenov D, Pavlyuchenkov Y, Schreyer K, et al. ApJ. 2005;621:853. [Google Scholar]
- Tafalla M, Santiago-García J, Hacar A, Bachiller R. A&A. 2010;522:A91. [Google Scholar]
- Tang Y-W, Guilloteau S, Piétu V, et al. A&A. 2012;547:A84. [Google Scholar]
- van den Ancker ME, de Winter D, Tjin A Djie HRE. A&A. 1998;330:145. [Google Scholar]
- van der Marel N, Pinilla P, Tobin J, et al. ApJ. 2015;810:L7. [Google Scholar]
- van der Marel N, van Dishoeck EF, Bruderer S, et al. Science. 2013;340:1199. doi: 10.1126/science.1236770. [DOI] [PubMed] [Google Scholar]
- van der Marel N, van Dishoeck EF, Bruderer S, van Kempen TA. A&A. 2014;563:A113. [Google Scholar]
- Wakelam V, Ceccarelli C, Castets A, et al. A&A. 2005;437:149. [Google Scholar]
- Willacy K, Woods PM. ApJ. 2009;703:479. [Google Scholar]
Associated Data
This section collects any data citations, data availability statements, or supplementary materials included in this article.


