Abstract
In this paper a novel single-pixel method for coherent imaging through an endoscopic fiber bundle is presented. The use of a single-pixel detector allows greater sensitivity over a wider range of wavelengths, which could have significant applications in endoscopic fluorescence microscopy. First, the principle of lensless focussing at the distal end of a coherent fiber bundle is simulated to examine the impact of pixelation at microscopic scales. Next, an experimental optical correlator system using spatial light modulators (SLMs) is presented. A simple contrast imaging method of characterizing and compensating phase aberrations introduced by fiber bundles is described. Experimental results are then presented showing that our phase compensation method enables characterization of the optical phase profile of individual fiberlets. After applying this correction, early results demonstrating the ability of the system to electronically adjust the focal plane at the distal end of the fiber bundle are presented. The structural similarity index (SSIM) between the simulated image and the experimental focus-adjusted image increases noticeably when the phase correction is applied and the retrieved image is visually recognizable. Strategies to improve image quality are discussed.
Index Terms: Endoscopes, Optical fiber applications, Holography, Medical diagnostic imaging
I. Introduction
Endoscopes are powerful tools for diagnosis of a range of diseases in the gastrointestinal and respiratory tracts, particular cancers. Of the 330,00 new cases of cancer diagnosed in the UK each year, over 29% are of the bowel or respiratory tract, areas that can be diagnosed and treated using endoscopes [1]. In the US alone, 18.6 million gastrointestinal endoscopies and over half a million bronchoscopies are conducted each year [2].
Though widely in use since the 1950s, endoscopes have traditionally been used to identify areas for biopsies so that potentially diseased tissue can be removed and screened ex vivo by a histopathologist observing the sample under a microscope. More recently endomicroscopy, a combination of endoscopy with microscopy, has emerged and may reduce the need for invasive biopsies by enabling direct observation of cellular behaviour inside the human body i.e. in vivo [3].
In the past few years there have been several important developments in endomicroscopy. The use of coherent light manipulation techniques has obviated the need for distal optics, enabling wider field-of-view as well as dynamic electronic focussing and beam scanning without the use of moving parts [4]. This has paved the way for compact endomicroscopes. Coherent techniques combined with increased computational power have enabled precise and adaptive modal control of multimode optical fibers to enable their use in imaging as ultrathin endomicroscopes [5], [6]. However, multimode fibers are limited in their imaging capability by the number of propagation modes and the ability to separate spatially overlapping modes at the proximal end [7]. Conventional coherent fiber bundles offer a simpler way to achieve high resolution endomicroscopy because the image information is stored as pixels. It is even possible to remove pixelation artefacts by utilising higher order propagation modes of the fiberlets in a coherent bundle [8]. Coherent fiber bundles have also found use in optical coherence tomography, where they have been shown to enable beam scanning without the use of distal optics [9]. Fluorescence imaging through fiber bundles by coherent manipulation of light has also been demonstrated, limited in resolution only by the pixelation of the bundle [10].
Many of these techniques make use of precisely controllable coherent devices such as lasers and spatial light modulators (SLMs). However, in order to coherently control light at the distal end of a fiber bundle, or any fiber for that matter, it is necessary to characterise the transmission matrix of the fiber. This involves measuring the complex matrix mapping an orthogonal set of spatial modes launched at the input facet of the fiber to an orthogonal set detected at the output facet. In the case of a coherent fiber bundle, if all the fibers are single mode at a given wavelength and there is negligible coupling between fiberlets, this measurement reduces to determining the random phase shift introduced by each fiberlet due to variation in optical path lengths. In reality, these fiberlets are not single mode, typically exhibiting at least 3 spatial modes and a small amount of coupling between adjacent fibrelets in the 700-900nm range [11].
These transmission matrices can be measured in a number of ways. In imaging applications, this is usually done by scanning a spot or displaying various orthogonal mode patterns at one end of the fiber and then using a charge-coupled device (CCD) with a reference beam to take interferometric measurements at the other end [6], [12]. However, in telecommunications transmission matrices of multimode fibers have been measured using single pixel detectors and spatial light modulators [13], [14]. Single-pixel methods have the advantage of being able to use low-cost sensors (single photodiodes) that work over a wide range of wavelengths. Furthermore, these detectors can be extremely sensitive, for example photomultiplier tubes. This latter benefit is particularly important in super-resolution fluorescence microscopy when often only single molecules are emitting light [15]. The major downside of single pixel imaging is that it can be slow, but compressed sensing techniques and high-speed photodiodes have enabled significant speed increases [16].
In this paper, an SLM-based single-pixel imaging technique is adapted to measure both the amplitude and phase profiles of light in individual fiberlets of a coherent fiber bundle and then demonstrate dynamic lenseless focus shifting. First, simulations are presented to examine the focus shifting potential of the coherent bundle at microscopic scales, taking into account the high degree of pixelation present. Next, an experimental system able to measure the phase and amplitude of light in each fiberlet using a single-pixel detector is presented. In order to compensate for the optical path difference between fiberlets, a reference image of the fiber is first taken in which both amplitude and phase are measured. An image of the desired sample is then taken and the phase information is corrected using the reference measurement. It is shown that this enables analysis of the phase profile of light in individual fiberlets. Using the focus shifting technique demonstrated in the simulations, it is shown that by applying a parabolic phase mask in the Fourier domain a sample placed at a distance from the distal fiber facet can be brought into focus. Finally, the focus-corrected image is compared with that simulated and found to be recognizable, both visually and usually a structural similarity metric. Strategies for further improving image quality are then discussed.
II. Simulations
The aim of the simulations presented here is to examine the effect that pixelation, inherently present in fiber bundles, has on the ability to coherently recreate wavefronts and hence correct for defocus at the microscope scale. This provides a useful reference against which the quality of experimental measurements can later be judged.
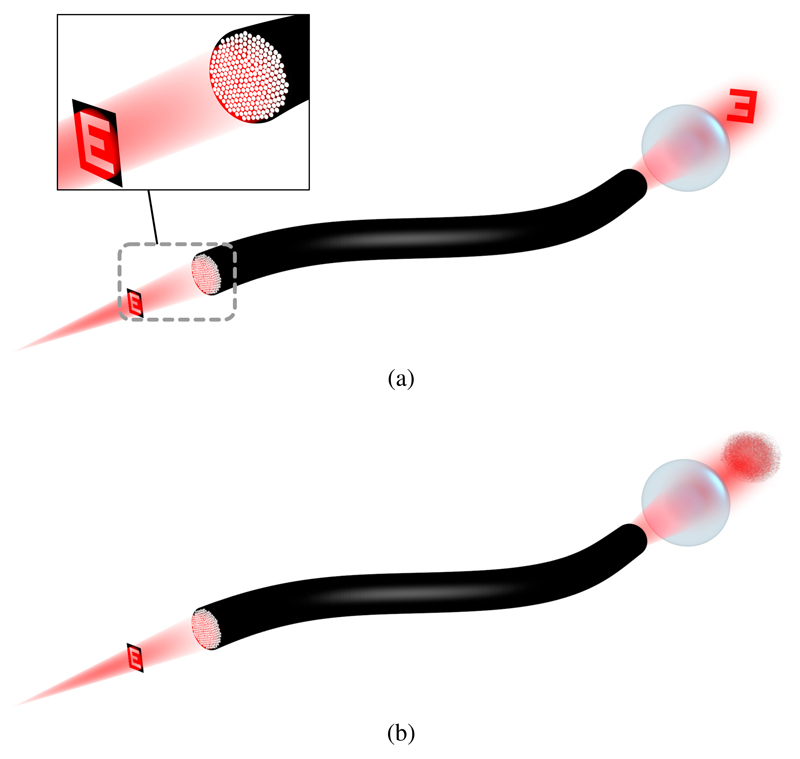
The principle of the ideal coherent fiber bundle is to sample the optical wavefront incident on the distal facet and reproduce this at the proximal facet, as illustrated in Figure 1a. In reality, due to the different optical path lengths of the fiberlets substantial phase noise is introduced, as shown in Figure 1b, making coherent transport of a wavefront impossible without first characterising the fiber. Because of this phase noise, in traditional endoscopy only the amplitude information of the wavefront is detected – an image of the object is formed on the distal fiber facet using a lens and a pixelated version of this appears at the proximal facet. However, the phase information of the wavefront is increasingly becoming of interest because it enables beam scanning, focus correction and other electronic lensing techniques. To achieve this, a technique for characterisation of the imaging fiber and hence correction of the wavefront is presented here and experimentally verified in Section III.
Fig. 1.
Use of an imaging fiber to transport a wavefront: (a) the ideal or corrected case, in which the phase shift between different fiberlets in the bundle has been compensated, (b) the uncorrected case where a speckle pattern is produced due to phase noise introduced by different optical path lengths.
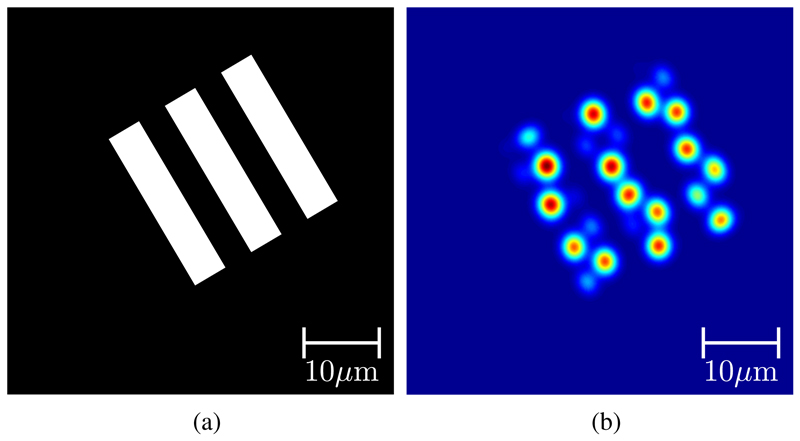
However, even when the correct phase profile of the sampled wavefront is obtained, the sampling itself will introduce some distortion, an example of which is shown in Figure 2. This distortion is in fact a type of pixelation or quantization artifact. In imaging fiber bundles, the distance between adjacent fiberlets is typically of the order of 4-6µm. As a result, when such fibers are used to image microscopic samples with sizes of the order of 10-100µm without the use of distal lenses, pixelation is often the limiting factor in retrieving the original image.
Fig. 2.
Effect of pixelation in a coherent fiber bundle: (a) original mask and (b) pixelated image of mask after transmission via fiber bundle.
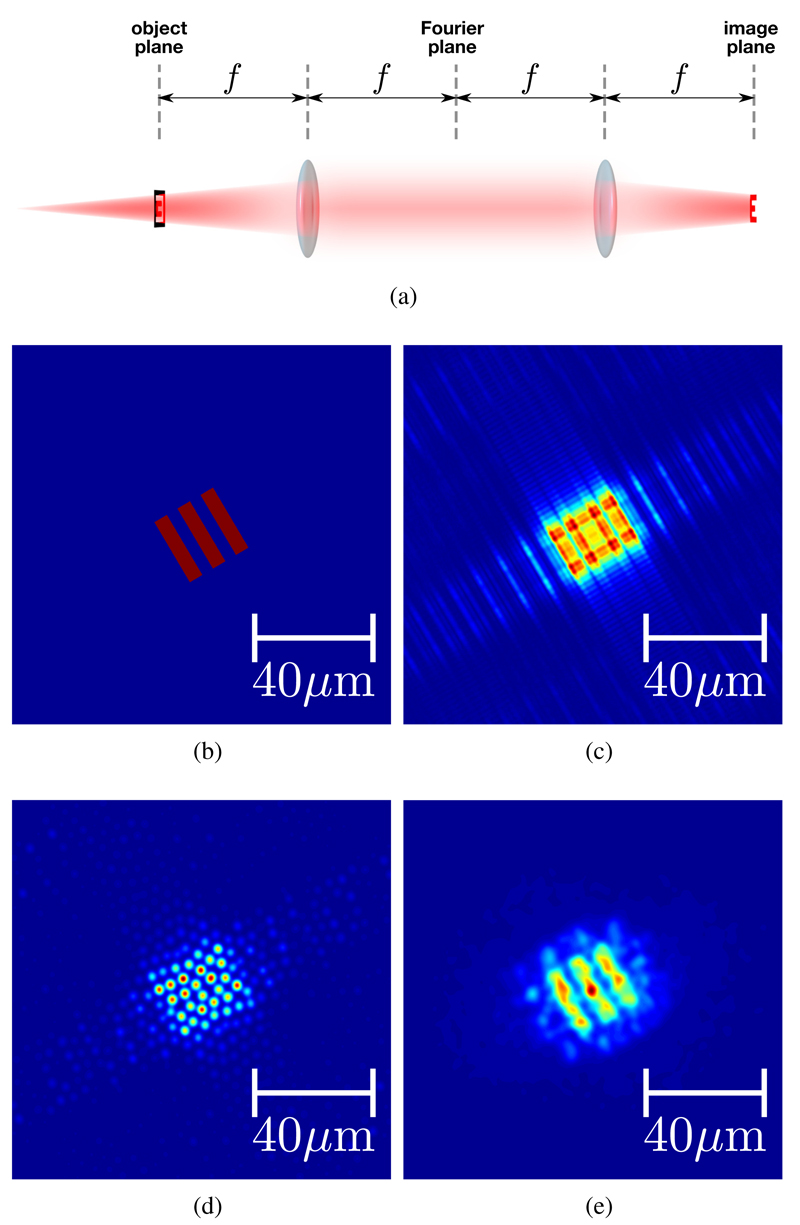
To examine the effect of sampling in coherent wavefront reconstruction, a defocussed image of the mask is first created, which is equivalent to moving the mask away from the fiber facet. This is achieved through a Fourier optical approach by simulating a 4f correlator, shown in Figure 3a. In a 4f correlator, when the object to be imaged is placed directly at the focal point of the input lens (the object plane), an exact image of the object will be produced at the focal point of the second lens (the image plane). If the object is placed slightly behind the object plane of the first lens, the image produced at the image plane of the second lens will be whatever optical field appears at the object plane of the first lens – in this case it will be the light from the object having propagated a small distance.
Fig. 3.
Simulating a defocussed image: (a) a model 4f correlator system used for Fourier optical analysis, where f is the focal length of the two lenses, (b) the ideal in-focus image created by the mask, (c) defocussed image created using a quadratic phase mask in the Fourier domain, (d) defocussed image sampled by fiberlets and (e) reconstructed focus-corrected estimate of original image using (d).
At the midpoint between the two identical lenses the Fourier transform of the object plane of the first lens is produced [17]. If the object is slightly offset from the object plane, the Fourier transform is still produced but is multiplied by a quadratic phase function:
| (1) |
where F(u, υ) is the 2-D Fourier transform of the in-focus object, f(x, y), k is the wavenumber of the light, f is the focal length of the lens and d is the distance between the object and the lens. Combining these two approaches the original image, shown in Figure 3b, is defocussed by taking the Fourier transform, multiplying that by a quadratic phase mask, then taking the inverse Fourier transform. The result is shown in Figure 3c.
Having obtained a defocussed image, this is then sampled using a fiberlet mask, as shown in Figure 3d. In this case, the fiberlet mask affects only the amplitude as it is assumed that phase shift introduced can be corrected by pre-characterization of the fiber.
To attempt to correct the defocus in the sampled image, the Fourier transform is taken, which is then multiplied by the conjugate of the quadratic phase mask used to generate the aberration. The corrected image is then found by taking the inverse Fourier transform of the result. In an ideal case with no pixelation this would produce the exact same image that was input. However, due to the fiberlet pixelation, the image is still somewhat distorted, though easily recognisable, as shown in Figure 3e. The distortion is particularly pronounced because of the fact that the spacing of pixels in the test pattern (4.5µm) is only marginally smaller than the spacing between lines (8.8µm) and so a high degree of pixelation results.
It is useful to introduce a quantitative measure to compare two images so that the effectiveness of any processing on a sample image, for example defocus correction, can be compared against a reference. The metric used for this here is the standard structural similarity index (SSIM) defined as:
| (2) |
where x and y are 8 × 8 pixel windows from the test and reference images respectively, and µx is the mean of x, µy is the mean of y, is the variance of x, is the variance of y, and σxy is the covariance of x and y. In this paper, the standard values of C1 = 10−4 and C2 = 9 × 10⁻⁴ are used [18]. A scalar metric, K, representing the similarity of the images can be defined by taking the mean over all windows:
| (3) |
where N is the number of windows used. By applying this metric to the simulated images of Figure 3, it is found that the structural similarity between the original mask, Figure 3b, and the reconstructed image, Figure 3e, is K = 0.970. This metric, K, is later used to measure the quality of correlation between experimentally measured images and the simulated image of Figure 3e. As an additional measure of the correlation between images, the normalized 2-D cross-correlation metric can be used:
| (4) |
where γ is the cross-correlation, f (x, y) is the sample image, g(x, y) is the reference image, is the mean of f (x, y) over the domain of g(x − u, y − v) and is the mean of g(x, y). Both measures are included in this work.
III. Experimental Set-Up
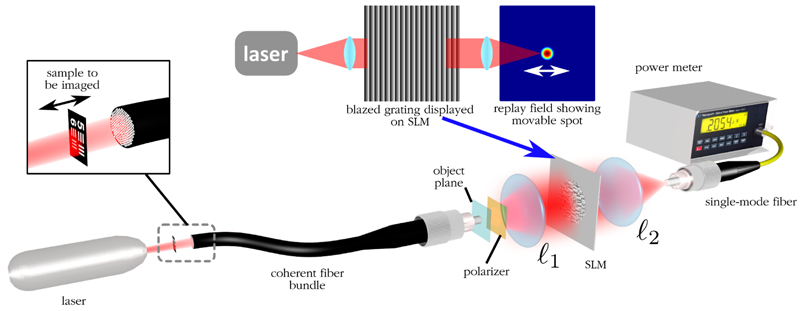
Next, the experimental setup shown in Figure 4 is used to test the ability of the system to correct for phase shifts introduced by the fiberlets and hence correct defocus for a real coherent bundle. The system is simply a 4f optical correlator with a liquid crystal on silicon (LCOS) spatial light modulator (SLM) placed between the two lenses. The SLM is used to direct light from a particular point on the imaging plane to the single pixel detector, in this case a single mode fiber (SMF). By displaying a blazed grating of variable pitch on the SLM, light from different points on the imaging plane can be directed to the output SMF, thus creating an image that is a 2D correlation between the object plane and the spatial mode profile of the SMF. At 850nm, standard SMF-28 with a core diameter of 8.2µm will be multimode, but will have an approximate maximum mode-field diameter of 4µm. Given that lens l1 has a focal length of 6.2mm and l2 has a focal length of 20.4mm, there is a scaling factor of 3.3. This would therefore mean that the measured image is a correlation between the object and an approximately Gaussian spot of ~ 1.2µm in diameter. Given the fiberlet diameter of ~ 2.6µm, this is sufficient to observe the optical fields of individual fiberlets.
Fig. 4.
Experimental single-pixel optical correlator set-up illustrating how a sample placed at the distal end of a fiber bundle is imaged using an SLM.
It should be noted that because the SLM is polarization sensitive only a single polarization is used for fiber characterisation and imaging, though dual polarization architectures using SLMs have been proposed [14]. This may result in a reduced ability to electronically shift the focus due to uncompensated polarization coupling in the fiber. In fact, the system here does not explicitly account for multimode propagation in the fiberlets, even though the fiberlets may support up to 3 spatial modes at 850nm [11]. However, even using this simple phase correction approach produces significant improvement in the ability to electronically adjust focus, as demonstrated in Section IV.
Using a similar technique to that presented in [14], two gratings are displayed simultaneously so that the optical fields from two points on the fiber facet are simultaneously incident on the detector. The absolute phase of one of the gratings in the superposition is then shifted through 16 levels from 0 to 2π and the resultant interferometric power is measured. A sinusoid is fitted to this data to give an estimate of the relative phase of the two points. In this way, the SLM is used as a common-path interferometer. By keeping one of the gratings fixed at the most powerful point on the object, the relative phase of each measured point on the fiber facet can be determined. It should be noted that although only 3 measurements are required to determine the phase interferometrically, the measurement is sensitive to noise in optical power, arising from laser instability and the relatively low powers used, and in the phase due to SLM phase noise or minor disturbances of the system such as vibrations. Taking 16 measurements and then performing a least-squares fit of a sinusoid significantly reduces the phase estimation error.
In an ideal case, only one such coherent image would be sufficient to adjust focus at the distal end the fiber bundle. However, due to slightly different optical path lengths of the fiberlets and non-flatness of the fiber facets after polishing, some degree of phase aberration will be introduced producing speckle-like images. The difference in path lengths is due to manufacturing variations and bending of the bundle, which is unavoidable in realistic use.
In order to compensate these phase aberrations, we adapt a technique commonly used in digital in-line holography to create a contrast image [19]. First, a reference measurement is taken by removing the sample from the set-up in Figure 4 with everything else remaining fixed. This produces a coherent image of the optical field of the illumination source in the object plane, plus the aberrations introduced by the fiber bundle. Then, the phase profile of this image is subtracted from the phase of the image measured with the sample in place. Because holographic focussing is used, measurements are taken from a single plane located on the proximal fiber facet. It is thus assumed that the resultant images will have the correct amplitude profile and that aberrations present in the bundle will only impact the optical phase in the object plane. This enables the application of phase-only aberration correction. Finally, using the method described in the previous section, a defocus correction is applied in the Fourier domain to the corrected coherent image in order to electronically adjust the focus.
It is observed from the simulations presented in Section II that due to pixelation in the bundle, images on a microscopic scale are likely to experience some distortion, even when aberrations in the bundle have been compensated. In order to quantify the quality of the focus adjustment, the metric K defined in Equation 3 is used to compare experimentally measured images with the simulated images. This enables a fair assessment of the focus adjustment relative to the best result that would be expected from an ideal simulated system.
IV. Results
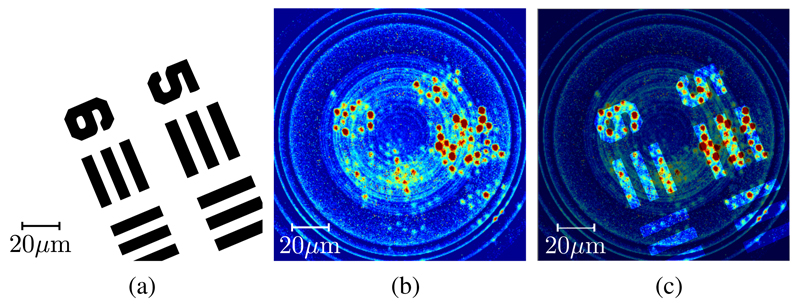
In order to verify the experimental system, a mask is first placed flush against the distal end of the coherent fiber bundle and an image is taken, shown in Figure 5. It can be seen that the system is able to resolve individual fiberlets clearly and the pixelated image of the input mask is observed.
Fig. 5.
Reference measurements to verify correct operation of single-pixel correlator: (a) original mask placed flush on distal fiber facet, (b) image recorded by system showing individual fiberlets and (c) recorded image with original mask overlaid, showing good confinement of light.
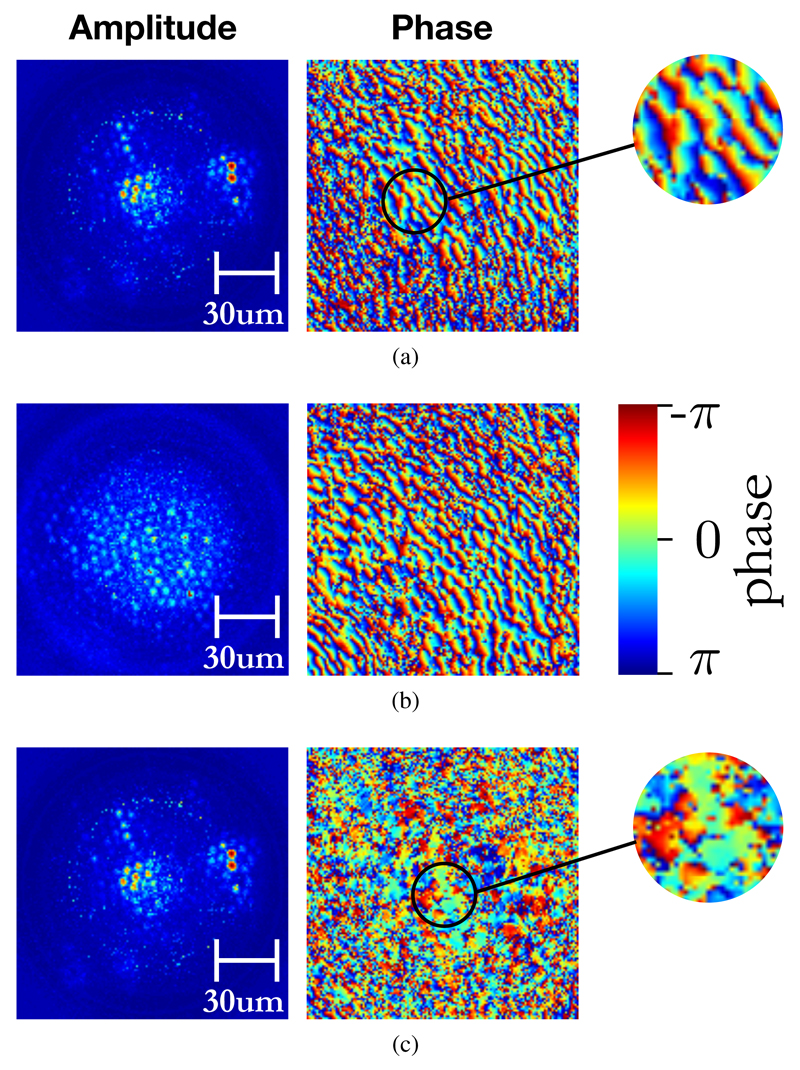
Next, the mask is moved 5mm away from the fiber facet and an image of both optical intensity and phase is taken using the experimental system described in the previous section. The mask is then removed, with everything else left in place, and a reference image is taken. The phase of the reference image is subtracted from the phase of the image of the defocussed sample. The results are shown in Figure 6. It is observed that due to the non-flatness of the fiber facets, a ripple-like pattern is observed in the phase measurement for both the sample and reference cases. However, when the measured reference phase image is used to correct the sample image phase as in Figure 6c, it is seen that this ripple pattern disappears and the phase profile becomes patches of approximately constant phase corresponding to individual fiberlets. In areas of low optical intensity, the phase measurement produces random speckle, which is expected.
Fig. 6.
Measurements of optical amplitude and phase at the proximal end of coherent fiber bundle: (a) with sample mask offset from the distal fiber facet, (b) reference measurement with sample mask removed and (c) sample measurement with phase corrected by subtracting reference measurement values.
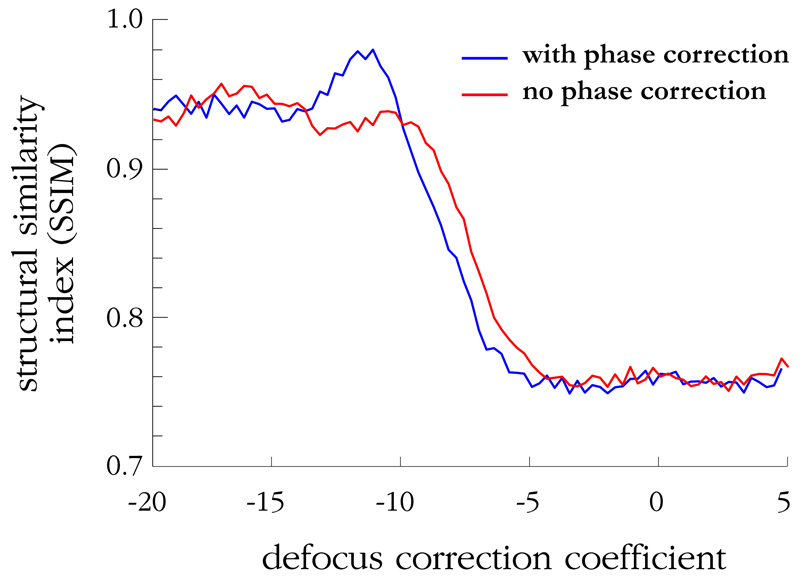
Next, the amplitude of each pixel in the sample image is weighted by a factor of the normalized pixel value from the reference image. This is done in order to compensate small variations in the power measured in each fiberlet due to imperfections and non-uniform coupling loss. The corrected sample image is then processed to adjust the focus. To do this, a quadratic phase mask of varying scale, i.e. different focal correction, is applied to the image in the Fourier domain. For each focus correction value, the mean SSIM metric, K, defined in Equation 3, between the corrected image and the simulated reconstructed image of Figure 3e is plotted, shown in Figure 7. The simulated reconstructed image is used as the benchmark for comparison in order to exclude the effects of image degradation due to sampling by the fibrelets. The numerical comparison thus better reflects the quality of fibrelet phase compensation. For comparison, the value of K without phase correction is also shown. It can be seen that the peak K occurs at a focus correction coefficient of −12.2, with K = 0.980. This is 5% greater than the correlation without phase-correction, K = 0.930. By comparison, the structural similarity observed between the simulated and the ideal images is K = 0.970, as discussed in the previous section.
Fig. 7.
Graph showing the mean structural similarity index, K, between the experimentally reconstructed image and the simulated reconstructed image of Figure 3e vs. defocus correction coefficient for the phase-corrected and uncorrected cases. A significant increase is observed for the phase-corrected case, indicating that the focus is being adjusted successfully to recreate the original image.
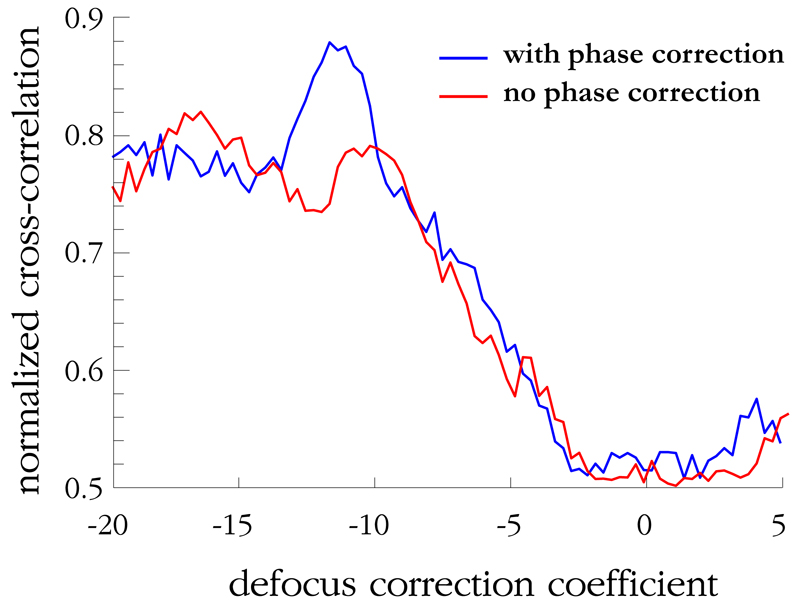
Similarly, the normalized 2-D cross correlation for different focus correction coefficients is shown in Figure 8. Again, a peak is observed at a focus correction coefficient of −12.2, with γ = 0.880 for the phase-corrected case, a 19% increase from the value without phase correction.
Fig. 8.
Graph showing the normalized cross-correlation, γ, between the experimentally reconstructed image and the simulated reconstructed image of Figure 3e vs. defocus correction coefficient for the phase-corrected and uncorrected cases
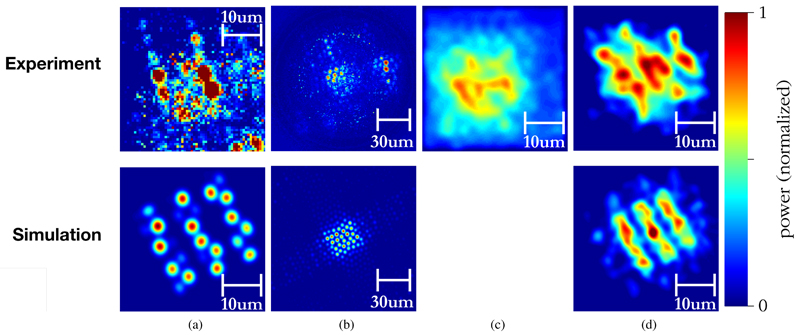
A focus correction coefficient of −12.2 is used to produce the processed images, shown in Figure 9. It is seen that after applying focus correction, the resultant image bears significant similarity to that predicted by simulations, seen in Figure 9d.
Fig. 9.
Processed images showing comparison between experimental results and simulations: (a) test images with mask flush on distal facet, (b) recorded optical amplitude from displaced (i.e. defocussed) mask, (c) focus-corrected image without phase correction and (d) final image after phase correction and electronic focus correction, showing the similarity between simulated and experimental results. Note that images are normalized such that the total amount of power in each is constant.
If the phase correction is not applied, however, the result looks substantially more amorphous, as per figure 9c. This provides visual confirmation that the system presented here is capable of compensating for optical phase aberrations introduced by fiberlets and the non-flatness of the coherent bundle facets. Using a single-pixel detector and an SLM, this system can thus perform electronic focussing at the distal end of a coherent fiber bundle without the use of distal lenses.
Though an improvement in image quality is visible following focus correction, this is an early result and there is significant room to improve image quality in future measurements. There are several reasons for the degradation of quality. It is first noted that even when the sample is placed flush on the fibre facet, the image quality is lower than that simulated due to defects in the fibre and small amounts of cross-talk between fibrelets, as evidenced in Figure 9a. Consequently, it is expected that there will be similar degradation of quality between the experimental and simulated focus-corrected images, which is what is observed in Figure 9d.
Another significant cause of quality degradation is that the fiberlets are large relative to the sample imaged, resulting in pixelation artefacts. This degradation is also visible in the simulated results. Better images could be obtained with a larger target, but the tests presented here do give an indication of the ultimate resolution. Another factor impacting quality is the limited field of view at the proximal end of the fiber. This is determined by the focal length of lens l1 of Figure 4. In selecting this lens, there is a trade-off between the maximum field of view, i.e. area of the proximal fiber facet that can be imaged, and the resolution. In this case, a 6mm focal length lens was used in order to maximise imaging resolution at the expense of field-of-view. However, the target used includes sharp changes in amplitude, which require high spatial frequencies to replicate accurately. These high spatial frequencies are attenuated in the Fourier domain by the limited field of view of this small lens. A bigger lens might provide better results for a fibre of the dimensions used here when imaging objects with sharp edges. Finally, the SLM used here is designed for operation at 1550nm, but is being run at 850nm. This may introduce additional errors due to losses, phase quantization and small errors in the phase calibration. This could be addressed in future work by using an SLM tailored to the correct wavelength.
V. Conclusion
A design for an SLM-based coherent fiber bundle endomicroscope using a single-pixel detector is presented. It is shown experimentally that the system is able to measure the phase of the wavefront emerging at the proximal end of a fiber bundle and is able to estimate and correct phase aberrations therein. Images of a defocussed sample are taken and when the focus is electronically corrected, the structural similarity of the phase-corrected image with the simulated result is 5% higher than for the non-phase-corrected image. Visually, the phase correction technique is shown to enable focus correction comparable to that predicted by simulation. This shows that the phase-correction technique is able to reduce the phase aberrations found in coherent fiber bundles and thus paves the way for lensless focussing at the distal end of the fiber. The use of a single-pixel detector allows improved sensitivity over a wide range of wavelengths, making this a promising technique for endoscopic fluorescence microscopy.
Acknowledgement
G. Gordon would like to acknowledge support from a Henslow Research Fellowship from the Cambridge Philosophical Society, as well as research funding from the Cambridge Cancer Centre and Cancer Research UK. S. Bohndiek would like to acknowledge research funding from a Cancer Research UK Career Establishment Award and the CRUK-EPSRC Cancer Imaging Centre in Cambridge and Manchester.
Contributor Information
George S.D. Gordon, Electrical Engineering Division, University of Cambridge, CB3 0FA, Cambridge, U.K. gsdg2@cam.ac.uk.
James Joseph, Department of Physics and Cancer Research UK Cambridge Institute, University of Cambridge and CRUK-EPSRC Cancer Imaging Centre in Cambridge and Manchester.
Sarah E. Bohndiek, Department of Physics and Cancer Research UK Cambridge Institute, University of Cambridge and CRUK-EPSRC Cancer Imaging Centre in Cambridge and Manchester
Timothy D. Wilkinson, Electrical Engineering Division, University of Cambridge, CB3 0FA, Cambridge, U.K..
References
- 1.Cancer Incidence in the UK in 2011. Cancer Research UK Tech Rep CS_REPORT_INCIDENCE. 2014 Jan; [Online]. Available: http://publications.cancerresearchuk.org/downloads/Product/CS_REPORT_INCIDENCE.pdf.
- 2.Peery AF, et al. Burden of gastrointestinal disease in the United States: 2012 update. Gastroenterology. 2012 Nov;143(5):1179–87. doi: 10.1053/j.gastro.2012.08.002. [DOI] [PMC free article] [PubMed] [Google Scholar]
- 3.Gmitro AF, Aziz D. Confocal microscopy through a fiber-optic imaging bundle. Optics Letters. 1993 Apr;18(8):565–567. doi: 10.1364/ol.18.000565. [DOI] [PubMed] [Google Scholar]
- 4.Thompson AJ, et al. Adaptive phase compensation for ultracompact laser scanning endomicroscopy. Optics letters. 2011 May;36(9):1707–9. doi: 10.1364/OL.36.001707. [DOI] [PubMed] [Google Scholar]
- 5.Čižmár T, Dholakia K. Exploiting multimode waveguides for pure fibre-based imaging. Nature communications. 2012 Jan;3(1027):1–9. doi: 10.1038/ncomms2024. [DOI] [PMC free article] [PubMed] [Google Scholar]
- 6.Plöschner M, et al. GPU accelerated toolbox for real-time beam-shaping in multimode fibres. Optics Express. 2014;22(3):10583–10590. doi: 10.1364/OE.22.002933. [DOI] [PubMed] [Google Scholar]
- 7.Mahalati RN, Gu RY, Kahn JM. Resolution limits for imaging through multi-mode fiber. Optics express. 2013 Jan;21(2):1656–68. doi: 10.1364/OE.21.001656. [DOI] [PubMed] [Google Scholar]
- 8.Choi Y, Yoon C, Kim M, Choi W, Choi W. Optical Imaging With the Use of a Scattering Lens. IEEE Journal of Selected Topics in Quantum Electronics. 2014 Mar;20(2):61–73. [Google Scholar]
- 9.Xie T, et al. Fiber-optic-bundle-based optical coherence tomography. Optics letters. 2005 Jul;30(14):1803–5. doi: 10.1364/ol.30.001803. [DOI] [PubMed] [Google Scholar]
- 10.Bozinovic N, et al. Fluorescence endomicroscopy with structured illumination. Optics express. 2008;16(11):4603–4610. doi: 10.1364/oe.16.008016. [DOI] [PubMed] [Google Scholar]
- 11.Han JH, Kang JU. Effect of multimodal coupling in imaging micro-endoscopic fiber bundle on optical coherence tomography. Applied physics B Lasers and optics. 2012 Jan;106(3):635–643. doi: 10.1007/s00340-011-4847-y. [DOI] [PMC free article] [PubMed] [Google Scholar]
- 12.Bianchi S, Di Leonardo R. A multi-mode fiber probe for holographic micromanipulation and microscopy. Lab on a chip. 2012 Mar;12(3):635–9. doi: 10.1039/c1lc20719a. [DOI] [PubMed] [Google Scholar]
- 13.Carpenter JA, Eggleton BJ, Schröder J. 110x110 optical mode transfer matrix inversion. Optics Express. 2014;22(1):96–101. doi: 10.1364/OE.22.000096. [DOI] [PubMed] [Google Scholar]
- 14.Gordon GSD, et al. Coherent, focus-corrected imaging of optical fiber facets using a single-pixel detector. Optics Letters. 2014;39(20):6034–6037. doi: 10.1364/OL.39.006034. [DOI] [PubMed] [Google Scholar]
- 15.Kaminski-Schierle GS, et al. In situ measurements of the formation and morphology of intracellular β-amyloid fibrils by super-resolution fluorescence imaging. Journal of the American Chemical Society. 2011 Aug;133(33):12902–5. doi: 10.1021/ja201651w. [DOI] [PubMed] [Google Scholar]
- 16.Duarte MF, Davenport MA, Takhar D, Laska JN, Sun T, Kelly KF, Baraniuk RG. Single-Pixel Imaging via Compressive Sampling. IEEE Signal Processing Magazine. 2008 Mar;25(2):83–91. [Google Scholar]
- 17.Goodman JW. Introduction To Fourier Optics. Englewood, CO: Roberts & Company; 1996. [Google Scholar]
- 18.Wang Z, Bovik AC, Sheikh HR, Simoncelli EP. Image Quality Assessment: From Error Visibility to Structural Similarity. IEEE Transactions on Image Processing. 2004 Apr;13(4):600–612. doi: 10.1109/tip.2003.819861. [DOI] [PubMed] [Google Scholar]
- 19.Garcia-Sucerquia J, et al. Digital in-line holographic microscopy. Applied Optics. 2006;45(5):836–850. doi: 10.1364/ao.45.000836. [DOI] [PubMed] [Google Scholar]


