

Abstract
Background
Given improvements in breast cancer screening technology and treatment over the past decade, we sought to evaluate the cost-effectiveness f breast cancer screening in Canada.
Data and Methods
Using the Canadian breast cancer incidence, mammography performance and cost data, we adopted the Wisconsin CISNET breast cancer simulation model to the Canadian population. We estimated the costs, life years gained (LYG), quality-adjusted life years (QALYs) for 11 mammography screening scenarios varying by age and frequency. The cost-effectiveness analysis was conducted from the Canadian societal perspective. Incremental cost effectiveness ratios were presented. Sensitivity analyses assessed the robustness of model conclusions.
Results
The overall societal cost associated with No Screening was $4.8 M ($4,875 per woman) and ranged between $7.6 to $16.0M for other active screening scenarios over a lifetime time horizon. Stepwise incremental cost-effectiveness analysis showed that triennial screening (50–69 years) was the most cost effective at $83,070 per LYG and $94,762 per QALY. Biennial ($87,420 per LYG and $97,006 per QALY) and annual ($184,654 per LYG and $226,278 per QALY) scenarios had higher incremental ratios.
Interpretations
Both the benefits (life years gained, QALY) and costs of screening rise almost linearly with the number of lifetime screens per women. The decision on how to screen in Canada is influenced by the willingness to pay and the rate of recalls for further examinations after positive screens.
Keywords: costs effectiveness analysis, screening, breast cancer, mammography, cost-effective
Introduction
With its single payer publicly funded health system, the implementation of a population-wide screening program in Canada has significant budget implications because of the utilization of substantial health system resources. Decisions regarding whether to screen, who to screen, what modalities should be used, and how frequently screening should occur are best made when there is an understanding of the trade-offs between improved health outcomes, potential harm, and financial costs of the intervention.
The economic value of mammography screening is of particular importance in countries with socialized health systems or single payer systems. Mammography screening recommendations, in particular, are continually being updated and modified over different countries and over time1–3. The age range, frequency, effectiveness and cost-effectiveness for population mammography screening programs continue to be hot topics of debate1–3.
While a number of studies have examined the costs for the treatment of breast cancer from the Canadian perspective, none to our knowledge have examined or incorporated the full cost of screening in Canada4–7. Moreover, a number of breast cancer natural history models to project the impact of different mammography screening scenarios have been developed8–13. However, none of the models have evaluated the value of mammography to society, which is an important issue in a country such as Canada, where screening for breast cancer has been offered through organized government funded screening programs. The objective of this work, therefore, was to evaluate the costs, outcomes and cost-effectiveness of mammography over different screening scenarios in women from the societal perspective, using a validated computer breast cancer natural history simulation model14.
Data and Methods
Model
We adapted the University of Wisconsin Breast Cancer Epidemiology Simulation (UWBCS) Model14 to the Canadian context. Developed under the US National Cancer Institute-funded Cancer Intervention and Surveillance Modeling Network (CISNET) program15, the model is a discrete-event simulation model originally designed and calibrated to predict US breast cancer incidence and mortality trends from 1975–2000 and then extended to match observed incidence and mortality until 2010. The details of the model logic and components have been described elsewhere and are available at www.cisnet.cancer.gov/breast/16.
In a companion paper, we describe the model assumptions and input data for the Canadian version and present model predictions related to health outcomes, while here, we describe inputs specific to resource use and analyze the cost-effectiveness of screening.17 We examined 11 screening scenario, consisting of annual, biennial, and triennial regimens across different age bands (starting at 40 or 50 and ending at 69 or 74years) for women plus a no screening scenario. The results presented here are based on calculations for a 1960 birth cohort.
Efficacy
Clinical model inputs are described in full in the original model11 and details of the Canadianized modified inputs are provided in the companion paper17
Resources
Resources associated with screening, diagnosis, and cancer management were identified based on the Canadian publicly funded health system environment and included mammography, clinic visits, physicians, diagnostic procedures, and treatment (surgery, radiation and medication). To account for the societal perspective, lost productivity related to screening, screening results, and diagnosis and the cost of premature death were included. Once identified, quantities of resources utilized during the management of women were determined through guidelines, reports, peer-reviewed literature, and expert opinion (Table 1). In the base-case, we assumed that 100% of eligible participants would be screened using digital mammography. We assumed that all positive screens and all detection of suspicious findings outside of screening incurred a non-invasive workup cost and a subset of these incurred invasive workup. It was assumed that all women took time off from their workplace related to mammography and in the first year after a diagnosis. Productivity loss associated with premature death due to breast cancer was also counted.
Table 1.
Resource Utilization and Cost Input Parameters
| Variables | Definitions and Descriptions | Resource Utilization (RU) | Costs (2012CAN$) |
|---|---|---|---|
| Screening and Diagnosis | |||
| Breast Cancer Screening program | Resource Utilization (RU): Assume all women eligible would be screened- Cost: Includes mammography physician based on the Ontario Health Insurance Plan (OHIP)29 |
100% of women eligible for screening | $183.00 per screen |
| Non-invasive Workup | RU: Assume all women with a positive mammogram Cost: Includes work-up mammography, radiology, physician clinic visit based on OHIP29 |
100% of women who have a positive screening exam | $445.95 per work-up |
| Invasive Work-up-Needle Biopsy | RU: Of the women who get a non-invasive workup, 14.7% subsequently receive an invasive procedure based on the Ontario Breast Screening Program (OBSP)30 Cost: physician clinic visit, needle biopsy procedure and pathology based on OHIP29 |
82.1% of women who receive an invasive work-up. | $745.46 per work-up |
| Invasive Work-up-Excisional | RU: Of the women who get a non-invasive workup, 14.7% receive an invasive procedure based on OBSP30; Cost: physician clinic visits, excision, pathology based on OHIP29 |
17.8% of women who receive an invasive work-up. | $1,652.44 per work-up |
| Treatment | |||
| Chemotherapy | RU: Proportion of women receiving chemotherapy; Cost: Mean value of 1st, 2nd and 3rd generation chemotherapies based on expert opinion, Cancer Care Ontario (CCO)31, and Sunnybrook Pharmacy Department32. |
Women receiving chemotherapy with invasive cancer-see details below Women receiving chemotherapy with DCIS=0%-see details below |
$7,376.10 per course |
| Trastuzumab | RU: Incidence of Trastuzumab-assume all women who are HER2+ received Trastuzumab; Cost: Assume that treatment Costs are based on 8 cycles; Includes chemotherapy costs recommended for Trastuzumab (paclitaxel); includes health care personnel costs and physician clinic visits associated with administration. Based on ASCO abstract33, CCO31, and Sunnybrook Pharmacy Department32 |
14% with invasive cancer 0% with DCIS | $29,709 per course |
| Tamoxifen | RU: Assume utilization of tamoxifen for appropriate population over 10 year time horizon. Cost: annual cost (excludes markup+dispensing)+physician clinic visit 4 times per year. Based on the Ontario Drug Benefit Formulary (ODBF)34 |
100% for invasive cancer based in eligible women 100% for DCIS in eligible women |
$383.40 per annum |
| Aromatase Inhibitors (AI) | RU: Assume utilization of AI for appropriate population over 10 year time horizon; Cost: annual cost of letrozole (excludes markup and dispensing) + physician clinic visits 4 times per year. Based on the ODBF34. |
100% for invasive cancer in eligible women 0% for DCIS |
$822.40 per annum |
| Treatment Cost per Appropriate Cohort | |||
| ER+, <50 years, DCIS, annual cost | RU: tamoxifen only (over 10 year time horizon); Cost: tamoxifen only based on the ODBF34 |
100% | $383.40 |
| ER+, <50 years, Invasive, annual cost | RU: tamoxifen (over 10 year time horizon)+chemotherapy; Cost: tamoxifen (over 10 year time horizon)++chemotherapy based on the ODBF34, CCO31, Sunnybrook Pharmacy Department32 and expert opinion. |
100% | $7,759.50 |
| ER+, <50 years, Invasive, annual cost with Trastuzumab | RU: tamoxifen (over 10 year time horizon)+chemotherapy+Trastuzumab; Cost: tamoxifen (over 10 year time horizon)+chemotherapy+Trastuzumab. Based on the ODBF34, CCO31, Sunnybrook Pharmacy Department32 and expert opinion. |
100% | $37,462.50 |
| ER+, >=50 years, DCIS, annual cost | RU: tamoxifen (over 10 year time horizon)+only; Cost: tamoxifen only based on ODBF34 |
100% of women in this cohort received this regimen | $383.40 |
| ER+, >=50 years, Invasive, annual cost | RU: chemotherapy+AI (over 10 year time horizon); Cost: chemotherapy+AI (over 10 year time horizon). Based on the ODBF34, CCO31, Sunnybrook Pharmacy Department32 and expert opinion. |
100% of women in this cohort received this regimen | $8,198.50 |
| ER+, >= 50 years, Invasive, annual cost with Trastuzumab | RU: chemotherapy+AI (over 10 year time horizon)+Trastuzumab; Cost: chemotherapy +AI (over 10 year time horizon)+Trastuzumab. Based on the ODBF34, CCO31, Sunnybrook Pharmacy Department32 and expert opinion. |
100% of women in this cohort received this regimen | $37,901.50 |
| ER-, <50 years, DCIS, annual cost | No drug therapy. Based on expert opinion. | 100% of women in this cohort received this regimen | $0 |
| ER-, < 50, Invasive, annual cost | RU: chemotherapy; Cost: chemotherapy. Based on the ODBF34, CCO31, Sunnybrook Pharmacy Department32 and expert opinion. |
100% of women in this cohort received this regimen | $7,376.10 |
| ER-, < 50 years, Invasive, annual cost with Trastuzumab | RU: chemotherapy+Trastuzumab; Cost: chemotherapy+Trastuzumab Based on the ODBF34, CCO31, Sunnybrook Pharmacy Department32 and expert opinion. |
100% of women in this cohort received this regimen | $37,079.10 |
| ER-, >=50 years, DCIS, annual cost | No drug therapy. Based on expert opinion | 100% of women in this cohort received this regimen | $0 |
| ER-, >=50 years, Invasive, annual cost | RU: chemotherapy; Cost: chemotherapy. Based on the ODBF34, CCO31, Sunnybrook Pharmacy Department31 and expert opinion. |
100% of women in this cohort received this regimen | $7,376.10 |
| ER-, >=50 years, Invasive, annual cost with Trastuzumab | RU: chemotherapy+Trastuzumab; Cost: chemotherapy+Trastuzumab Based on the ODBF34, CCO31, Sunnybrook Pharmacy Department32 and expert opinion. |
100% of women in this cohort received this regimen | $37,079.10 |
| Procedures | |||
| Radiation for invasive cancer | RU: Proportion of women with breast cancer who received radiation therapy. Based on Mittmann et al35. Cost: 25 fractions * $138 (1996) or 188.39 (2012). Based on Bank of Canada19, Earle et al36, and OHIP29. |
67% | $5,014.05 per radiation |
| Surgery for invasive cancer | RU: Proportion of women with breast cancer receiving surgery based on Mittmann et al37l. | 90% | Costs stratified by lumpectomy and mastectomy |
| Surgery-lumpectomy for invasive cancer | RU: Proportion of all women receiving surgery; Cost: OCCI 2012. Based on Ontario Case Cost Initiative (OCCI)38. |
63% The joint report by the Canadian Institute for Health Information (CIHI) and the Canadian Partnership Against Cancer show the annual rates for the two treatments vary widely from one province to another. | $4,937.06 per surgery |
| Surgery-mastectomy for invasive cancer | RU: Proportion of all women receiving surgery Cost: OCCI 2012. Based on OCCI38. |
37% The joint report by the Canadian Institute for Health Information (CIHI) and the Canadian Partnership Against Cancer show the annual rates for the two treatments vary widely from one province to another. | $6,956.77 per surgery |
| Radiation for DCIS | RU: Proportion of women with DCIS who received radiation therapy Cost: 25 fractions * $138 (1996) or 188.39 (2012). Based on Bank of Canada19, Earle et al36, and OHIP29. |
50% | $5,014.05 per radiation |
| Surgery-lumpectomy for DCIS | RU: Proportion of DCIS women receiving surgery, expert opinion40 Cost: OCCI 2012. Based on OCCI38, Canadian Institute for Health Information (CIHI) Report39 and expert opinion40 |
67% | $4,937.06 per surgery |
| Surgery-mastectomy for DCIS | RU: Proportion of all DCIS receiving surgery Cost: OCCI 2012. Based on OCCI38, CIHI Report39, and expert opinion40 |
33% | $6,956.77 per surgery |
| Indirect Costs | |||
| Time off for screening | RU: Assume 4 hours for women based on travel, appointment and waiting time; Cost: $22.87/hour for women. Based on Statistics Canada 201241. |
100% | $91.48 per time off for screening |
| Lost productivity in first year | RU: Assumption, all women working; women lost 27% of annual income due to breast cancer treatment based on Lauzier 200842; Cost: $22.87/hour for women. Based on Statistics Canada 201241 |
100% | $12,838.18 per annum |
| Premature death costs | RU: Assumption, all women who died Cost: $22.87/hour for women* 40 hours * 52 weeks. Based on Statistics Canada 201241 |
RU=resource utilization
All women received either mastectomy or lumpectomy with and without radiation. Chemotherapy was assigned by stage of disease. Hormonal treatment was assigned by hormone receptor status. Traztuzumab was assigned by HER2 status. Women with ductal carcinoma in situ (DCIS) did not receive trastuzumab (Table 1).
Costs
Canadian unit costs ($2012CAN) were applied to each of the resources utilized and modeled ($1.01US= $1CAN based on Dec 31, 2012)18. Non-2012 costs were converted to 2012 values using the Consumer Price Index19. A number of cost sources were used, including provincial drug formularies, national statistics programs, costing programs, health resource management, and the published literature. Capital or institutional costs of the equipment were not included in this analysis. Lost productivity costs were based on the literature and the average Canadian wage per women (Table 1).
Utility Values
We used age-specific population health preference values20 derived from US Medical Expenditure Panel Survey data applying the EuroQoL EQ-5D instrument using US scoring21. For women with newly diagnosed breast cancer, we assumed decrements to quality of life based on stage lasting for one year post-diagnosis after which a women would return to her appropriate age-specific value. For a women diagnosed with Stage IV breast cancer, the decrement was applied to her remaining lifetime. For screening-related health states, disutilities of 0.006 for one week and 0.105 for five weeks were applied for a screening mammogram and positive screening respectively22.
Analyses
When estimating the lifetime costs of screening and management for each screening scenario and no screening to calculate the overall cost to society and for premature death for each of the different screening scenarios where no discount rates were used to determine overall lifetime costs. Outcomes were LYG and QALY. We compared the costs and outcomes from each screening scenario in an incremental stepwise cost-effectiveness analysis as follows: a scenario was considered to be efficient when there was no alternative scenario with improved outcomes for a lower or at the same cost or when there was no combination of two other screening scenarios that improved outcomes for the same costs. Incremental cost-utility ratios (ICURs) were computed as the difference in cost divided by the difference in outcomes only for the efficient scenarios. We also determined the marginal (or average) cost-effectiveness of each screening relative to the no screening scenario. All costs and health outcomes for the incremental analyses were discounted at a 5% rate. We carried out univariate sensitivity analyses in which we varied the inputs for cost and utilization of key parameters such as screening rates, screening sensitivity and specificity, health preference, treatment costs, cost of medications and discount rate (Table 2).
Table 2.
Univariate Sensitivity Analyses
| Variable | Base Case Value | Sensitivity Analysis Value | Source and Comments |
|---|---|---|---|
| Cost of mammography | $183.00 per screen | $100.00 per screen | Assumption-Reduction in cost |
| Percent of women eligible for screening who missed screening | 0% | 50% | In Ontario, 60% of women over age 50 participate in regular screening, but about 43% do this through the organized program. The retention rate for women continuing screening after a previous screen is approximately 85%43. |
| Screening rates for population | 100% first screen | No subsequent screens | Assumption: Impact of repeat screening/retention |
| Sensitivity | Model calibrated as per empirical data44;45 | 100% | Assumption: Ideal scenario |
| Specificity | as per empirical data | 100% | Assumption: Ideal scenario |
| Treatment | Surgery, radiation, chemo, hormonal | 0% treated | Assumption applied to all women in model |
| Adjuvant chemotherapy | 100% of cohort received adjuvant chemotherapy | 75% of cohort received chemotherapy | Assumption: not all patients would receive chemotherapy |
| Utility values | Model values | +/− 25% | Assumption: change in utility values |
| Disutility | Model value | No disutility | Assumption: change in utility values |
| Discount Rate | Model rate | 0% | Assumption applied to all women in model |
Results
From the societal perspective, overall costs (undiscounted) for annual screening for 1,000 women ranged from $11.3 (50 to 69 years) to $16.0M (40 to 74 years). In contrast, costs for biennial and triennial screening for 1,000 women were between $8.4–$11.2M (50–69; 50–74 years) and $7.6–$8.3M (50–60; 50–74 years), respectively. The overall cost associated for the no screening scenario in 1,000 women was $4.8 M ($4,875 per woman) over a lifetime time horizon (Table 3). Active screening itself was a system cost driver and represented a significant portion of the overall cost to the health system and the societal cost burden. The ratio of the cost of screening to overall cost was directly proportional to the aggressiveness of the overall screening scenario. Treatment costs were slightly higher for active screening scenarios when compared to No Screening. Screening costs were higher proportion-wise when compared to treatment and procedure costs for more aggressive scenarios. Lowering the age of screening to 40 from 50 years of age, added approximately $2–3M for 1,000 women ($2,000–$3,000 lifetime cost per woman). Adding 5 years to the upper limit of 69 years, also added approximately $1M per 1,000 women ($1,000 per woman) to the total cost. If the cost of premature death was included in the societal cost, it would increase the overall cost by an additional $7.4M to $10.8M depending on the screening scenario, with more aggressive screening being associated with fewer lives lost lives and thus lower costs associated with premature deaths.
Table 3.
Component costs for each Screening Scenario
| Screening Scenario | Screening Costs | Diagnostic and Clinical Workup Costs | Surgical and Radiation Costs | Adjuvant Medication Costs1 | Indirect Costs2 | Overall Societal Cost (excluding | Additional Cost of Premature Death |
|---|---|---|---|---|---|---|---|
| No Screening | $0 | $83,936 | $1,220,608 | $1,713,473 | $1,856,569 | $4,874,587 | $12,671,495 |
| Digital Triennial 50–69 | $1,573,325 | $61,405 | $1,406,127 | $1,821,409 | $2,724,921 | $7,587,187 | $10,085,986 |
| Digital Triennial 50–74 | $1,911,210 | $53,721 | $1,477,251 | $1,864,335 | $2,964,934 | $8,271,452 | $9,778,164 |
| Digital Biennial 50–69 | $2,175,956 | $55,863 | $1,437,689 | $1,807,948 | $3,019,322 | $8,496,778 | $9,261,094 |
| Digital Biennial 50–74 | $2,672,157 | $46,018 | $1,524,021 | $1,849,832 | $3,350,174 | $9,442,203 | $8,866,323 |
| Digital Annual 50–69 | $4,127,472 | $47,245 | $1,487,568 | $1,713,469 | $3,904,655 | $11,280,409 | $7,847,010 |
| Digital Annual 40–49 | $2,484,365 | $75,590 | $1,276,581 | $1,705,534 | $2,848,195 | $8,390,266 | $10,795,828 |
| Digital Annual 50–74 | $4,908,452 | $37,013 | $1,575,399 | $1,724,528 | $4,364,947 | $12,610,339 | $7,408,591 |
| Digital Annual 40–49, Biennial 50–69 | $4,551,101 | $49,334 | $1,479,841 | $1,788,107 | $3,985,553 | $11,853,937 | $7,552,892 |
| Digital Annual 40–49, Biennial 50–74 | $5,027,968 | $39,529 | $1,567,832 | $1,832,766 | $4,316,621 | $12,784,716 | $7,130,482 |
| Digital Annual 40–69 | $6,540,531 | $40,605 | $1,530,563 | $1,694,982 | $4,864,284 | $14,670,965 | $6,180,986 |
| Digital Annual 40–74 | $7,314,735 | $30,529 | $1,618,139 | $1,707,003 | $5,322,003 | $15,992,409 | $5,794,587 |
Adjuvant medication costs included adjuvant chemotherapy, hormonal therapies (e.g., tamoxifen and aromatase inhibitors), and traztuzumab.,
Based on lost productivity
For the cost-effectiveness analysis, screening scenarios for women between 50 and 69 were dominant over scenarios where the stopping age for screening was 74 years. Annual screenings for women between 40–69 and 40–74 were the considered the dominant treatment when compared to annual scenarios using narrower age ranges.
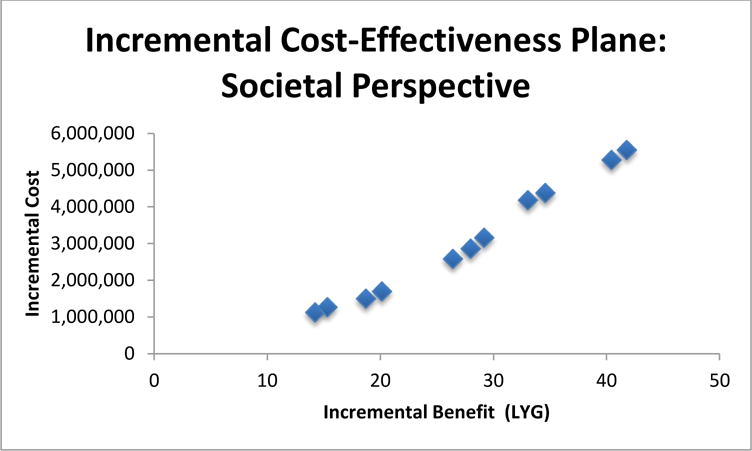
When compared to the no screening scenario, all marginal cost-effectiveness (CE) ratios for the societal perspective were under $140,000/LYG and $155,000/QALY. The lowest incremental ratio was calculated for the least frequent screening with the tightest age band (triennial screening for 50–69 year olds) $79,035/LYG and $94,762/QALY. The most aggressive scenario (annual screening for 40–74 year olds) was associated with the highest incremental ratio $132,932/LYG and $154,187/QALY (Table 4; Figure 1).
Table 4.
Cost-effectiveness Different Screening Scenarios from the Societal Perspective*
| Screening Scenario | Total Societal Cost (per 1,000 women) | Total QALYs (per 1,000 women) | Incremental Cost per QALY | Average Cost per QALY relative to no screening scenario |
|---|---|---|---|---|
| No Screening | $1,387,948 | 14,059 | – | Basecase |
| Triennial 50–69 | $2,511,486 | 14,071 | $94,762 | $94,762 |
| Triennial 50–74 | $2,652,005 | 14,072 | dominated | $99,670 |
| Biennial 50–69 | $2,885,565 | 14,075 | $97,006 | $95,313 |
| Biennial 50–74 | $3,083,486 | 14,076 | dominated | $100,912 |
| Annual 50–69 | $3,083,486 | 14,082 | $159,858 | $114,778 |
| Annual 40–49 | $4,156,667 | 14,073 | dominated | Higher cost; worse outcome |
| Annual 50–74 | $3,970,099 | 14,083 | $226,278 | $120,521 |
| Annual 40–49, Biennial 50–69 | $5,572,348 | 14,088 | dominated | $146,333 |
| Annual 40–49, Biennial 50–74 | $5,767,102 | 14,089 | dominated | $146,951 |
| Annual 40–69 | $6,668,051 | 14,094 | $216,828 | $150,938 |
| Annual 40–74 | $6,943,065 | 14,095 | $262,828 | $154,187 |
Cost and QALYs discounted at 5%.
Figure 1.

Incremental Cost-Effectiveness Plane for Societal Perspective. Value expressed per 1,000 women alive at age 40.
Sensitivity Analyses
When comparing active screening scenarios to No Screening in the marginal analyses, we found that the major cost drivers were no treatments (including drug, surgery, or radiation) following a diagnosis and no subsequent screening (Table 5). The model was generally insensitive to the changes in missed screening and no subsequent screening. But showed more favourable incremental ratios when there was a reduction in the proportion of individuals receiving adjuvant chemotherapy, when screening costs were decreased and when specificity and sensitivity. Not providing treatment (no medication, radiation, surgery), progression had the biggest impact on the ICER. The model was sensitive to modifications in utility values, showing more favourable ICURs when the utility values were increased by 25%, thereby showing greater incremental benefits between the active screening scenarios and No Screening. In contrast, less favourable or higher ICURs were modeled when the utility values were decreased by 25% as a result of smaller differences in the benefit. Lastly, changing the discount rate to 0% decreased the ICURs substantially.
Table 5.
Univariate Sensitivity Analysis: Societal Perspective-Screening Scenarios compared to No Screening where the outcomes are cost per quality adjusted life year (QALY) (discount=5%).
| Screening Scenarios |
Base Case |
Utility Values +25% |
Utility Values −25% |
Specificity 100% |
Sensitivity 100% |
50% missed screenings |
Disutility excluded |
Screening Cost =$100 |
No Treatments (including drug, surgery or radiation) |
No subsequent screening |
75% receive adjuvant chemotherapy |
Discount rate =0% |
|---|---|---|---|---|---|---|---|---|---|---|---|---|
| No Screening | – | – | – | – | – | – | – | – | – | – | – | – |
| Digital Triennial 50–69 | $94,762 | $74,849 | $126,349 | $78,780 | $85,837 | $95,995 | $107,858 | $77,384 | $1,963,362 | $93,624 | $86,364 | $41,575 |
| Digital Triennial 50–74 | $99,700 | $78,812 | $132,932 | $83,793 | $91,707 | $100,339 | $113,732 | $81,684 | $2,017,095 | $93,624 | $89,826 | $46,703 |
| Digital Biennial 50–69 | $95,313 | $75,461 | $127,083 | $80,679 | $83,935 | $94,904 | $107,993 | $76,713 | $1,616,400 | $93,624 | $87,140 | $41,984 |
| Digital Biennial 50–74 | $100,912 | $79,954 | $134,549 | $86,120 | $89,992 | $99,722 | $114,702 | $81,461 | $1,870,599 | $93,624 | $90,735 | $47,597 |
| Digital Annual 50–69 | $114,778 | $91,076 | $153,037 | $99,421 | $101,858 | $103,318 | $132,970 | $89,701 | $1,240,537 | $93,624 | $103,592 | $52,077 |
| Digital Annual 50–74 | $120,522 | $95,675 | $160,695 | $105,048 | $107,224 | $108,112 | $140,148 | $94,347 | $1,410,235 | $241,662 | $107,059 | $57,858 |
| Digital Biennial 40–74 | $126,612 | $100,640 | $168,816 | $103,579 | $107,306 | $120,253 | $154,502 | $100,680 | $5,968,018 | $241,662 | $116,064 | $51,194 |
| Digital Annual 40–49, Biennial 50–69 | $146,333 | $116,540 | $195,111 | $121,352 | $122,534 | $135,003 | $184,737 | $114,221 | $5,834,291 | $241,662 | $135,983 | $53,166 |
| Digital Annual 40–49, Biennial 50–74 | $146,950 | $117,061 | $195,934 | $123,180 | $124,491 | $136,750 | $184,756 | $114,985 | $5,968,397 | $241,662 | $135,473 | $55,855 |
| Digital Annual 40–69 | $150,937 | $120,211 | $201,250 | $125,147 | $128,592 | $131,972 | $190,762 | $116,971 | $4,081,165 | $241,662 | $137,604 | $58,900 |
| Digital Annual 40–74 | $154,187 | $122,810 | $205,583 | $128,097 | $131,177 | $134,090 | $195,009 | $119,646 | $4,726,306 | $241,662 | $138,757 | $63,233 |
Discussion
This is the first economic analysis to evaluate on the cost-effectiveness of mammography screening from a Canadian societal perspective. Since health care funders and policy decision makers require a demonstration of the value of new interventions/strategies through a comparison of costs and benefits, we conducted a lifetime cost-effectiveness and cost-utility analysis for various relevant screening scenarios for this perspective. Early diagnosis of breast cancer through screening mammography can save a woman’s life, however, there are costs, limitations, and possible harms associated with the screening tests and treatments. We tried to determine the value of mammography screening from both the cost and benefit end.
The UWBCS model was selected for the analysis because it allowed the simulation of the growth of a distribution of breast cancers within a cohort of women and the consideration of the individual effects of various detection scenarios and treatment regimens on mortality or other outcomes. The strength of the UWBCS model was that it was validated against empirical data from the US. Modified for use in the Canadian context, it performed quite well in predicting breast cancer incidence in the absence of screening17. In addition, the model used modern empirical data on the sensitivity and specificity of screening mammography versus age and breast density to describe the screening process. Canadian data on the utilization of therapies and costs were used and no assumptions on the mortality reduction of screening were applied explicitly in the model.
The main overall cost driver for the active screening scenarios was the frequency of screening. We also showed that there was a significant reduction in the cost of premature death with more frequent screening, with an inverse relationship between the cost of screening and the cost of premature death.
Our stepwise incremental cost-effectiveness analysis showed that broader age bands and more frequent screening were dominated indicating that tighter age bands and less frequent screening were optimal when cost-effectiveness rather than lifesaving was considered. The exception is annual screening from 40 to 74 years, which is not dominated but has high ICERs.
In our discounted marginal cost-effectiveness analysis, we showed that all active screening scenarios were more effective than the no screening scenario. All ICERs for active screening scenarios when compared to No Screening scenario generally fell below the well-accepted thresholds of $100,000 per LYG ratio and most scenarios fell below the $150,000 per QALY. The marginal incremental ratios generated from our screening lifetime model are generally in line with other ICERs used in oncology decision-making ($/QALY)23. Moreover, the incremental ratios are well below the willingness to pay threshold of >$300,000/QALY reported by approximately half of Canadian and American Oncologists defined “good value for money” at incremental ratios been $50,000–$100,000/LYG, with another third using >$100,000/LYG as a good value definition24. A recent editorial on incremental ratios questioned the wisdom of the existing thresholds defining25. A number of studies have evaluated the cost-effectiveness of screening scenarios. Most have been conducted from a US health system perspective and focused on different risk factors such as early and late age and genetic profile8;10;26;27. However, none have examined the impact of lost productivity from the societal perspective or for that matter a Canadian lens.
Annual scenarios had higher marginal ratios than less frequent scenarios but they were also associated with higher benefits (LYG, QALY). In this analysis, societal costs were based on lost productivity around attending mammography screening mammogram (1/2 day), positive (true and false) screens (5 weeks) and diagnosis of invasive cancer (one year). Any changes in time horizons would affect the overall cost. The more aggressive the screening scenario, the more cancers and false positives are detected, which leads to more lost productivity leading to higher incremental costs and higher incremental ratios. Since both the LYG and QALYs and costs rise together almost linearly with the number of lifetime screens per woman, the decision on how to screen is mainly related to willingness to pay and avoiding recalling too many women for further examinations after positive screens. Thus a screening tool, which would achieve higher specificity, would be attractive.
A comparison of the incremental ratios for all the active screening scenarios compared to no screening showed a relatively tight range of ratios within $40,000–$60,000 of one another. Increasing the age of screening from 69 to 74 years, marginally increased the incremental ratios due to additional screening costs, but improved outcomes. Lowering the age of screening in women from 50 to 40 years, resulted in increased incremental ratios, mostly due to the increased screening costs but also yielded more LYGs and QALYs.
If examined by age band (50–69 and 50 to 74 years), the modelled incremental ratios for annual, biennial and triennial screening scenarios compared to No Screening each showed very similar incremental ratios. When choosing a screening scenario based on the value assessments, one should also consider the improvement in LYGs and QALYs associated with more frequent screening.
For the univariate sensitivity analysis, based on the analyses for the societal perspective (discount=5%), where the different screening scenarios were compared to No Screening for both LYGs and QALYs, the model was generally robust. The ICER model was generally insensitive to changes in missed screening, no subsequent screening and reduction in the proportion of individuals receiving adjuvant chemotherapy. The model was sensitive to decreased screening costs, improved specificity and sensitivity, leading to more favourable ICERs. Not providing treatment (no medication, radiation, surgery) thereby expediting progression had the biggest impact on the ICER increasing it to over $500,000 per LYG. Modifying the same parameters for the ICUR analysis, showed similar results to the ICER analysis but also showed that the model was sensitive to modifications in utility values, predicting more favourable ICURs when the utility values were increased by 25%, thereby showing greater incremental benefits between the active screening and No Screening scenarios. In contrast, less favourable or higher ICURs were generated when the utility values were decreased by 25% as a result of smaller differences in the benefit leader to higher ICUR. Most significantly, ICUR values fell substantially when the no discount rate was applied. Discounting significantly affected the long-term effectiveness outcomes over the model time horizon, while the costs were up front.
As with every model, there are limitations. The model itself is subject to limitations outlined in previous work17. We assumed that 100% of eligible women were screened in this model whereas in reality, compliance is markedly lower. In Ontario, the most heavily populated province in Canada, screening rates were found to be 61% (2010–2011) of women 50 to 74 years through an organized screening program28. When we decreased the screening rate to 50% in this model, incremental ratios remained similar to those of our basecase, mainly due to the fact that along with the costs for screening decreasing, so did the number of invasive cancers detected affecting LYG and QALYs.
We did not include the cost of premature death in the incremental evaluations to avoid the possibility of double counting. However, given the significance of premature death to society, as well as its costs, we anticipate that more frequent screening would significantly decrease the costs associated with premature death due to breast cancer.
The work done here may be helpful in informing the issue regarding the most appropriate screening scenario for a population. We showed that the greatest single cost contributor in a screening program is the screening mammography itself. This is greater than the costs of therapy in the health system perspective. The more screens that a woman receives in her life, the greater the financial cost to the health care system and to society. Because both the life savings and costs rise together almost linearly with the number of lifetime screens per women, the decision on how to screen is mainly related to willingness to pay and avoiding recalling too many women for further examinations after positive screens. Future models will consider the impact of different screening technologies on costs and outcomes.
Figure 2.
Incremental Cost-Effectiveness Plane for Societal Perspective. Values expressed per 1,000 women.
Acknowledgments
The work performed to create this report was supported by a contract from The Canadian Breast Cancer Foundation, Ontario Region. The University of Wisconsin breast cancer simulation model used in this analysis was supported in part by grant number U01 CA152958 from the National Cancer Institute through the Cancer Intervention and Surveillance Modeling Network (CISNET). Model input data on the performance of screening mammography was provided by the National Cancer Institute–funded Breast Cancer Surveillance Consortium (BCSC) grant number UC2CA148577 and contract number HHSN261201100031C. The content is solely the responsibility of the authors and does not necessarily represent the official views of the National Cancer Institute or the National Institutes of Health. The collection of BCSC cancer data used in this study to develop input parameters was supported in part by several state public health departments and cancer registries throughout the US. For a full description of these sources, please see: http://www.breastscreening.cancer.gov/work/acknowledgement.html. We thank the participating women, mammography facilities, and radiologists for the data they have provided for this study. A list of the BCSC investigators and procedures for requesting BCSC data for research purposes are provided at: http://breastscreening.cancer.gov/.
Reference List
- 1.The Canadian Task Force on Preventive Health Care. Recommendations on screening for breast cancer in average-risk women aged 40–74 years. CMAJ. 2011;183(17):1991–2001. doi: 10.1503/cmaj.110334. [DOI] [PMC free article] [PubMed] [Google Scholar]
- 2.Perry N, Broeders M, de Wolf C, Tomberg S, Holland R, von Karsa L. European guidelines for quality assurance in breast cancer screening and diagnosis. Fourth edition—summary document. Annals of Oncology. 2008;19(4):614–622. doi: 10.1093/annonc/mdm481. [DOI] [PubMed] [Google Scholar]
- 3.US Preventive Service Task Force. Preventive Services Task Force recommendation statement. Annals of Internal Medicine. 2009;151(10):716–726. doi: 10.7326/0003-4819-151-10-200911170-00008. [DOI] [PubMed] [Google Scholar]
- 4.de Oliveira C, Bremner KE, Pataky R, Gunraj N, Chan K, Peacock S, et al. Understanding the costs of cancer care before and after diagnosis for the 21 most common cancers in Ontario: a population-based descriptive study. CMAJ Open. 2013;1(1):E1–E8. doi: 10.9778/cmajo.20120013. [DOI] [PMC free article] [PubMed] [Google Scholar]
- 5.de Oliveira C, Bremner KE, Pataky R, Gunraj N, Haq M, Chan K, et al. Trends in use and cost of initial cancer treatment in Ontario: a population-based descriptive study. CMAJ Open. 2013;1(4):E151–E158. doi: 10.9778/cmajo.20130041. [DOI] [PMC free article] [PubMed] [Google Scholar]
- 6.Patra J, Popova S, Rehm J, Bondy S, Flint R, Giesbrecht N. Economic cost of chronic disease in Canada 1995–2003. The Ontario Chronic Disease Prevention Alliance and the Ontario Public Health Association. 2014 1-15-2014. [Google Scholar]
- 7.Will BP, Berthelot JM, Le Petit C, Tomiak EM, Verma S, Evans WK. Estimates of the lifetime costs of breast cancer treatment in Canada. European Journal of Cancer. 2000;36:724–735. doi: 10.1016/s0959-8049(99)00340-8. [DOI] [PubMed] [Google Scholar]
- 8.Salzmann P, Kerlikowske K, Phillips K. Cost-effectiveness of extending screening mammography guidelines to include women 40 to 49 years of age. Annals of Internal Medicine. 1997;127(11):955–966. doi: 10.7326/0003-4819-127-11-199712010-00001. [DOI] [PubMed] [Google Scholar]
- 9.Mandelblatt J, Saha S, Teutsch S, Siu AL, Atkinds D, Klein J, et al. The cost-effectiveness of screening mammography beyond age 65: a systematic review for the U.S. Preventive Services Task Force. Annals of Internal Medicine. 2003;139(10):835–842. doi: 10.7326/0003-4819-139-10-200311180-00011. [DOI] [PubMed] [Google Scholar]
- 10.Tosteson ANA, Stout NK, Fryback DG, Acharyya S, Herman BA, Hannah LG, et al. Cost-effectiveness of digital mammography breast cancer screening. Annals of Internal Medicine. 2008;148:1–10. doi: 10.7326/0003-4819-148-1-200801010-00002. [DOI] [PMC free article] [PubMed] [Google Scholar]
- 11.Stout NK, Rosenberg MA, Trentham-Dietz A, Smith MA, Robinson SM, Fryback DG. Retrospective cost-effectiveness analysis of screening mammography. Journal of the National Cancer Institute. 2006;98:774–782. doi: 10.1093/jnci/djj210. [DOI] [PubMed] [Google Scholar]
- 12.Schousboe JT, erlikowske K, Loh A, Cummings SR. Personalizing mammography by breast density and other risk factors for breast cancer: analysis of health benefits and cost-effectiveness. Annals of Internal Medicine. 2011;155(1):10–20. doi: 10.7326/0003-4819-155-1-201107050-00003. [DOI] [PMC free article] [PubMed] [Google Scholar]
- 13.Stout NK, Lee SJ, Schechter CB, Kerlikowske K, Alagoz O, Donald B, et al. Benefits, harms, and costs for breast cancer screening after US implementation of digital mammography. Journal of the National Cancer Institute. 2014;106(5) doi: 10.1093/jnci/dju092. [DOI] [PMC free article] [PubMed] [Google Scholar]
- 14.Fryback DG, Stout NK, Rosenberg MA, Trentham-Dietz A, Kuruchittham V, Remington PL. The Wisconsin Breast Cancer Epidemiology Simulation Model. J Natl Cancer Inst Monogr. 2006;36:37–47. doi: 10.1093/jncimonographs/lgj007. [DOI] [PubMed] [Google Scholar]
- 15.Feuer EJ, Etzioni R, Cronin KA, Mariotto A. The use of modeling to understand the impact of screening on U.S. mortality: examples from mammography and PSA testing. Stats Methods Med Res. 2004;13(6):421–442. doi: 10.1191/0962280204sm376ra. [DOI] [PubMed] [Google Scholar]
- 16.Cancer Intervention and Surveillance Modeling Network. Breast Cancer Modeling. 2014 [Google Scholar]
- 17.Yaffe MJ, Mittmann N, Stout NK, Lee P, Tosteson ANA. Modelling mammography screening for breast cancer in the Canadian context. Submitted to Health Reports. 2014 [PMC free article] [PubMed] [Google Scholar]
- 18.Bank of Canada. 10-Year Currency Converter. 4-8-2014. 8-4-2014. [Google Scholar]
- 19.Bank of Canada. Inflation Calculator. 2014 Bank of Canada. 7-7-2014. [Google Scholar]
- 20.Hanmer J, Vanness D, Gangnon R, Palta M, Fryback DG. Three methods tested to model SF-6D health utilities for health states involving comorbidity/co-occurring conditions. Journal of Clinical Epidemiology. 2009;63(3):331–341. doi: 10.1016/j.jclinepi.2009.06.013. [DOI] [PMC free article] [PubMed] [Google Scholar]
- 21.Fleishman JA. Methodology Report #15: Demographic and Clinical Variations in Health Status. Agency for Healthcare Research and Quality; 2005. [cited 2014 July 7 ]; Available from: URL: http://meps.ahrq.gov/mepsweb/data_files/publications/mr15/mr15.shtml. [Google Scholar]
- 22.de Haes JCJM. The impact of a breast cancer screening programme on quality-adjusted life-years. International Journal of Cancer. 1991;49:538–544. doi: 10.1002/ijc.2910490411. [DOI] [PubMed] [Google Scholar]
- 23.pan Canadian Oncology Drug Review. Economic Guidance Reports. 2014 7-7-2014. [Google Scholar]
- 24.Berry S, Bell CM, Ubel PA, Evans WK, Nadler E, Strevel EL, et al. Continental divide? The attitudes of US and Canadian Oncologists on the costs, cost-effectiveness, and health policies associated with new cancer drugs. Journal of Clinical Oncology. 2010;28(27):4149–4153. doi: 10.1200/JCO.2010.29.1625. [DOI] [PubMed] [Google Scholar]
- 25.Neumann PJ, Cohen JT, Weinstein MC. Updating cost-effectiveness - The curious resilience of the $50,000-per-QALY threshold. N Engl J Med. 2014;371:796–797. doi: 10.1056/NEJMp1405158. [DOI] [PubMed] [Google Scholar]
- 26.Kerlikowske K, Salzmann P, Phillips K, Cauley JA, Cummings SR. Continuing screening mammography in women aged 70–79 years: Impact on life expectancy and cost-effectiveness. JAMA. 1999;282(22):2156–2163. doi: 10.1001/jama.282.22.2156. [DOI] [PubMed] [Google Scholar]
- 27.Lindfors KK, Rosenquist J. The cost-effectiveness of mammographic screening strategies. JAMA. 1995;274(11):881–884. [PubMed] [Google Scholar]
- 28.Cancer Care Ontario. Breast Cancer Screening. Cancer Care Ontario. 4-29-2014. 7-7-2014. [Google Scholar]
- 29.Ministry of Health and Long-Term Care. Schedule of benefits for Physician Services Act under the Health Insurance Act. Ministry of Health and Long-Term Care; 5-1-2014. 7-7-2014. [Google Scholar]
- 30.Cancer Care Ontario. Ontario Breast Screening Program 20th Anniversary Report 1990–2010. 2014 Cancer Care Ontario. 7-7-2014. [Google Scholar]
- 31.Cancer Care Ontario. Cancer Care Ontario. 2014 7-7-2014. [Google Scholar]
- 32.Sunnybrook Health Sciences Centre. Sunnybrook Pharmacy Department. 2014 [Google Scholar]
- 33.ASCO. ASCO University. 2014 7-7-2014. [Google Scholar]
- 34.Ministry of Health and Long-Term Care. Ontario Drug Benefit Formulary/Comparative Drug Index. Ministry of Health and Long-Term Care; 6-25-2014. 7-7-2014. [Google Scholar]
- 35.Mittmann N, Porter J, Rangrej J, Seung SJ, Liu N, Saskin R, et al. Health system costs for stage-specific breast cancer: a population based approach. Current Oncology. 2014 doi: 10.3747/co.21.2143. In press. [DOI] [PMC free article] [PubMed] [Google Scholar]
- 36.Earle CC, Chapman RH, Baker CS, Bell CM, Stone PW, Sandberg EA, et al. Systematic overview of cost-utility assessments in oncology. American Society of Clinical Oncology. 2000;18(18):3302–3317. doi: 10.1200/JCO.2000.18.18.3302. [DOI] [PubMed] [Google Scholar]
- 37.Mittmann N, Isogai PK, Saskin R, Liu N, Porter J, Cheung MC, et al. Population-based home care services in breast cancer: resources and costs. Current Oncology. 2012;19(6):e383–e391. doi: 10.3747/co.19.1078. [DOI] [PMC free article] [PubMed] [Google Scholar]
- 38.Ontario Case Costing Initiative. OCCI Costing Analysis Tool. Ontario Case Costing Initiative. 2014 7-7-2014. [Google Scholar]
- 39.Canadian Partnership Against Cancer. Breast Cancer Surgery In Canada, 2007–2008 to 2009–2010. Canadian Institute for Health Information; 2014. [Google Scholar]
- 40.Personal communication with Radiation Oncologist. 7-7-2014. 7-7-2014.
- 41.Statistics Canada. Statistics Canada. 2014 7-7-2014. [Google Scholar]
- 42.Lauzier S, Maunsell E, Drolet M, Coyle D, Hebert-Croteau N, Brisson J, et al. Wage losses in the year after breast cancer: Extent and determinants among Canadian women. JNCI J Natl Cancer Inst. 2008;100(5):321–332. doi: 10.1093/jnci/djn028. [DOI] [PubMed] [Google Scholar]
- 43.Cancer Care Ontario. Ontario Breast Screening Program 2011 Report. 2013 7-7-2014. [Google Scholar]
- 44.Breast Cancer Surveillance Consortium. National Cancer Institute; 2014. 7-7-2014. [Google Scholar]
- 45.BC Cancer Agency. Screening Mammography Program Annual Report. BC Cancer Agency; 2014. 2-26-2013. [Google Scholar]