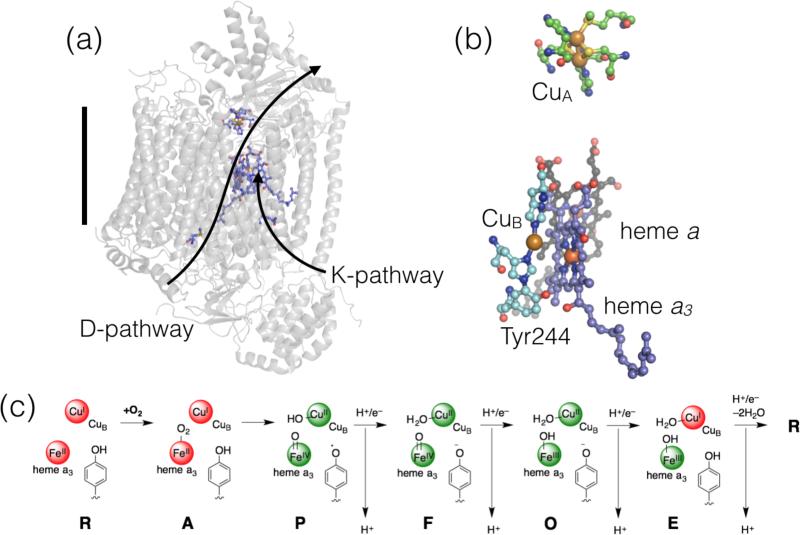
Figure 3.
Structure and mechanism of cytochrome c oxidase proteins. (a) Structure of CcO from bovine (PDB ID 2EIJ20) where the H+ loading pathways are labeled and the black bar indicates the approximate width of a lipid bilayer; (b) Close-up view of the redox cofactors in the active site; and (c) Mechanism of reduction of O2, including commonly used one-letter abbreviations for the intermediate species. The red colored spheres indicated reduced metal sites and the green spheres indicate oxidized sites.

