Abstract
Fitness landscapes describe the genotype-fitness relationship and represent major determinants of evolutionary trajectories. However, the vast genotype space, coupled with the difficulty of measuring fitness, has hindered the empirical determination of fitness landscapes. Combining precise gene replacement and next-generation sequencing, we quantify Darwinian fitness under a high-temperature challenge for over 65,000 yeast strains each carrying a unique variant of the single-copy gene at its native genomic location. Approximately 1% of single point mutations in the gene are beneficial, while 42% are deleterious. Almost half of all mutation pairs exhibit significant epistasis, which has a strong negative bias except when the mutations occur at Watson-Crick paired sites. Fitness is broadly correlated with the predicted fraction of correctly folded tRNA molecules, revealing a biophysical basis of the fitness landscape.
Fitness landscapes can inform on the direction and magnitude of natural selection and elucidate evolutionary trajectories (1), but their empirical determination requires the formidable task of quantifying the fitness of an astronomically large number of possible genotypes. Past studies were limited to relatively few genotypes (2, 3). Next-generation DNA sequencing (NGS) has permitted the analysis of many more genotypes (4–11), but research has focused on biochemical functions (4, 6, 8–12) rather than fitness. In the few fitness landscapes reported, only a small fraction of sites or combinations of mutations per gene were examined (5–7, 9).
We combine gene replacement in Saccharomyces cerevisiae with an NGS-based fitness assay to determine the fitness landscape of a tRNA gene. tRNAs carry amino acids to ribosomes for protein synthesis, and mutations can cause diseases such as cardiomyopathy and deafness (13). tRNA genes are typically shorter than 90 nucleotides, allowing coverage by a single Illumina sequencing read. We focus on , which recognizes the arginine codon AGG via its anticodon 5′-CCU-3′. is encoded by a single-copy nonessential gene in S. cerevisiae (14), because AGG is also recognizable by via wobble pairing. Deleting the gene (Fig. S1; Table S1) reduces growth rates in both fermentable (YPD) and non-fermentable (YPG) media, a problem exacerbated by high temperature (Fig. S2).
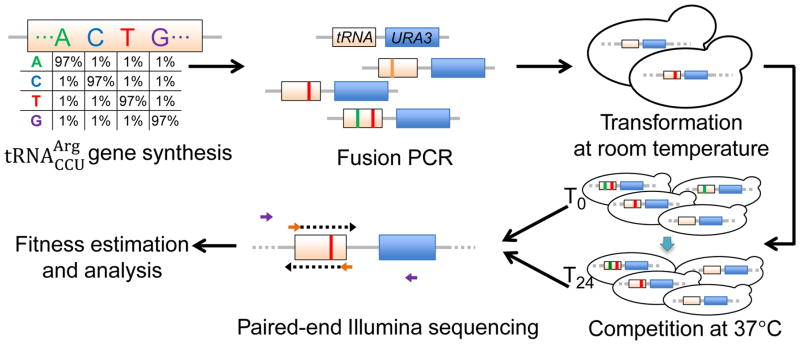
We chemically synthesized the 72-nucleotide gene with a mutation rate of 3% per site (1% per alternate nucleotide) at 69 sites; for technical reasons, we kept the remaining three sites invariant (15). Using these variants, we constructed a pool of >105 strains, each carrying a gene variant at its native genomic location (Figs. 1, S1). Six parallel competitions of this strain pool were performed in YPD at 37°C for 24 hours. The gene amplicons from the common starting population (T0) and those from six replicate competitions (T24) were sequenced with 100-nucleotide paired-end NGS (Fig. 1; Table S2). Genotype frequencies were highly correlated between two T0 technical repeats (Pearson’s correlation r = 0.99997; Fig. S3A) and among six T24 biological replicates (average r = 0.9987; Fig. S3B) (15). Changes in genotype frequencies between T0 and T24 were used to determine the Darwinian fitness of each genotype relative to the wild-type (15). For our fitness estimation, we considered 65,537 genotypes with read counts ≥ 100 at T0. In theory, a cell that does not divide has a fitness of 0.5 (16). Because mutations are unlikely to be fatal, we set genotype fitness at 0.5 when the estimated fitness is < 0.5 (due to stochasticity) (15). Fitness values from these en masse competitions agreed with those obtained from growth curve and pairwise competition (Fig. S4), as reported previously (16). We observed strong fitness correlations across diverse environments for a subset of genotypes examined (Fig. S5), suggesting that our fitness landscape is broadly relevant (15).
Fig. 1.
Determining the fitness landscape of the yeast gene. Chemically synthesized gene variants are fused with the marker gene URA3 before placed at the native locus. The tRNA variant-carrying cells are competed. Fitness of each genotype relative to wild-type is calculated from the relative frequency change of paired-end sequencing reads covering the tRNA gene variant during competition. See also Fig. S1 and (15).
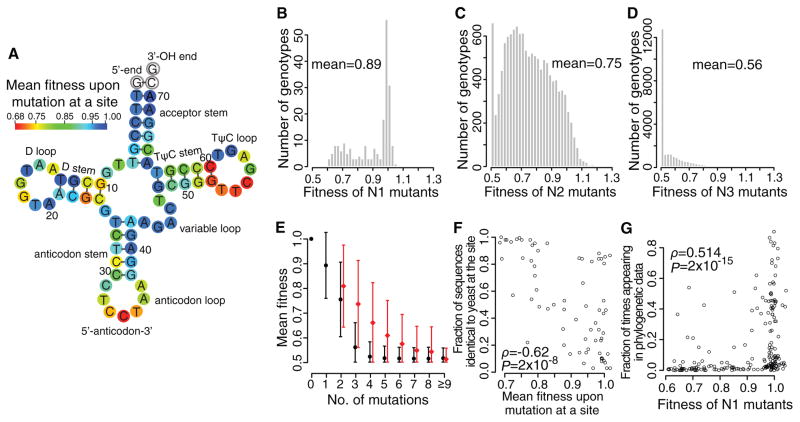
We estimated the fitness (f) of all 207 possible mutants that differ from the wild-type by one point mutation (N1 mutants), and calculated the average mutant fitness at each site (Fig. 2A). Average fitness decreased to < 0.75 by mutation at nine key sites, including all three anticodon positions (Table S3), three TΨC loop sites, one D stem site, and two paired TΨC stem sites (Fig. 2A). The TΨC loop and stem sites are components of the B Box region of the internal promoter, with C55 essential for both TFIIIC transcription factor binding and Pol III transcription (17). In addition, some sites such as T54 are ubiquitously post-transcriptionally modified (18). By contrast, the average mutant fitness is ≥ 0.95 at 30 sites (Fig. 2A). Overall, mutations in loops are more deleterious than in stems (P = 0.01, Mann-Whitney U test), although this difference becomes insignificant after excluding the anticodon (P = 0.09). Unsurprisingly, different mutations at a site have different fitness effects (Fig. S6). For example, mutation C11T in the D stem is tolerated (fC11T ± SE = 1.006 ± 0.036), but C11A and C11G are not (fC11A = 0.676 ± 0.030 and fC11G = 0.661 ± 0.035); likely due to G:U paring in RNA.
Fig. 2.
Yeast gene fitness landscape. (A) Average fitness upon a mutation at each site. White circles indicate invariant sites. (B–D) Fitness distributions of (B) N1, (C) N2, and (D) N3 mutants, respectively. (E) Mean observed fitness (black circles) decreases with mutation number. Red circles show mean expected fitness without epistasis (right shifted for viewing). Error bars show one standard deviation. (F) Fraction of the 200 eukaryotic genes with the same nucleotide as yeast at a given site decreases with the average fitness upon mutation at the site in yeast. Each dot represents one of the 69 examined tRNA sites. (G) Fraction of times that a mutant nucleotide appears in the 200 sequences increases with the fitness of the mutant in yeast. Each dot represents a N1 mutant. In (F) and (G), ρ, rank correlation coefficient; P, P-value from t-tests.
The fitness distribution of N1 mutants shows a mean of 0.89 and a peak at 1 (Fig. 2B). Only 1% of mutations are significantly beneficial (nominal P < 0.05; t-test based on the six replicates), whereas 42% are significantly deleterious. We estimated the fitness of 61% of all possible genotypes carrying two mutations (N2 mutants), and observed a left-shifted distribution peaking at 0.50 and 0.67 (Fig. 2C). We also estimated the fitness of 1.6% of genotypes with three mutations (N3 mutants); they exhibited a distribution with only one dominant peak at 0.5, indicating that many triple mutations completely suppress yeast growth in the en masse competition (Fig. 2D). The fitness distribution narrows and shifts further toward 0.5 in strains carrying more than three mutations (Fig. 2E).
Fitness landscapes allow predicting evolution, because sites where mutations are on average more harmful should be evolutionarily more conserved. We aligned 200 non-redundant gene sequences across the eukaryotic phylogeny (15). The percentage of sequences having the same nucleotide as yeast at a given site is negatively correlated with the average fitness upon mutation at the site (Spearman’s ρ = -0.61, P = 2×10⁻⁸; Fig. 2F). Among N1 mutants, the number of times that a mutant nucleotide appears in the 200 sequences is positively correlated with the fitness of the mutant (ρ= 0.51, P = 2×10⁻¹⁵; Fig. 2G). Furthermore, mutations observed in other eukaryotes have smaller fitness costs in yeast than those unobserved in other eukaryotes (P = 9×10⁻⁶, Mann–Whitney U test).
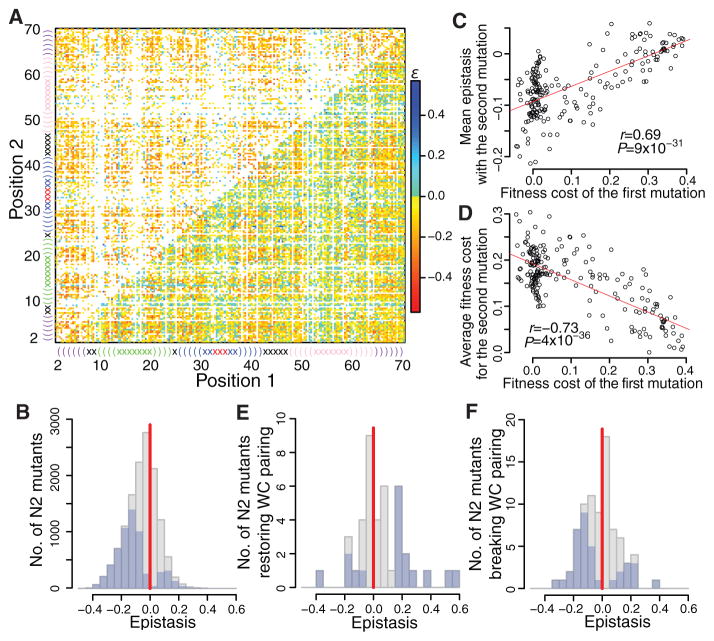
Two mutations may interact with each other, creating epistasis ε, with functional and evolutionary implications (19). We estimated ε within the tRNA gene from the fitness of 12,985 N2 mutants and 207 N1 mutants (Fig. 3A) (15). ε is negatively biased, with only 34% positive values (P < 10−300, binomial test; Figs. 3B, S7A, S8). Forty-five percent of ε values differ significantly from 0 (nominal P < 0.05, t-test based on the six replicates), among which 86% are negative (P < 10−300, binomial test; Figs. 3B, S7A, S8). Consistent with the overall negative ε, the mean fitness of N2 mutants (0.75) is lower than that predicted from N1 mutants assuming no epistasis (0.81) (Fig. 2E). Interestingly, as the first mutation becomes more deleterious, the mean epistasis between this mutation and the next mutation becomes less negative and in some cases even positive (Figs. 3C, S9), similar to between-gene epistasis involving an essential gene (20). Consequently, the larger the fitness cost of the first mutation, the smaller the mean fitness cost of the second mutation (Figs. 3D, S10). Pairwise epistasis involving three or four mutations is also negatively biased (Fig. S11). Consistently, N3 to N8 mutants all show lower average fitness than expected assuming no epistasis (Fig. 2E).
Fig. 3.
Epistasis (ρ) in fitness between point mutations in the gene is negatively biased. (A) Epistasis between point mutations. Lower-right triangle shows all pairwise epistasis (white = not estimated), while upper-left triangle shows statistically significant epistasis (white = no estimation or insignificant). secondary structure is plotted linearly. Parentheses and crosses show stem and loop sites, respectively. Same color indicates sites in the same loop/stem. Each site has three mutations. (B) Distributions of pairwise epistasis (gray) and statistically significant pairwise epistasis (blue) among 12,985 mutation pairs. (C) Mean epistasis between first and second mutations increases with the fitness cost of the first mutation. (D) Mean fitness cost of the second mutation decreases with the fitness cost of the first mutation. In (C) and (D), Pearson’s correlation (r), associated P value, and the linear regression (red) are shown. (E–F) Distributions of epistasis (gray) and statistically significant epistasis (blue) between pairs of mutations that (E) convert a Watson-Crick (WC) base pair to another WC pair or (F) break a WC pair in stems. In (B), (E), and (F), the vertical red line shows zero epistasis.
The distribution of epistasis between mutations at paired sites is expected to differ from the above general pattern, because different Watson-Crick (WC) pairs may be functionally similar (21). We estimated the fitness of 71% of all possible N2 mutants at WC paired sites. Among the 41 cases that switched from one WC pair to another, 23 (56%) have positive ε (Fig. 3E). Among the 80 N2 mutants that destroyed WC pairing, 39 (49%) showed positive ε (Fig. 3F). The ε values are more positive for each of these two groups than for N2 mutants where the two mutations do not occur at paired sites (P = 7×10⁻⁶ and 2.6×10⁻³, respectively, Mann-Whitney U test). Furthermore, εis significantly more positive in the 41 cases with restored WC pairing than the 80 cases with destroyed pairing (P = 0.04). These two trends also apply to cases with significant epistasis (corresponding P = 3×10⁻⁵, 0.01, and 0.01, respectively; Figs. 3EF, S7BC). Nevertheless, epistasis is not always positive between paired sites, likely because base pairing is not the sole function of the nucleotides at paired sites. We observed 160 cases of significant sign epistasis (15), which is of special interest because it may block potential paths for adaptation (2). We also detected ε with opposite signs in different genetic backgrounds, a high-order epistasis (Table S4).
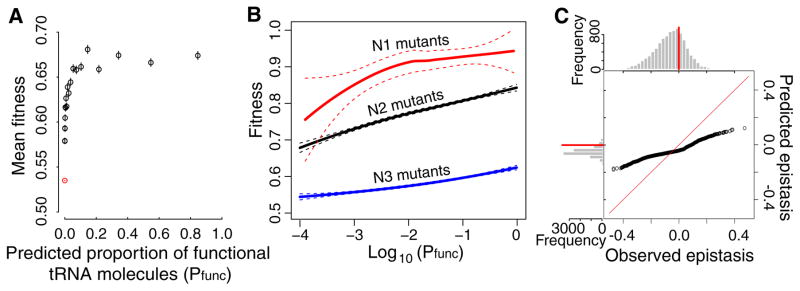
A tRNA can fold into multiple secondary structures. We computationally predicted the proportion of molecules that are potentially functional (i.e., correctly folded, no anticodon mutation) for each genotype (Pfunc). Raising Pfunc increases fitness (ρ = 0.40, P < 10−300) albeit with diminishing returns (Fig. 4A), and this correlation holds after controlling for mutation number (ρ = 0.26, 0.37, and 0.24 for N1, N2, and N3 mutants, respectively). Because computational prediction of RNA secondary structures is only moderately accurate, the Pfunc–fitness correlation demonstrates an important role of Pfunc in shaping the tRNA fitness landscape. Nonetheless, after controlling for Pfunc, mutant fitness still correlates with mutation number (ρ = -0.51, P < 10−300; see also LOESS regressions for N1, N2, and N3 mutants in Fig. 4B), suggesting that other factors also impact fitness.
Fig. 4.
folding offers a mechanistic explanation of the fitness landscape. (A) Relationship between the predicted proportion of tRNA molecules that are functional (Pfunc) for a genotype and its fitness. Genotypes (with Pfunc ≥ 10−4) are ranked by Pfunc and grouped into 20 equal-size bins; mean Pfunc and mean fitness ± SE of each bin are presented. The red dot represents all variants with Pfunc < 10−4. (B) LOESS regression curves between Pfunc and fitness for N1, N2, and N3 mutants, respectively, with dashed lines indicating 95% confidence intervals. (C) Quantile-quantile plot between epistasis predicted from Pfunc values using N1 and N2 LOESS curves and observed epistasis. The ith dot from the left shows the ith smallest predicted epistasis value (y-axis) and ith smallest observed epistasis value (x-axis). Red diagonal line shows the ideal situation of y = x. Above and left of the plot are frequency distributions of observed and predicted epistasis, respectively. Red horizontal and vertical lines indicate zero epistasis.
To investigate whether Pfunc explains epistasis, we computed epistasis using the fitness of N1 and N2 mutants predicted from their respective Pfunc–fitness regression curves (Fig. 4B), and observed a significant correlation between the predicted and observed epistasis (ρ = 0.04, P = 2.7×10⁻⁵). The weakness of this correlation is at least partly due to the fact that epistasis is computed from three fitness measurements (or predictions) and therefore associated with a considerable error. There is a similar bias in predicted epistasis toward negative values (Fig. 4C), but further analyses suggest that it probably arises from factors other than tRNA folding (15). These results regarding Pfunc and epistasis are not unexpected given that a tRNA site can be involved in multiple molecular functions (17, 18).
In summary, we described the in vivo fitness landscape of a yeast tRNA gene under a high-temperature challenge. Broadly consistent with the neutral theory, beneficial mutations are rare (1%), relative to deleterious (42%) and (nearly) neutral mutations (57%). We found widespread intragenic epistasis between mutations, consistent with studies of smaller scales (1). Intriguingly, 86% of significant epistasis is negative, indicating that the fitness cost of the second mutation is on average greater than that of the first. A bias toward negative epistasis was also observed in protein genes (7, 10, 11, 22), suggesting that this may be a general trend. Variation in fitness is partially explained by the predicted fraction of correctly folded tRNA molecules, suggesting general principles underlying complex fitness landscapes. Our tRNA variant library provides a resource in which various mechanisms contributing to its fitness landscape can be evaluated and the methodology developed here is applicable to the study of fitness landscapes of longer genomic segments including protein genes.
Supplementary Material
Acknowledgments
We thank S. Cho, W.-C. Ho, G. Kudla, and J.-R. Yang for valuable comments. This work was supported by NSF DDIG (DEB-1501788) to J.Z. and C.L. and by NIH (R01GM103232) to J.Z. The NCBI accession number for the sequencing data is PRJNA311172.
References and Notes
- 1.de Visser JA, Krug J. Nat Rev Genet. 2014;15:480. doi: 10.1038/nrg3744. [DOI] [PubMed] [Google Scholar]
- 2.Weinreich DM, Delaney NF, Depristo MA, Hartl DL. Science. 2006;312:111. doi: 10.1126/science.1123539. [DOI] [PubMed] [Google Scholar]
- 3.Lind PA, Berg OG, Andersson DI. Science. 2010;330:825. doi: 10.1126/science.1194617. [DOI] [PubMed] [Google Scholar]
- 4.Pitt JN, Ferre-D’Amare AR. Science. 2010;330:376. doi: 10.1126/science.1192001. [DOI] [PMC free article] [PubMed] [Google Scholar]
- 5.Hietpas RT, Jensen JD, Bolon DN. Proc Natl Acad Sci USA. 2011;108:7896. doi: 10.1073/pnas.1016024108. [DOI] [PMC free article] [PubMed] [Google Scholar]
- 6.Findlay GM, Boyle EA, Hause RJ, Klein JC, Shendure J. Nature. 2014;513:120. doi: 10.1038/nature13695. [DOI] [PMC free article] [PubMed] [Google Scholar]
- 7.Bank C, Hietpas RT, Jensen JD, Bolon DN. Mol Biol Evol. 2015;32:229. doi: 10.1093/molbev/msu301. [DOI] [PMC free article] [PubMed] [Google Scholar]
- 8.Guy MP, et al. Genes Dev. 2014;28:1721. doi: 10.1101/gad.245936.114. [DOI] [PMC free article] [PubMed] [Google Scholar]
- 9.Melnikov A, Rogov P, Wang L, Gnirke A, Mikkelsen TS. Nucleic Acids Res. 2014;42:e112. doi: 10.1093/nar/gku511. [DOI] [PMC free article] [PubMed] [Google Scholar]
- 10.Melamed D, Young DL, Gamble CE, Miller CR, Fields S. RNA. 2013;19:1537. doi: 10.1261/rna.040709.113. [DOI] [PMC free article] [PubMed] [Google Scholar]
- 11.Olson CA, Wu NC, Sun R. Curr Biol. 2014;24:2643. doi: 10.1016/j.cub.2014.09.072. [DOI] [PMC free article] [PubMed] [Google Scholar]
- 12.Hinkley T, et al. Nat Genet. 2011;43:487. doi: 10.1038/ng.795. [DOI] [PubMed] [Google Scholar]
- 13.Abbott JA, Francklyn CS, Robey-Bond SM. Front Genet. 2014;5:158. doi: 10.3389/fgene.2014.00158. [DOI] [PMC free article] [PubMed] [Google Scholar]
- 14.Bloom-Ackermann Z, et al. PLOS Genet. 2014;10:e1004084. doi: 10.1371/journal.pgen.1004084. [DOI] [PMC free article] [PubMed] [Google Scholar]
- 15.Materials and methods are available as supplementary materials on Science Online.
- 16.Qian W, Ma D, Xiao C, Wang Z, Zhang J. Cell Rep. 2012;2:1399. doi: 10.1016/j.celrep.2012.09.017. [DOI] [PMC free article] [PubMed] [Google Scholar]
- 17.Hiraga S, Botsios S, Donze D, Donaldson AD. Mol Biol Cell. 2012;23:2741. doi: 10.1091/mbc.E11-04-0365. [DOI] [PMC free article] [PubMed] [Google Scholar]
- 18.Phizicky EM, Hopper AK. Genes Dev. 2010;24:1832. doi: 10.1101/gad.1956510. [DOI] [PMC free article] [PubMed] [Google Scholar]
- 19.Phillips PC. Nat Rev Genet. 2008;9:855. doi: 10.1038/nrg2452. [DOI] [PMC free article] [PubMed] [Google Scholar]
- 20.He X, Qian W, Wang Z, Li Y, Zhang J. Nat Genet. 2010;42:272. doi: 10.1038/ng.524. [DOI] [PMC free article] [PubMed] [Google Scholar]
- 21.Meer MV, Kondrashov AS, Artzy-Randrup Y, Kondrashov FA. Nature. 2010;464:279. doi: 10.1038/nature08691. [DOI] [PubMed] [Google Scholar]
- 22.Bershtein S, Segal M, Bekerman R, Tokuriki N, Tawfik DS. Nature. 2006;444:929. doi: 10.1038/nature05385. [DOI] [PubMed] [Google Scholar]
- 23.Zorgo E, et al. Mol Biol Evol. 2012;29:1781. doi: 10.1093/molbev/mss019. [DOI] [PubMed] [Google Scholar]
- 24.Smith AM, et al. Genome Res. 2009;19:1836. doi: 10.1101/gr.093955.109. [DOI] [PMC free article] [PubMed] [Google Scholar]
- 25.Warringer J, et al. PLOS Genet. 2011;7:e1002111. doi: 10.1371/journal.pgen.1002111. [DOI] [PMC free article] [PubMed] [Google Scholar]
- 26.Jacquier H, et al. Proc Natl Acad Sci USA. 2013;110:13067. doi: 10.1073/pnas.1215206110. [DOI] [PMC free article] [PubMed] [Google Scholar]
- 27.Lorenz R, et al. Algorithms Mol Biol. 2011;6:26. doi: 10.1186/1748-7188-6-26. [DOI] [PMC free article] [PubMed] [Google Scholar]
Associated Data
This section collects any data citations, data availability statements, or supplementary materials included in this article.


