

Abstract
The study of equilibrium liquid crystals has led to fundamental insights into the nature of ordered materials, as well as many practical applications such as display technologies. Active nematics are a fundamentally different class of liquid crystals, which are driven away from equilibrium by the autonomous motion of their constituent rodlike particles1–4. This internally-generated activity powers the continuous creation and annihilation of topological defects, leading to complex streaming flows whose chaotic dynamics appear to destroy long-range order5–11. Here, we study these dynamics in experimental and computational realizations of active nematics. By tracking thousands of defects over centimeter distances in microtubule-based active nematics, we identify a non-equilibrium phase characterized by system-spanning orientational order of defects. This emergent order persists over hours despite defect lifetimes of only seconds. Similar dynamical structures are observed in coarse-grained simulations, suggesting that defect-ordered phases are a generic feature of active nematics.
Topological defects play important roles in diverse phenomena ranging from high-energy physics and cosmology to traditional condensed matter systems12. For instance, the spontaneous unbinding of dislocation pairs mediates the melting of 2D crystals13. Despite their usual role as centers of disorder, defects can also organize into higher-order equilibrium structures with emergent properties, such as liquid crystalline twist-grain-boundary phases and flux-line lattices in superconductors14,15. Far less is understood about the role of defects in active matter systems, which are driven away from equilibrium by the motion of their constituent particles16–24. Previous work on active nematics has demonstrated an instability at large wavelengths5 which leads to spontaneous defect nucleation and unbinding6–10. In contrast to the well-studied passive defects found in equilibrium matter, defects in active nematics are motile25, and are continuously generated and annihilated, producing a dynamical defect-riddled phase that is inherently non-equilibrium. The observed dynamics are complex and chaotic, and appear to destroy the long-range ordering of the underlying nematic. Here, by tracking thousands of defects over long times, we demonstrate that defects self-organize into a higher-order phase with broken rotational symmetry. The orientational ordering of defects spans macroscopic samples and persists for the sample lifetime of many hours, despite the lifetimes of the constituent defects being orders of magnitude shorter.
Our experimental system is comprised of micron-long stabilized microtubules (MTs), streptavidin clusters of biotin-labeled kinesin motors26 and the non-adsorbing polymer polyethylene glycol (PEG) (Fig. 1a). In a bulk suspension, PEG induces formation of MT bundles by the depletion mechanism27,28. The same interaction also depletes MTs onto a surfactant-stabilized oil-water interface. Centrifugation makes it possible to spin down all the MT bundles onto the interface, leading to the formation of a dense quasi-2D MT film which exhibits local orientational order. Each kinesin cluster binds to multiple MTs. As each motor within the cluster hydrolyzes adenosine triphosphate (ATP), it moves towards the plus end of a MT and induces inter-filament sliding29. This generates extensile mechanical stresses that drive the nematic film away from equilibrium (Fig. 1b). A biochemical regeneration system maintains a constant ATP concentration and powers the system for over 24 hours (see Supplementary Methods). We image these active nematics with both fluorescence microscopy and LC-PolScope30. LC-PolScope measures the orientation of the nematic director θ(r) with pixel resolution. It also measures the magnitude of birefringence which reveals the effective thickness of the nematic film, or retardance Δ(r) (see Supplementary Figure 4 for an extended discussion). Using a 4× objective, we observe the dynamics of the MT film over the entire field of view, corresponding to an area of 2.3×1.7 mm.
Figure 1.
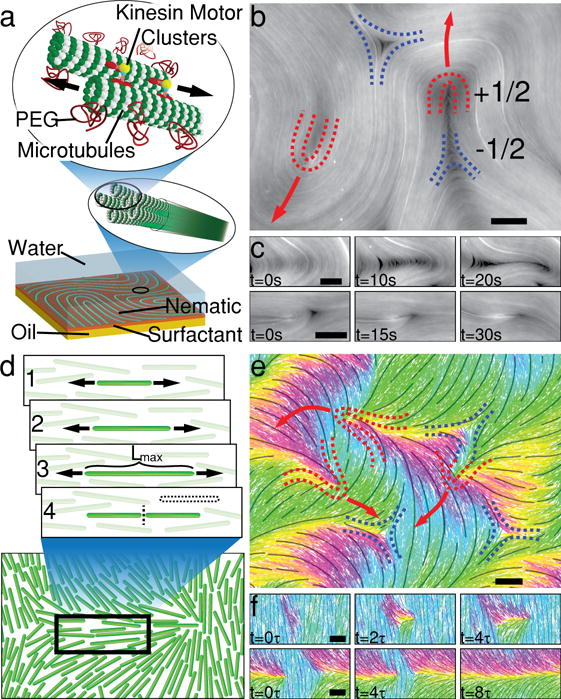
Overview of experimental and simulation systems. a, Microtubules (MTs) are bundled together by the depletion agent PEG. Kinesin clusters crosslink MTs and induce inter-filament sliding. Bundles are confined to a surfactant-stabilized oil-water interface, where they form a quasi-2D active nematic film. b, Fluorescence microscope image of a MT active nematic with defects of charge +1/2 (red) and −1/2 (blue). c, Image sequence illustrating the creation (top) and annihilation (bottom) of a defect pair. Scale bars 50μm. d, Simulation microdynamics, consisting of hard rods which grow and split, reminiscent of the extension of MT bundles. Lmax is the length at which a rod is split. e, Snapshot of simulated active nematic with marked defects. Rod colors indicate their orientations, and black streamlines guide the eye over the coarse-grained nematic field. f, Creation (top) and annihilation (bottom) events occur analogously to those in experiments. Scale bars 2Lmax.
In parallel, we have developed a tractable coarse-grained computational model. Our approach employs Brownian dynamics simulations of rigid spherocylinders which, in equilibrium, form a nematic phase31. Long-ranged hydrodynamic interactions are omitted, producing an essentially dry system. The length of each constituent rod increases at a constant rate, producing an extensile stress similar to the motor-driven extension of MT bundles (Fig. 1d). Upon reaching a pre-set maximum length, a spherocylinder is split in half and two other rods are simultaneously merged, thus keeping the total particle number fixed (see Supplementary Methods). Though inspired by the dynamics of MT bundles, this approach is not meant to quantitatively reproduce specific features of the experimental system, but simply to capture its microscopic symmetries (nematic interparticle alignment, and extensile nematic activity).
In equilibrium, nematic defects anneal to minimize free energy, eventually producing a uniformly aligned state. It is not possible to prepare an analogous state in extensile active nematics, since uniform alignment is inherently unstable to bend deformations5. These distortions grow in amplitude and produce a fracture line, terminated at one end by a defect of charge +1/2, and by a −1/2 defect at the other (Fig. 1c). The asymmetry of +1/2 defects causes motor-generated stresses to produce a net propulsive force, leading to extension of the fracture line. Above a critical length, the fracture line self-heals, leaving behind a pair of isolated, oppositely charged defects9. For experimental ATP concentration, +1/2 defects move at speeds of ~8 μm/sec. Defects are transient objects; on average, a +1/2 defect exists for 40 sec before colliding with a −1/2 defect and annihilating, leaving behind a uniformly aligned nematic region32 (Fig. 1c). The system reaches a steady state in which the rate of defect generation is balanced by the rate of annihilation (Supplementary videos 1–2). Very similar patterns of defect generation and annihilation are observed in the simulations, despite the fact that our computational model does not include hydrodynamic interactions (Fig. 1e, 1f, Supplementary videos 4–5).
We have developed algorithms that identify defect positions and orientations from either LC-PolScope images or simulation configurations, and track their temporal dynamics over the entire lifetime of either a microtubule sample or simulation (see Supplemental Information). Defect positions and orientations are determined by measuring the winding of the local director. We define the orientation of each comet-like +1/2 defect by drawing an arrow from the comet’s head to its tail (see Supplemental Information). These algorithms allow us to analyze statistically large defect populations, providing invaluable insight into their self-organization at macroscopic scales.
It has been commonly assumed that the dynamics of motile defects leads to a disordered chaotic state. However, quantitative analyses reveal that this is not the case. We find the that orientational distribution function of +1/2 defects is not flat, but exhibits two well-defined peaks, implying the existence of a higher-order dynamical phase (Fig. 2e). Although +1/2 defects are polar objects, we find that they form a nematic phase in which they are equally likely to point in either direction along the preferred axis (Fig. 2b). Furthermore, the orientational distribution function of −1/2 defects exhibits six-fold symmetry, although the strength of this order is significantly less than the nematic order of +1/2 defects. Additionally, radial distribution functions of both ±1/2 defects reveal no long-range positional order (Supplementary Fig. 9).
Figure 2.
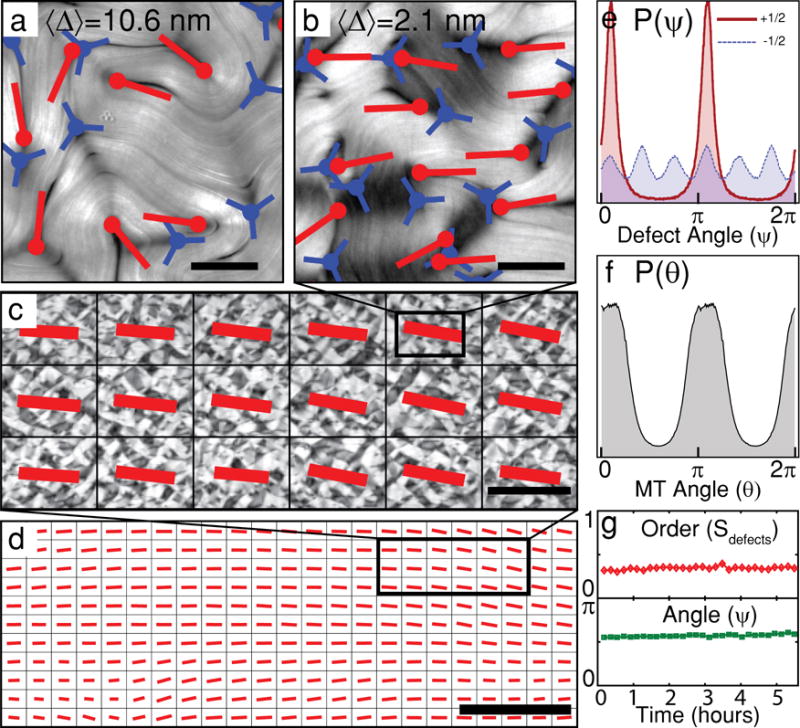
Defect-ordered phase in experiments. a, Retardance map of a thick MT film in the regime of weak defect alignment. Red and blue markers indicate locations and orientations of +1/2 and −1/2 defects. Scale bar 200μm. b, Thin MT film showing strong alignment of +1/2 defects. Scale bar 200μm. c, Orientational order in a large active nematic sample. Each red bar’s orientation and length indicates the mean direction and strength of defect alignment in one field of view. Scale bar 2mm. d, Defect alignment spans the largest samples studied (6cm × 2cm), containing ~20,000 defects. Scale bar 10mm. e, Normalized histogram of +1/2 (red) and −1/2 (blue) defect orientations, P(ψ). f, MT orientation, P(θ), for the sample shown in panels b–d. Measurements of P(θ) from 0 to π are duplicated from π to 2π. Both P(ψ) and P(θ) show strong nematic ordering. g, The preferred defect orientation (green) and magnitude of the order parameter (red) averaged over a field of view persists over the entire sample lifetime.
Next, we investigated how the orientational order of +1/2 defects persists in time and space. We find that within a single field of view (2.3×1.7 mm) the axis of defect order does not change appreciably over the entire sample lifetime (Fig. 2g). Therefore, we used a motorized x–y stage to repeatedly scan centimeter-sized samples every ten minutes, allowing us to measure long-range variations in defect ordering. In such samples we measure nearly uniform system-spanning orientational order (Fig. 2c, 2d). The largest active nematic sample analyzed (5cm × 2cm) contained ~20,000 defects, demonstrating that orientational order persists at scales larger than 100 average defect spacings (Supplementary video 3). The defect orientational order is a result of spontaneously broken symmetry, and is not strongly influenced by the sample boundaries. To demonstrate this, we have confined active nematics in a circular geometry, finding that defects form a single uniformly aligned domain, rather than aligning with the boundaries (Supplementary Fig. 1). Consistent with these observations, we additionally note that active nematics in rectangular channels do not strongly favor either the long or the short axis of the channel.
In simulations, +1/2 defects also attain system-spanning orientational order (Fig. 3b, d). However, in contrast to the nematic defect ordering observed in experiments, in the computational system defects align with polar symmetry, which leads to their net transport along the preferred direction. Possible reasons for this difference are discussed below.
Figure 3.
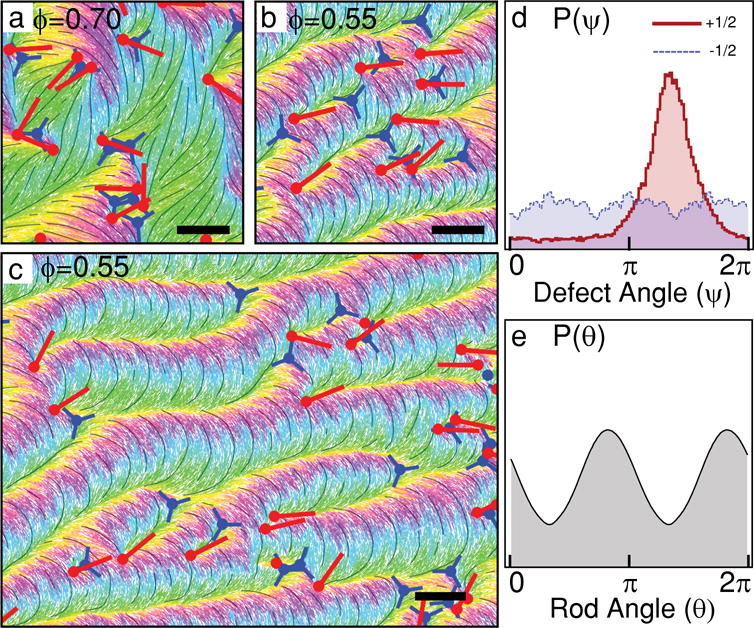
Defect-ordered phase in simulations. a, Snapshot of a high-area-fraction simulation in which +1/2 defects are not aligned. Red and blue markers indicate locations and orientations of +1/2 and −1/2 defects. Scale bar 5Lmax. b, A low-area-fraction system in which defects show flocking-like polar alignment. Scale bar 5Lmax. c, A large simulation with defects aligned over long distances. Scale bar 5Lmax. d, Normalized histogram of +1/2 (red) and −1/2 (blue) defect orientations, P(ψ). e, Rod orientations P(θ) measured in the same sample. The former shows polar ordering, while the latter exhibits nematic ordering, and the preferred axes are offset by 90 degrees. Measurements of P(θ) from 0 to π are duplicated from π to 2π.
Tuning filament density controls the strength of the emergent defect order and can even transform the system into an isotropic state. To quantify the degree of defect ordering, we measure the 2D polar and nematic order parameters, and , respectively, where ψ is the orientation of a +1/2 defect and is the mean orientation of all defects in a given system configuration. We find that thin nematic films (low MT concentration, hence low retardance) have high defect nematic order, S; increasing the film thickness (high MT concentration, high retardance) decreases the magnitude of S to the point where defects become effectively isotropic (Fig. 2a–b, 4a). A similar effect is observed in simulations when varying the particle density (area fraction); at the lowest densities studied, defects have relatively strong alignment, P. Increasing density induces a transition to an isotropic state (Figs. 3a–b, 4b). Spatial correlation functions of these order parameters demonstrate that in all experimental and computational systems with measurable defect ordering, defect correlations are system-spanning (Fig. 4c, 4d). Though the density of material is an easily tuneable control parameter, it influences many material properties, including the rate of energy dissipation, elastic constants, and the efficiency with which active stresses are transmitted through the material, all of which influence emergent properties of the system. For example, defect density in experiments decreases weakly with the MT film thickness, while in simulations it increases with rod density (Supplementary Fig. 2). Additional studies are required to relate the microscopic parameters to defect alignment.
Figure 4.
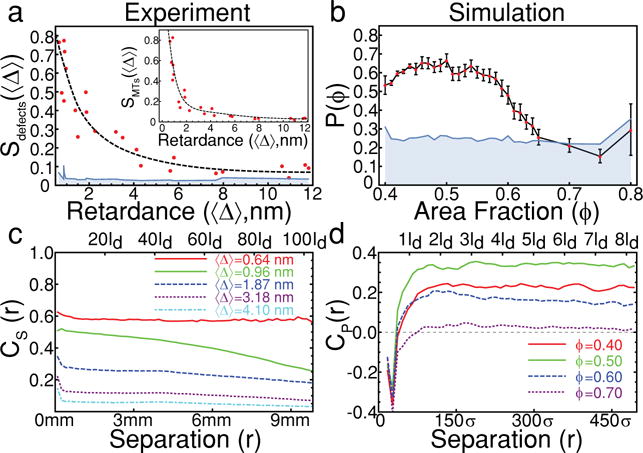
Quantitative measurements of defect alignment. a, The defect nematic order parameter, S, decreases as a function of the MT film’s retardance. The blue shaded region represents the “noise floor” (see Supplementary Information). Inset: The nematic order parameter of the underlying MT filaments, S, also decreases with the MT film’s retardance. b, The polar defect order parameter, P, showing a transition between ordered and isotropic regimes as a function of particle density. c, The two-point nematic correlation of defect orientation CS(r) = 〈cos2(ψ(r) − ψ(0))〉 in MT films, which shows that orientational order persists over long distances. ld indicates the mean inter-defect spacing. The magnitude of ordering falls as retardance increases. d, The polar correlation of defect orientation CP(r) = 〈cos(ψ(r) − ψ(0))〉 in simulations. σ indicates the width of a single rod (see Supplementary Information). At short ranges, defects tend to point in opposing directions, but beyond the first shell of neighbors, defects are likely to be aligned in the same direction.
In both experiment and simulation, we find that defect-ordered systems also display nematic alignment of the constituent filaments (Fig. 2f, 3e). The existence of such ordering in the presence of large numbers of defects contrasts sharply with equilibrium systems, in which defects reduce or eliminate nematic order. Moreover, the ordering of both defects and constituent rods decreases with system density (Fig 4a–b, Supplementary Fig. 6), unlike equilibrium lyotropic liquid crystals, in which order increases with density. These contrasts suggest that the orientational order in active nematics is driven by non-equilibrium dynamics, and cannot be accounted for purely by equilibrium-like alignment of the underlying material.
Although +1/2 defects are preferentially created perpendicular to the local nematic field32, they do not keep this orientation but are continually reoriented by their interactions with the local environment. A +1/2 defect moving through a distorted nematic field will follow a curved path, always remaining perpendicular to the field in front of it, leading to complex meandering trajectories. Simultaneously, the passage of a +1/2 defect leaves behind a distortion in which the nematic field is rotated 90° from its previous orientation, creating a topological structure which cannot relax except by the passage of additional defects. These distortions strongly affect defect motion even after the defect which formed them has moved away or been annihilated. We therefore anticipate that a theory capable of explaining the origin of defect ordering will need to simultaneously account for both the defects and the underlying field.
Since our simulation model mimics the microscopic symmetries of the experiments, it is notable that the two systems exhibit different emergent symmetries. In experiments, +1/2 defects align with nematic symmetry, and the direction of defect ordering is aligned with the average MT direction. In simulations, defects align with polar symmetry, and the underlying rods are, on average, offset 90° from the defects. A number of distinctions between the two systems may account for these differences. First, analysis of the distributions of bend and splay distortions suggests that the simulation model has a much higher bend modulus (see Supplementary Methods). Second, the experimental system is subjected to hard-wall boundary conditions, which preclude global polar ordering of motile defects. Third, the simulation model is dry, whereas the experiments experience hydrodynamic interactions. Finally, simulations investigate a true 2D system, while in experiments MTs can pass over each other. Further studies will be required to disentangle these effects.
In summary, our work demonstrates that transient, short-lived motile defects can form higher-order dynamical phases with persistent orientational order. The existence of such phases in both the experimental and computational systems suggests that this is a generic feature of active nematics.
Supplementary Material
Acknowledgments
The experimental portion of this study was primarily supported by Department of Energy, Office of Basic Energy Sciences through award DE-SC0010432TDD (SJD and ZD). The computational portion of this work (GSR, MFH, AB) was supported by NSF-MRSEC-1206146 and NSF-DMR-1149266. Computational resources were provided by the NSF through XSEDE (Stampede and Trestles) and the Brandeis HPCC, which is partially supported by the Brandeis MRSEC (NSF-MRSEC-1206146). We acknowledge use of a MRSEC optical facility that is supported by NSF-MRSEC-1206146.
Footnotes
Contributions SJD and ZD conceived the experiments and GSR, AB and MFH conceived the simulations. SJD acquired experimental data. GSR performed computer simulations. SJD and GSR analyzed defect dynamics. SJD, GSR, AB, MFH and ZD wrote the paper. All authors revised the manuscript.
Competing Interests The authors declare that they have no competing financial interests.
References
- 1.Narayan V, Ramaswamy S, Menon N. Long-lived giant number fluctuations in a swarming granular nematic. Science. 2007;317:105. doi: 10.1126/science.1140414. [DOI] [PubMed] [Google Scholar]
- 2.Duclos G, Garcia S, Yevick HG, Silberzan P. Perfect nematic order in confined monolayers of spindle-shaped cells. Soft matter. 2014;10:2346. doi: 10.1039/c3sm52323c. [DOI] [PubMed] [Google Scholar]
- 3.Zhou S, Sokolov A, Lavrentovich OD, Aranson IS. Living liquid crystals. Proceedings of the National Academy of Sciences. 2014;111:1265. doi: 10.1073/pnas.1321926111. [DOI] [PMC free article] [PubMed] [Google Scholar]
- 4.Brugués J, Needleman D. Physical basis of spindle self-organization. Proceedings of the National Academy of Sciences. 2014;111:18496. doi: 10.1073/pnas.1409404111. [DOI] [PMC free article] [PubMed] [Google Scholar]
- 5.Aditi Simha R, Ramaswamy S. Hydrodynamic Fluctuations and Instabilities in Ordered Suspensions of Self-Propelled Particles. Physical Review Letters. 2002;89:058101. doi: 10.1103/PhysRevLett.89.058101. [DOI] [PubMed] [Google Scholar]
- 6.Sanchez T, Chen DTN, DeCamp SJ, Heymann M, Dogic Z. Spontaneous motion in hierarchically assembled active matter. Nature. 2012;491:431. doi: 10.1038/nature11591. [DOI] [PMC free article] [PubMed] [Google Scholar]
- 7.Giomi L, Bowick MJ, Ma X, Marchetti MC. Defect Annihilation and Proliferation in Active Nematics. Physical Review Letters. 2013;110:228101. doi: 10.1103/PhysRevLett.110.228101. [DOI] [PubMed] [Google Scholar]
- 8.Thampi SP, Golestanian R, Yeomans JM. Velocity Correlations in an Active Nematic. Physical Review Letters. 2013;111:118101. doi: 10.1103/PhysRevLett.111.118101. [DOI] [PubMed] [Google Scholar]
- 9.Thampi SP, Golestanian R, Yeomans JM. Instabilities and topological defects in active nematics. EPL (Europhysics Letters) 2014;105:18001. [Google Scholar]
- 10.Gao T, Blackwell R, Glaser MA, Betterton M, Shelley MJ. Multiscale polar theory of microtubule and motor-protein assemblies. Physical Review Letters. 2015;114:048101. doi: 10.1103/PhysRevLett.114.048101. [DOI] [PMC free article] [PubMed] [Google Scholar]
- 11.Ngo S, et al. Large-Scale Chaos and Fluctuations in Active Nematics. Physical Review Letters. 2014;113:038302. doi: 10.1103/PhysRevLett.113.038302. [DOI] [PubMed] [Google Scholar]
- 12.Chuang I, Durrer R, Turok N, Yurke B. Cosmology in the laboratory: defect dynamics in liquid crystals. Science (New York, NY) 1991;251:1336. doi: 10.1126/science.251.4999.1336. [DOI] [PubMed] [Google Scholar]
- 13.Nelson D, Halperin B. Dislocation-mediated melting in two dimensions. Physical Review B. 1979;19:2457. [Google Scholar]
- 14.Renn SR, Lubensky TC. Abrikosov dislocation lattice in a model of the cholesteric to smectic-A transition. Physical Review A. 1988;38:2132. doi: 10.1103/physreva.38.2132. [DOI] [PubMed] [Google Scholar]
- 15.Brandt EH. The Flux-Line Lattice in Superconductors. Reports on Progress in Physics. 1995;58:1465. [Google Scholar]
- 16.Toner J, Tu Y. Long-Range Order in a Two-Dimensional Dynamical XY Model: How Birds Fly Together. Physical Review Letters. 1995;75:4326. doi: 10.1103/PhysRevLett.75.4326. [DOI] [PubMed] [Google Scholar]
- 17.Toner J, Tu Y, Ramaswamy S. Hydrodynamics and phases of flocks. Annals of Physics. 2005;318:170. [Google Scholar]
- 18.Vicsek T, Zafeiris A. Collective motion. Physics Reports. 2012;517:71. [Google Scholar]
- 19.Marchetti MC, et al. Hydrodynamics of soft active matter. Reviews of Modern Physics. 2013;85:1143. [Google Scholar]
- 20.Palacci J, Sacanna S, Steinberg AP, Pine DJ, Chaikin PM. Living Crystals of Light-Activated Colloidal Surfers. Science. 2013;339:936. doi: 10.1126/science.1230020. [DOI] [PubMed] [Google Scholar]
- 21.Redner GS, Hagan MF, Baskaran A. Structure and Dynamics of a Phase-Separating Active Colloidal Fluid. Physical Review Letters. 2013;110:055701. doi: 10.1103/PhysRevLett.110.055701. [DOI] [PubMed] [Google Scholar]
- 22.Weber CA, Bock C, Frey E. Defect-mediated phase transitions in active soft matter. Physical Review Letters. 2014;112:168301. doi: 10.1103/PhysRevLett.112.168301. [DOI] [PubMed] [Google Scholar]
- 23.Wensink HH, et al. Meso-scale turbulence in living fluids. Proceedings of the National Academy of Sciences. 2012;109:14308. doi: 10.1073/pnas.1202032109. [DOI] [PMC free article] [PubMed] [Google Scholar]
- 24.Tjhung E, Marenduzzo D, Cates ME. Spontaneous symmetry breaking in active droplets provides a generic route to motility. Proceedings of the National Academy of Sciences. 2012;109:12381. doi: 10.1073/pnas.1200843109. [DOI] [PMC free article] [PubMed] [Google Scholar]
- 25.Keber FC, et al. Topology and dynamics of active nematic vesicles. Science. 2014;345:1135. doi: 10.1126/science.1254784. [DOI] [PMC free article] [PubMed] [Google Scholar]
- 26.Nédélec FJ, Surrey T, Maggs AC, Leibler S. Self-organization of microtubules and motors. Nature. 1997;389:305. doi: 10.1038/38532. [DOI] [PubMed] [Google Scholar]
- 27.Needleman DJ, et al. Synchrotron X-ray diffraction study of microtubules buckling and bundling under osmotic stress: A probe of interprotofilament interactions. Physical Review Letters. 2004;93 doi: 10.1103/PhysRevLett.93.198104. [DOI] [PubMed] [Google Scholar]
- 28.Hilitski F, et al. Measuring Cohesion between Macromolecular Filaments One Pair at a Time: Depletion-Induced Microtubule Bundling. Physical Review Letters. 2015;114:138102. doi: 10.1103/PhysRevLett.114.138102. [DOI] [PubMed] [Google Scholar]
- 29.Hentrich C, Surrey T. Microtubule organization by the antagonistic mitotic motors kinesin-5 and kinesin-14. Journal of Cell Biology. 2010;189:465. doi: 10.1083/jcb.200910125. [DOI] [PMC free article] [PubMed] [Google Scholar]
- 30.Shribak M, Oldenbourg R. Techniques for Fast and Sensitive Measurements of Two-Dimensional Birefringence Distributions. Applied Optics. 2003;42:3009. doi: 10.1364/ao.42.003009. [DOI] [PubMed] [Google Scholar]
- 31.Bates MA, Frenkel D. Phase behavior of two-dimensional hard rod fluids. The Journal of Chemical Physics. 2000;112:10034. [Google Scholar]
- 32.Shi XQ, Ma YQ. Topological structure dynamics revealing collective evolution in active nematics. Nature communications. 2013;4:3013. doi: 10.1038/ncomms4013. [DOI] [PMC free article] [PubMed] [Google Scholar]
Associated Data
This section collects any data citations, data availability statements, or supplementary materials included in this article.