

Abstract
Background
Recent antimicrobial resistance data are lacking from inpatient oncology settings to guide infection prophylaxis and treatment recommendations. We describe central line-associated bloodstream infection (CLABSI) pathogens and antimicrobial resistance patterns reported from oncology locations to the CDC’s National Healthcare Safety Network (NHSN).
Methods
CLABSI data reported to NHSN from 2009–2012 from adult inpatient oncology locations were compared to data from non-oncology adult locations within the same hospitals. Pathogen profile, antimicrobial resistance rates, and CLABSI incidence rates/per 1000 central line-days were calculated. CLABSI incidence rates were compared using Poisson regression.
Results
During 2009–2012, 4654 CLABSIs were reported to NHSN from 299 adult oncology units. The most common organisms causing CLABSI in oncology locations were coagulase-negative staphylococci (16.9%), Escherichia coli (11.8%), and Enterococcus faecium (11.4%). Fluoroquinolone resistance was more common among E. coli CLABSI in oncology than non-oncology locations (56.5% vs 41.5% of isolates tested, P<0.0001) and increased significantly from 2009–2010 to 2011–2012 (49.5% vs 60.4%, P=0.01). Furthermore, rates of CLABSI were significantly higher in oncology compared to non-oncology locations for fluoroquinolone-resistant E. coli (rate ratio: 7.37, 95% confidence interval, 6.20–8.76) and vancomycin-resistant E. faecium (rate ratio: 2.27, 95% confidence interval, 2.03–2.53). However, resistance rates for some organisms, such as Klebsiella spp. and Pseudomonas aeruginosa, were lower in oncology than in non-oncology locations.
Conclusions
Antimicrobial-resistant E. coli and E. faecium have become significant pathogens in oncology. Practices for antimicrobial prophylaxis and empiric antimicrobial therapy should be regularly assessed in conjunction with contemporary antimicrobial resistance data.
Keywords: Oncology, bloodstream infection, antimicrobial resistance, antimicrobial prophylaxis
Background
Bloodstream infections, estimated to occur in 10–25% of oncology patients, are a substantial cause of serious morbidity in this patient population [1]. Neutropenia and gastrointestinal mucosal damage resulting from cytotoxic cancer therapies, as well as the frequent use of central venous catheters, are significant risk factors for bloodstream infections originating from endogenous colonic and/or skin flora [2,3]. Preventing bloodstream infections and associated complications is therefore a critical patient safety issue and has motivated the creation of clinical practice guidelines for antibiotic prophylaxis and empiric treatment of neutropenic cancer patients with fever [1].
These guidelines refer to nationwide epidemiologic data to direct specific antimicrobial regimens towards the most common pathogens isolates from in oncology patients [1,4]. However, the referenced data are from over 15 years ago, and there has since been no other large-scale survey of cancer-associated bloodstream infections in the United States. [4]. In the last 10–15 years, the landscape of antimicrobial resistance has changed substantially for all patient care in the United States. Methicillin-resistant Staphylococcus aureus emerged as a significant pathogen in the community; and resistant gram-negative organisms, including extended spectrum β-lactamase- (ESBL) producing, carbapenem-resistant and fluoroquinolone-resistant Enterobacteriaceae are increasingly viewed as major threats [5–9].
In addition to these overall trends in antimicrobial resistance, oncology patient populations might be uniquely and more severely affected by emerging antimicrobial-resistant threats. For example, although prophylactic use of fluoroquinolones in high-risk neutropenic patients has been reported to decrease bloodstream infections [10], hospitalizations [11], and mortality [12], and has been recommended in professional society guidelines [1,13], significant concerns have been raised about selection of antimicrobial-resistant organisms in conjunction with this practice [14,15]. Reports from single centers have reported increases in resistance among gram-negative pathogens associated with fluoroquinolone prophylaxis [16–18], but it is unknown how widespread fluoroquinolone resistance is across oncology inpatient care settings or whether emerging resistance patterns observed in oncology units differ from those in other hospital locations in the United States.
We analyzed data reported from oncology patient care locations in short-stay acute care hospitals to the Centers for Disease Control and Prevention’s National Healthcare Safety Network (NHSN) to describe recent epidemiology of pathogens causing bloodstream infections and associated antimicrobial resistance.
Methods
NHSN receives healthcare-associated infection reports from healthcare facilities in the United States and has been described previously [19]. During the time period these data were reported, an infection was considered healthcare-associated for reporting purposes if there was no evidence that it was present or incubating at the time of admission. Bloodstream infections were defined by either (1) a positive blood culture growing a recognized pathogen (e.g., Staphylococcus aureus, Escherichia coli); or (2) at least two positive cultures (from separate blood draws collected no more than 2 days apart) growing a common commensal organism (e.g., coagulase-negative staphylococci, viridans group streptococci) with signs/symptoms consistent with a bloodstream infection: fever, chills or hypotension (any patient); or hypothermia, apnea, or bradycardia (infants only). Primary bloodstream infections are bloodstream infection events without another primary source of infection (as defined by NHSN criteria). Central line-associated bloodstream infections (CLABSIs) were primary bloodstream infections occurring in patients with central line in place at the time of infection or removed within the 48 hours before, without a minimum duration that the central line had to have been in place.
Hospitals reporting CLABSI data submit the date of the CLABSI event, type of inpatient unit in which the event occurred, up to three organisms associated with the CLABSI, and results of antimicrobial susceptibility testing performed by the hospital laboratory. For inpatient units where CLABSI surveillance is being performed, hospitals also report monthly the total number of inpatient-days in the unit and the number of inpatient-days for which a patient had at least one central line in place (central line-days) [20]. In oncology units only, central line-days can be reported as temporary vs permanent central line-days. To facilitate comparisons between oncology and other units, in this analysis temporary and permanent central line-days were pooled together.
We analyzed all 2009–2012 NHSN CLABSI data reported from adult inpatient units of acute care hospitals. NHSN locations are classified by hospital staff as an oncology location type if the description matches at least 80% of a typical patient population in that location [21]. In 2013, NHSN oncology location types were categorized as oncology critical care, oncology step-down, hematology/oncology ward, hematopoietic stem cell transplant ward, leukemia ward, leukemia/lymphoma ward, and solid tumor ward locations, and these labels were also retrospectively applied to data previously reported to NHSN; we refer to these location types together as “oncology” in this analysis. To provide context for our results, we compared CLABSI data from oncology units to CLABSI data from non-oncology inpatient units (i.e., wards, critical care units, and step-down units) within facilities that reported CLABSI data from at least one oncology location during 2009–2012. Frequency of organisms causing CLABSI, patterns of antimicrobial resistance among those organisms, and CLABSI incidence rates were analyzed.
Antimicrobial resistance patterns among CLABSI were analyzed using published interim standard definitions [19,22]. Resistance to extended-spectrum cephalosporins was defined as nonsusceptibility (i.e., testing intermediate or resistant) to ceftazidime, cefepime, ceftriaxone, or cefotaxime (Enterobacteriaceae) or to ceftazidime or cefepime (Pseudomonas aeruginosa). Fluoroquinolone resistance was defined as nonsusceptibility to ciprofloxacin or levofloxacin (P. aeruginosa) or to ciprofloxacin, levofloxacin, or moxifloxacin (Enterobacteriaceae). Aminoglycoside resistance was defined as nonsusceptibility to amikacin, gentamicin, or tobramycin. In this analysis, carbapenem resistance was defined as nonsusceptibility to imipenem, meropenem, or doripenem. For P. aeruginosa isolates, multidrug resistance was defined as nonsusceptibility to at least one drug in three of the five following antimicrobial groups: piperacillin or piperacillin/tazobactam, extended-spectrum cephalosporins (cefepime or ceftazidime), fluoroquinolones (ciprofloxacin or levofloxacin), aminoglycosides, and carbapenems. For Enterobacteriaceae, multidrug resistance was defined as nonsusceptibility to at least one drug in three of the five following groups: piperacillin or piperacillin/tazobactam, extended-spectrum cephalosporins (ceftazidime, cefepime, ceftriaxone, or cefotaxime), fluoroquinolones (ciprofloxacin, levofloxacin, or moxifloxacin), aminoglycosides, and carbapenems.
Statistical analyses were performed with SAS software version 9.3 (SAS Institute Inc., Cary, NC). Proportions were compared with χ2 or Fisher’s exact tests. Incidence rates of CLABSI per 1000 central-line days were calculated as (number of CLABSI)/(number of central line-days) × 1000. For some CLABSI, antimicrobial susceptibility results were not available for every pathogen/antimicrobial combination of interest. Accordingly, to calculate CLABSI incidence rates for specific antimicrobial-resistant pathogens, for each CLABSI pathogen of interest we multiplied the proportion resistant out of those tested (i.e., data available in NHSN) by the total number of CLABSI associated with that pathogen (including those without available antimicrobial susceptibility results) to generate an estimate for number of CLABSI due to the resistant organism. CLABSI incidence rate ratios and rate differences were assessed using Poisson regression. Statistical significance was determined at a P value of ≤0.05.
Results
General description
During 2009–2012, 183 hospitals reported 4654 CLABSIs to NHSN from 299 adult oncology units over 3,843,442 inpatient-days. The extent of CLABSI reporting increased from 90 oncology locations providing data in 2009 to 256 locations in 2012. Most hospitals submitting oncology CLABSIs data (94.0%) were general acute care hospitals (Table 1); 246 (82.3%) of the oncology locations reported at least 12 months of CLABSI data. Among CLABSIs reported from adult inpatient oncology locations, almost all occurred in either general hematology/oncology (55.7% of CLABSI) or hematopoietic stem cell transplant wards (40.3% of CLABSI).
Table 1.
Characteristics of hospitals and inpatient locations reporting central line-associated bloodstream infection (CLABSI) data from inpatient oncology units
| Hospital type | N (%) (total=183 hospitals) |
|---|---|
| General hospital | 172 (94.0) |
| Oncology hospital | 10 (5.5) |
| Women’s hospital | 1 (0.5) |
|
| |
| Inpatient location type | N (%) (total=299 inpatient locations) |
|
| |
| General hematology/oncology | 215 (71.9) |
| Hematopoietic stem cell transplant | 72 (24.1) |
| Solid tumor oncology ward | 6 (2.0) |
| Leukemia/lymphoma ward | 3 (1.0) |
| Othera | 3 (1.0) |
Includes oncology step-down, leukemia ward, and oncology critical care units
Pathogens causing CLABSIs
Of CLABSIs reported from oncology locations, 4191 (90.1%) were monomicrobial (57.5% gram-positive, 35.1% gram-negative, 7.0% fungal, and 0.4% other). Candida spp. caused most fungal CLABSIs (90.8%).
From both oncology and non-oncology locations, coagulase-negative staphylococci were the most common CLABSI organisms reported (Table 2). However, the organism profile of CLABSIs from oncology locations differed from non-oncology locations in other respects. For example, coagulase-negative staphylococci, S. aureus, non-albicans Candida spp., and Enterococcus faecalis, the four most common organisms from non-oncology locations, comprised only 35% of organisms from oncology locations but 47% of organisms from non-oncology locations (P<0.0001). In contrast, Escherichia coli, E. faecium, and viridans group streptococci accounted for 29% of organisms from oncology locations but only 12% of organisms from non-oncology locations (P<0.0001).
Table 2.
Most common organisms reported among central line-associated bloodstream infections (CLABSI) reported to the National Healthcare Safety Network (NHSN) from oncology locations, compared to those reported from non-oncology inpatient locations, 2009–2012
| Rank | Organism | Oncology (n=5162 organisms) |
Non-oncologya (n=13,608 organisms) |
||
|---|---|---|---|---|---|
| No | % | No. | % | ||
| 1 | Coagulase-negative staphylococcus | 870 | 16.9 | 2301 | 16.9 |
| 2 | Escherichia coli | 607 | 11.8 | 494 | 3.6 |
| 3 | Enterococcus faecium | 588 | 11.4 | 1090 | 8.0 |
| 4 | Staphylococus aureus | 518 | 10.0 | 1685 | 12.4 |
| 5 | Klebsiella pneumoniae/oxytoca | 464 | 9.0 | 1070 | 7.9 |
| 6 | Viridans group streptococcusb | 291 | 5.6 | 99 | 0.7 |
| 7 | Pseudomonas aeruginosa | 279 | 5.4 | 517 | 3.8 |
| 8 | Non-albicans Candida spp. | 228 | 4.4 | 1253 | 9.2 |
| 9 | E. faecalis | 214 | 4.2 | 1204 | 8.9 |
| 10 | Enterobacter spp. | 161 | 3.1 | 681 | 5.0 |
| 11 | Enterococcus spp.c | 125 | 2.4 | 312 | 2.3 |
| 12 | Streptococcus spp.d | 124 | 2.4 | 144 | 1.1 |
| 13 | Candida albicans | 106 | 2.1 | 941 | 6.9 |
| 14 | Stenotrophomonas spp. | 61 | 1.2 | 129 | 1.0 |
| 15 | Serratia spp. | 39 | 0.8 | 352 | 2.6 |
|
| |||||
| Other | 487 | 9.4 | 1336 | 9.8 | |
Non-oncology ward, step-down, and critical care locations from hospitals that reported oncology CLABSI data to NHSN during 2009–2012
Not among 15 most common organisms in non-oncology group
Not faecalis/faecium, or not specified
Not viridans group
Antimicrobial resistance
Aggregated across 2009–2012, antimicrobial susceptibility testing results were available for >70% of CLABSIs for most pathogen/resistance class combinations assessed (Table 3). In oncology locations, the highest overall prevalence of antimicrobial resistance were found in E. faecium (82.5% vancomycin-resistant), E. coli (56.5% fluoroquinolone-resistant), and S. aureus (45.6% methicillin-resistant). Carbapenem resistance was uncommon among E. coli and Klebsiella spp. (0.4% and 4.6%, respectively). Only 28.9% of viridans group streptococci had susceptibility information reported for penicillin. Of these, 62.6% were reported susceptible, 28.1% intermediate, and 9.3% resistant.
Table 3.
Percentage of selected central line-associated bloodstream infection pathogens resistant to selected antimicrobial agents in oncology versus non-oncology inpatient locations, National Healthcare Safety Network (NHSN), 2009–2012
| Pathogen, antimicrobial resistance class | Oncology locations (n=5162 organisms) | Non-oncology locationsa (n=13,608 organisms) | P | ||||
|---|---|---|---|---|---|---|---|
|
| |||||||
| No. isolates reported | No. tested | Resistance, % | No. isolates reported | No. tested | Resistance, % | ||
| Staphylococcus aureus | 518 | 1685 | |||||
| OX/METH | 471 | 45.6 | 1549 | 57.0 | <0.0001 | ||
| Enterococcus faecium | 588 | 1090 | |||||
| VAN | 565 | 82.5 | 1060 | 85.8 | 0.08 | ||
| Enterococcus faecalis | 214 | 1204 | |||||
| VAN | 205 | 8.8 | 1113 | 8.0 | 0.71 | ||
| Klebsiella pneumoniae/oxytoca | 464 | 1070 | |||||
| ESC | 413 | 13.3 | 906 | 25.5 | <0.0001 | ||
| FQ | 440 | 10.9 | 993 | 21.5 | <0.0001 | ||
| Carbapenems | 390 | 4.6 | 798 | 9.1 | 0.007 | ||
| MDR | 425 | 7.1 | 913 | 16.4 | <0.0001 | ||
| Escherichia coli | 607 | 494 | |||||
| ESC | 547 | 19.0 | 426 | 16.4 | 0.30 | ||
| FQ | 582 | 56.5 | 465 | 41.5 | <0.0001 | ||
| Carbapenems | 497 | 0.4 | 358 | 0.8 | 0.66 | ||
| MDR | 556 | 11.7 | 441 | 8.2 | 0.07 | ||
| Enterobacter spp. | 161 | 681 | |||||
| ESC | 141 | 36.2 | 634 | 34.9 | 0.77 | ||
| Carbapenems | 132 | 3.8 | 506 | 4.0 | 0.92 | ||
| MDR | 143 | 7.7 | 616 | 6.8 | 0.71 | ||
| Pseudomonas aeruginosa | 279 | 517 | |||||
| AMINOS | 235 | 8.1 | 437 | 14.4 | 0.02 | ||
| ESC | 266 | 14.3 | 491 | 23.8 | 0.002 | ||
| FQ | 271 | 25.1 | 495 | 29.9 | 0.16 | ||
| Carbapenems | 250 | 19.6 | 437 | 26.1 | 0.08 | ||
| PIP/PIPTAZ | 183 | 7.7 | 406 | 18.0 | 0.001 | ||
| MDR | 268 | 9.7 | 490 | 17.6 | 0.004 | ||
| Candida albicans | 106 | 941 | |||||
| FLUCO | 15 | 6.7 | 141 | 3.5 | 0.46 | ||
| Non-albicans Candida spp. | 228 | 1253 | |||||
| FLUCO | 33 | 24.2 | 192 | 14.6 | 0.16 | ||
OX/METH, oxacillin/methicillin resistance; VAN, vancomycin resistance; ESC, extended-spectrum cephalosporin resistance;; FQ, fluoroquinolone resistance; MDR, multidrug resistance; AMINOS, aminoglycoside resistance; PIP/PIPTAZ, resistance to piperacillin or piperacillin/tazobactam; FLUCO, fluconazole resistance. Definitions for resistance classes can be found in the methods.
Non-oncology ward, step-down, and critical care locations from hospitals reporting oncology CLABSI data to NHSN during 2009–2012
Compared to non-oncology locations, some organisms implicated in CLABSIs demonstrated increased resistance, some less resistance, and others similar levels of resistance in oncology (Table 3). For example, resistance for E. faecium was similarly high between oncology and non-oncology, whereas fluoroquinolone resistance and multidrug resistance in E. coli were more common in oncology. In contrast, resistance in S. aureus, Klebsiella spp. and P. aeruginosa was lower in oncology locations compared to non-oncology locations.
The highest incidence of CLABSIs from drug-resistant organisms in oncology occurred for vancomycin-resistant E. faecium (0.22 CLABSI/1000 central line-days), fluoroquinolone-resistant E. coli (0.16 CLABSI/1000 central line-days), and methicillin-resistant S. aureus (0.11 CLABSI/1000 central line-days) (Figure 1). Incidence was significantly higher in oncology than in non-oncology locations for vancomycin-resistant E. faecium (rate ratio: 2.27, 95% confidence interval, 2.03–2.53) and fluoroquinolone-resistant E. coli CLABSIs (rate ratio: 7.37, 95% confidence interval, 6.20–8.76) but not for methicillin-resistant S. aureus CLABSI (rate ratio: 1.08, 95% confidence interval, 0.94–1.24). The combined pooled mean CLABSI rate due to the resistant pathogens in Figure 1 was higher in oncology than outside oncology (rate difference: 0.29/1000 central line-days, 95% confidence interval, 0.26–0.32/1000 central line-days). Almost all (89.1%) of the difference could explained by resistant E. coli and E. faecium.
Figure 1.
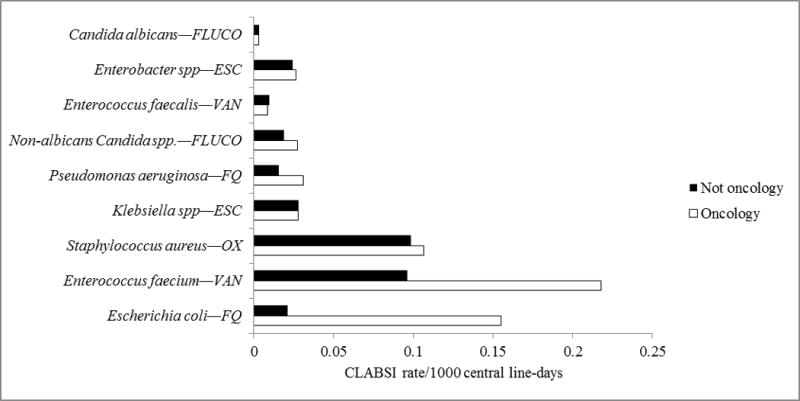
Incidence rates of central line-associated bloodstream infections (CLABSIs) from selected drug-resistant organisms reported to the National Healthcare Safety Network (NHSN) from oncology and non-oncology locations.
Among most of the major CLABSI pathogens in oncology locations, resistance did not change significantly over time. The only pathogen with a significant temporal resistance trend was E. coli, for which the percentage resistant to fluoroquinolones increased from 49.5% in 2009–2010 to 60.4% in 2011–2012 (P=0.01, data not shown).
Discussion
This is the first nationwide evaluation of pathogen patterns and antimicrobial trends among bloodstream infections from a hospitalized oncology patient population in over a decade. Our analysis shows that fluoroquinolone-resistant E. coli and vancomycin-resistant E. faecium are common antimicrobial-resistant pathogens in adult inpatient oncology locations, particularly when compared to non-oncology locations. Furthermore, fluoroquinolone resistance in E. coli has increased significantly during recent years in oncology settings. These findings are of concern given that fluoroquinolone-resistant E. coli infections are associated with increased mortality in oncology patients [23]. Indeed, the impact of growing antimicrobial resistance in oncology has been highlighted recently [24]. Contemporary data regarding the prevalence of resistant pathogens could better define this impact moving forward.
We do not have data on the use of fluoroquinolone prophylaxis in oncology units reporting CLABSI data to NHSN, but use of specific antimicrobials in the care of oncology patients could contribute substantially to the resistance patterns we report here. Our results are consistent with reports from single-center studies describing increases in fluoroquinolone-resistant organisms with adoption of fluoroquinolone prophylaxis. Given that fluoroquinolone use has also been associated with vancomycin-resistant Enterococcus colonization and infection [25–27], fluoroquinolone prophylaxis might also be contributing to the prominence of ancomycin-resistant enterococci as CLABSI pathogens in oncology patients. In reports of the initial studies demonstrating benefits for fluoroquinolone prophylaxis, investigators also cautioned that continued monitoring for development of resistant organisms was needed [10–12]. However, it is unknown what level of resistance would nullify the benefits of prophylaxis. This will need clarification in the near future if current trends continue. Indeed, some centers have elected to discontinue broad fluoroquinolone prophylaxis due to rising rates of resistance in E. coli isolates, the most common gram negative pathogen causing bloodstream infections in cancer patients (A. Freifeld, personal communication). Recent studies have also suggested that vancomycin is overused in oncology patients, which might additionally contribute to the high incidence rates of vancomycin-resistant E. faecium in oncology settings [28,29]. Another possible contributing factor is that oncology patients tend to be exposed to multiple and sometimes lengthy courses of antibiotic therapy, which may subsequently select for resistant pathogens. For instance, certain cephalosporins and anti-anaerobic drugs have also been described to promote overgrowth of vancomycin-resistant Enterococci in the lower intestine [30,31].
The increased frequency of some organisms among patients with bloodstream infections in oncology locations compared to non-oncology locations may also stem in part from mucositis-related bloodstream infections. For example, in some cases E. coli and viridans group streptococci may be related to mucositis and gastrointestinal mucosal barrier injury from cytotoxic chemotherapy rather than central lines [32]. In 2013 NHSN introduced a subcategory of bloodstream infections called mucosal barrier injury laboratory-confirmed bloodstream infections to help identify bloodstream infections with a high likelihood of being related to these non-central line-related factors [33]; however, that classification did not exist at the time these surveillance data were reported.
Our results differ in several important ways from the findings reported in a widely-referenced multicenter study of healthcare-associated bloodstream infections among oncology patients from 1995–2001 [4]. For example, viridans group streptococci, E. faecium, and E. coli were more common pathogens in our data than in the older report. In addition, Wisplinghoff and colleagues reported lower resistance for most major CLABSI pathogens, including S. aureus (29% vs 46% methicillin-resistant in our analysis), E. faecium (56% vs 83% vancomycin-resistant), Klebsiella spp. (1% vs 5% carbapenem resistant), and P. aeruginosa (6% vs 20% carbapenem-resistant). Fungal pathogens were somewhat less commonly identified in our report (9.3% vs 7.0%), which is likely due to the use of antifungal prophylaxis in certain populations. Notably, many of the pathogens that appear more prominent in our analysis of 2009–2012 data are those with the highest levels of resistance (e.g., E. faecium, E. coli). This finding is consistent with the notion that a broad change in environmental pressure, such as widespread fluoroquinolone prophylaxis within the oncology population, has yielded a profile of more resistant pathogens than that reported by Wisplinghoff et al. Changes in oncology treatment may have also contributed to differences seen. Methodological differences may account for some of the discrepancies in the results of the two analyses. For example, our analysis only included central line-associated primary bloodstream infections, whereas Wisplinghoff et al. reported on all nosocomial primary and secondary bloodstream infections. Notwithstanding these differences, comparisons of the two analyses suggest that and resistant organisms selected by antimicrobial therapy and prophylaxis are increasingly causing infections in oncology patients.
However, we also found selected instances in which antimicrobial resistance was similar or even lower in oncology locations as compared to non-oncology locations, notably methicillin resistance in S. aureus and multiple resistance phenotypes in Klebsiella spp. and P. aeruginosa (Table 4). These findings may seem surprising in the context of intensive antimicrobial use for oncology patients, as described above. However, they are consistent with the following observations. First, different antimicrobial-resistant pathogens appear to flourish in particular settings, possibly related to differences in sources or mechanisms of acquisition among patients in those settings. For example, ESBL-producing E. coli have been described to be more predominant in strains circulating in the community, whereas ESBL Klebsiella spp. may be more typically related to transmission in hospitals [34–36]. Second, since many oncology patients are highly immunosuppressed, healthcare personnel caring for these patients might have heightened attention to proper infection control practices, which could result in reduced transmission of antimicrobial-resistant organisms. Furthermore, we found the incidence rates of CLABSI due to the antimicrobial-resistant organisms shown in Figure 1 to be higher in oncology than non-oncology settings. Therefore, although the prevalence of antimicrobial resistance among certain specific organisms may be higher in non-oncology settings, these data demonstrate that the occurrence of infections due to resistant organisms is higher in oncology.
We acknowledge limitations with this analysis. First, patient-level risk factor data for CLABSIs, such as malignancy type or neutropenia, are not reported to NHSN, and we were only able to analyze data at the level of hospital locations instead of at the individual patient level. For example, because of the way in which location codes are assigned for NHSN reporting, it is likely that some CLABSIs among patients without cancer are included in the oncology unit data, and similarly, CLABSIs among patients with cancer may be included in the non-oncology unit data. Second, antimicrobial susceptibility data reported to NHSN are limited. For example, completeness of antimicrobial susceptibility data varied by organism and phenotype. Though data were reported for over 90% of CLABSI for the resistance profiles that we have highlighted in our discussion, we may have overestimated the degree of resistance for some less common phenotypes (e.g., carbapenem resistance) if most of the unreported data were for susceptible organisms. In addition, we did not have data on mechanisms of antimicrobial resistance or phenotypic testing beyond an interpreted susceptibility result. We do not, for example, receive reports of ESBL production. Third, our data are limited to nosocomial CLABSIs. Although central line use is high in oncology units [38], resistance patterns for community onset or non-CLABSI infections might differ from the hospital-associated and central line-associated infections described here. Fourth, because the composition of oncology locations reporting data to NHSN differs from year to year, comparing results from one time period to another could be confounded if, for example, oncology locations with higher prevalence of fluoroquinolone resistance preferentially enrolled in NHSN in later years.
A significant strength of this analysis is that it represents the largest set of data from the United States on pathogens and antimicrobial resistance in oncology. Data from multiple hospitals illustrates overall increases in antimicrobial resistance compared to prior reports as well as likely increased fluoroquinolone resistance during 2009–2012. Reassessment of effectiveness of antimicrobial prophylaxis and optimal strategies for antimicrobial treatment may be needed in light of these trends.
Acknowledgments
We thank Jonathan Edwards for statistical support, and Scott Fridkin, Brandi Limbago, Jean Patel, and L. Clifford McDonald for critical comments on the analysis.
Funding: none.
Abbreviations
- FLUCO
fluconazole resistance
- ESC
extended spectrum cephalosporin resistance
- VAN
vancomycin resistance
- FQ
fluoroquinolone resistance
- OX
oxacillin/methicillin resistance
Footnotes
Disclaimer:
The findings and conclusions in this paper are those of the authors and do not necessarily represent the views of the Centers for Disease Control and Prevention.
Potential conflicts of interest: A.F. has served as a consultant for Merck and Astellas. All authors have submitted the ICMJE Form for Disclosure of Potential Conflicts of Interest.
References
- 1.Freifeld AG, Bow EJ, Sepkowitz KA, et al. Clinical practice guideline for the use of antimicrobial agents in neutropenic patients with cancer: 2010 update by the Infectious Diseases Society of America. Clin Infect Dis. 2011;52:e56–e93. doi: 10.1093/cid/cir073. [DOI] [PubMed] [Google Scholar]
- 2.Kamboj M, Sepkowitz KA. Nosocomial infections in patients with cancer. Lancet Oncol. 2009;10:589–597. doi: 10.1016/S1470-2045(09)70069-5. [DOI] [PubMed] [Google Scholar]
- 3.Maschmeyer G, Haas A. The epidemiology and treatment of infections in cancer patients. Int J Antimicrob Agents. 2008;31:193–197. doi: 10.1016/j.ijantimicag.2007.06.014. [DOI] [PubMed] [Google Scholar]
- 4.Wisplinghoff H, Seifert H, Wenzel RP, Edmond MB. Current trends in the epidemiology of nosocomial bloodstream infections in patients with hematological malignancies and solid neoplasms in hospitals in the United States. Clin Infect Dis. 2003;36:1103–1110. doi: 10.1086/374339. [DOI] [PubMed] [Google Scholar]
- 5.Pitout JDD, Laupland KB. Extended-spectrum β-lactamase-producing Enterobacteriaceae: an emerging public-health concern. Lancet Infect Dis. 2008;8:159–166. doi: 10.1016/S1473-3099(08)70041-0. [DOI] [PubMed] [Google Scholar]
- 6.Fridkin SK, Hageman JC, Morrison M, et al. Methicillin-resistant Staphylococcus aureus disease in three communities. New Engl J Med. 2005;352:1463–44. doi: 10.1056/NEJMoa043252. [DOI] [PubMed] [Google Scholar]
- 7.Klevens RM, Morrison MA, Nadle J, et al. Invasive methicillin-resistant Staphylococcus aureus infections in the United States. JAMA. 2007;298:1763–71. doi: 10.1001/jama.298.15.1763. [DOI] [PubMed] [Google Scholar]
- 8.Centers for Disease Control and Prevention. Antibiotic resistance threats in the United States. 2013 Available online at: http://www.cdc.gov/drugresistance/threat-report-2013/
- 9.Centers for Disease Control and Prevention. Vital signs: carbapenem-resistant Enterobacteriaceae. MMWR. 2013;62:165–70. [PMC free article] [PubMed] [Google Scholar]
- 10.Bucaneve G, Micozzi A, Menichetti F, et al. Levofloxacin to prevent bacterial infection in patients with cancer and neutropenia. New Engl J Med. 2005;353:977–987. doi: 10.1056/NEJMoa044097. [DOI] [PubMed] [Google Scholar]
- 11.Cullen M, Steven N, Billingham L, et al. Antibacterial prophylaxis after chemotherapy for solid tumors and lymphomas. New Engl J Med. 2005;353:988–998. doi: 10.1056/NEJMoa050078. [DOI] [PubMed] [Google Scholar]
- 12.Gafter-Gvili A, Fraser A, Paul M, Leibovici L. Meta-analysis: antibiotic prophylaxis reduces mortality in neutropenic patients. Annals Int Med. 2005;142:979–995. doi: 10.7326/0003-4819-142-12_part_1-200506210-00008. [DOI] [PubMed] [Google Scholar]
- 13.Flowers CR, Seidenfeld J, Bow EJ, et al. Antimicrobial prophylaxis and outpatient management of fever and neutropenia in adults treated for malignancy: American Society of Clinical Oncology clinical practice guideline. J Clin Onc. 2013;31:794–810. doi: 10.1200/JCO.2012.45.8661. [DOI] [PubMed] [Google Scholar]
- 14.Hammond SP, Baden LR. Antibiotic prophylaxis for patients with acute leukemia. Leuk Lymphoma. 2008;49:183–193. doi: 10.1080/10428190701769673. [DOI] [PubMed] [Google Scholar]
- 15.Bow EJ. Fluoroquinolones, antimicrobial resistance and neutropenic cancer patients. Curr Opin Infect Dis. 2011;24:545–553. doi: 10.1097/QCO.0b013e32834cf054. [DOI] [PubMed] [Google Scholar]
- 16.Cattaneo C, Qaresmini G, Casari S, et al. Recent changes in bacterial epidemiology and the emergence of fluoroquinolone-resistant Escherichia coli among patients with haematological malignancies: results of a prospective study on 823 patients at a single institution. J Antimicr Chemo. 2008;61:721–728. doi: 10.1093/jac/dkm514. [DOI] [PubMed] [Google Scholar]
- 17.Bhusal Y, Mihu CN, Tarrand JJ, Rolston KV. Incidence of fluoroquinolone-resistant and extended-spectrum β-lactamase-producing Escherichia coli at a comprehensive cancer center in the United Stated. Chemotherapy. 2011;57:335–338. doi: 10.1159/000329661. [DOI] [PubMed] [Google Scholar]
- 18.Gudiol C, Bodro M, Simonetti A, et al. Changing aetiology, clinical features, antimicrobial resistance, and outcomes of bloodstream infection in neutropenic cancer patients. Clin Micro Infect. 2012;19:474–479. doi: 10.1111/j.1469-0691.2012.03879.x. [DOI] [PubMed] [Google Scholar]
- 19.Sievert DM, Ricks P, Edwards JR, et al. Antimicrobial-resistant pathogens associated with healthcare-associated infections: summary of data reported to the National Healthcare Safety Network at the Centers for Disease Control and Prevention, 2009–2010. Infect Control Hosp Epidemiol. 2013;34:1–14. doi: 10.1086/668770. [DOI] [PubMed] [Google Scholar]
- 20.Centers for Disease Control and Prevention. Chapter 4: Central Line-Associated Bloodstream Infection (CLABSI) Event. National Healthcare Safety Network Patient Safety Manual. 2012 Jan; [Google Scholar]
- 21.CDC location labels and location descriptions. 2015 Jan; Available at: http://www.cdc.gov/nhsn/pdfs/pscmanual/15locationsdescriptions_current.pdf. Accessed August 17, 2015.
- 22.Magiorakos AP, Srinivasan A, Carey RB, et al. Multidrug-resistant, extensively drug-resistant, and pandrug-resistant bacteria: an international expert proposal for interim standard definitions for acquired resistance. Clin Microbiol Infect. 2012;18:268–81. doi: 10.1111/j.1469-0691.2011.03570.x. [DOI] [PubMed] [Google Scholar]
- 23.Miles-Jay A, Butler-Wu S, Rowhani-Rahbar A, Pergam SA. Incidence rate of fluoroquinolone-resistant gram-negative rod bacteremia among allogeneic hematopoietic cell transplant patients during an era of levofloxacin prophylaxis. Biol Blood Marrow Transplant. 2015;21:539–545. doi: 10.1016/j.bbmt.2014.12.006. [DOI] [PMC free article] [PubMed] [Google Scholar]
- 24.Teillant A, Gandra S, Barter D, Morgan DJ, Laxminarayan R. Potential burden of antibiotic resistance on surgery and cancer chemotherapy antibiotic prophylaxis in the USA: a literature review and modeling study. Lancet Infect Dis. 2015 doi: 10.1016/S1473-3099(15)00270-4. [epub ahead of print] [DOI] [PubMed] [Google Scholar]
- 25.Carmeli Y, Eliopolous GM, Samore MH. Antecedent treatment with different antibiotic agents as a risk factor for vancomycin-resistant Enterococcus. Emerg Infect Dis. 2002;8:802–807. doi: 10.3201/eid0808.010418. [DOI] [PMC free article] [PubMed] [Google Scholar]
- 26.Kritskotakis EI, Christidou A, Roumbelaki M, Tselentis Y, Gikas A. The dynamic relationship between antibiotic use and the incidence of vancomycin-resistant Enterococcus: time-series modelling of 7-year surveillance data in a tertiary-care hospital. Clin Microbiol Infect. 2008;14:747–754. doi: 10.1111/j.1469-0691.2008.02026.x. [DOI] [PubMed] [Google Scholar]
- 27.Karki S, Land G, Aitchison S, et al. Long-term carriage of vancomycin-resistant Enterococci in patients discharged from hospitals: a 12-year retrospective cohort study. J Clin Micro. 2013;51:3374–3379. doi: 10.1128/JCM.01501-13. [DOI] [PMC free article] [PubMed] [Google Scholar]
- 28.Wright JD, Neugut AI, Ananth CV, et al. Deviations from guideline-based therapy for febrile neutropenia in cancer patients and their effect on outcomes. JAMA Int Med. 2013;173:559–568. doi: 10.1001/jamainternmed.2013.2921. [DOI] [PMC free article] [PubMed] [Google Scholar]
- 29.Libuit J, Whitman A, Wolfe R, Washington CS. Empiric vancomycin use in febrile neutropenic oncology patients. Open Forum Infect Dis. 2014;1:ofu006. doi: 10.1093/ofid/ofu006. [DOI] [PMC free article] [PubMed] [Google Scholar]
- 30.Donskey CJ, Chowdhry TK, Hecker MT, et al. Effect of antibiotic therapy on the density of vancomycin-resistant Enterococci in the stool of colonized patients. New Engl J Med. 2000;343:1925–1932. doi: 10.1056/NEJM200012283432604. [DOI] [PMC free article] [PubMed] [Google Scholar]
- 31.Rice LB. The complex dynamics of antimicrobial activity in the human gastrointestinal tract. Trans Am Clin Climatol Assoc. 2013;124:123–32. [PMC free article] [PubMed] [Google Scholar]
- 32.Seifert H, Cornely O, Seggewiss K, et al. Bloodstream infection in neutropenic cancer patients related to short-term nontunnelled catheters determined by quantitative blood cultures, differential time to positivity, and molecular epidemiological typing with pulsed-field gel electrophoresis. J Clin Microbiol. 2003;41:118–123. doi: 10.1128/JCM.41.1.118-123.2003. [DOI] [PMC free article] [PubMed] [Google Scholar]
- 33.See I, Iwamoto M, Allen-Bridson K, Horan T, Magill SS, Thompson ND. Mucosal barrier injury laboratory-confirmed bloodstream infection: results from a field test of a new National Healthcare Safety Network definition. Infect Control Hosp Epidemiol. 2013;34:769–76. doi: 10.1086/671281. [DOI] [PubMed] [Google Scholar]
- 34.Falagas ME, Karageorgopoulos DE. Extended-spectrum beta-lactamase-producing organisms. J Hosp Infect. 2009;73:345–354. doi: 10.1016/j.jhin.2009.02.021. [DOI] [PubMed] [Google Scholar]
- 35.Coque TM, Baquero F, Canton R. Increasing prevalence of ESBL-producing Enterobacteriaceae in Europe. Euro Surveill. 2008;13:19044. [PubMed] [Google Scholar]
- 36.Pitout JDD, Laupland KB. Extended-spectrum β-lactamase-producing Enterobacteriaceae: an emerging public-health concern. Lancet Infect Dis. 2008;8:159–166. doi: 10.1016/S1473-3099(08)70041-0. [DOI] [PubMed] [Google Scholar]
- 37.Magill SS, Edwards JR, Beldavs ZG, et al. Prevalence of antimicrobial use in US acute care hospitals, May–September 2011. JAMA. 2014;312:1438–1446. doi: 10.1001/jama.2014.12923. [DOI] [PMC free article] [PubMed] [Google Scholar]
- 38.Dudeck MA, Edwards JR, Allen-Bridson K, et al. National Healthcare Safety Network report, data summary for 2013, device-associated module. Am J Infect Control. 2015;43:206–221. doi: 10.1016/j.ajic.2014.11.014. [DOI] [PMC free article] [PubMed] [Google Scholar]