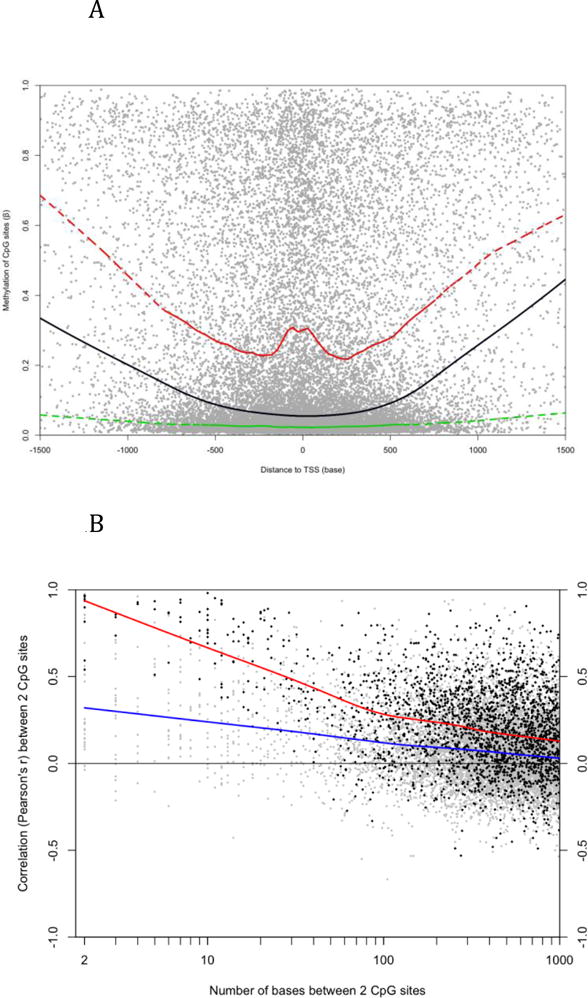
Figure 1.

Characteristics of DNA methylation in LCL. A) Each dot represents a CpG site on autosomes. The X-axis indicates the distance to the nearest TSS and the y-axis is the average β value of 55 LCLs. The lines were generated by Lowess smoothing (black: all sites; green: CGI sites; red: non-CGI sites). Non-CGI sites have higher methylation than CGI sites in general no matter their distance to TSS. B) Each dot represents a pair of CpG sites on autosomes. The x-axis is the distance between the two sites and the y-axis indicates their Pearson’s correlation coefficient across 55 LCLs. The lines were generated by Lowess smoothing (blue: all pairs; red: pairs whose average β values are between 0.1 and 0.9 at both sites).
