

The ability of direct heat stress to increase limb blood flow is well known, but the magnitude and profile of hemodynamic responses within the major vessels of the leg have not been explored. Here, we systematically characterize these responses through a wide range of heat stress levels and show that isolated leg heating confers potentially beneficial hemodynamic changes equivalent to those of moderate whole body hyperthermia, with these hemodynamic adjustments being predominantly driven by local temperature-sensitive mechanisms.
Keywords: leg blood flow, heat stress, hemodynamics
Abstract
The influence of temperature on the hemodynamic adjustments to direct passive heat stress within the leg's major arterial and venous vessels and compartments remains unclear. Fifteen healthy young males were tested during exposure to either passive whole body heat stress to levels approaching thermal tolerance [core temperature (Tc) + 2°C; study 1; n = 8] or single leg heat stress (Tc + 0°C; study 2; n = 7). Whole body heat stress increased perfusion and decreased oscillatory shear index in relation to the rise in leg temperature (Tleg) in all three major arteries supplying the leg, plateauing in the common and superficial femoral arteries before reaching severe heat stress levels. Isolated leg heat stress increased arterial blood flows and shear patterns to a level similar to that obtained during moderate core hyperthermia (Tc + 1°C). Despite modest increases in great saphenous venous (GSV) blood flow (0.2 l/min), the deep venous system accounted for the majority of returning flow (common femoral vein 0.7 l/min) during intense to severe levels of heat stress. Rapid cooling of a single leg during severe whole body heat stress resulted in an equivalent blood flow reduction in the major artery supplying the thigh deep tissues only, suggesting central temperature-sensitive mechanisms contribute to skin blood flow alone. These findings further our knowledge of leg hemodynamic responses during direct heat stress and provide evidence of potentially beneficial vascular alterations during isolated limb heat stress that are equivalent to those experienced during exposure to moderate levels of whole body hyperthermia.
NEW & NOTEWORTHY
The ability of direct heat stress to increase limb blood flow is well known, but the magnitude and profile of hemodynamic responses within the major vessels of the leg have not been explored. Here, we systematically characterize these responses through a wide range of heat stress levels and show that isolated leg heating confers potentially beneficial hemodynamic changes equivalent to those of moderate whole body hyperthermia, with these hemodynamic adjustments being predominantly driven by local temperature-sensitive mechanisms.
upon exposure to high environmental temperatures, numerous cardiovascular adjustments result in significant increases in blood flow to the skin and extremities in conjunction with decreases in blood flow to the major thoracic vascular beds (24, 34, 36). The factors controlling these changes and the distribution of blood flow to different tissues within the limbs, however, are still not fully characterized and understood. A significant proportion of peripheral tissues (∼25%) within the human body are contained within the legs, and substantial vasodilation within these vascular beds have been postulated to contribute to certain known detrimental conditions of heat stress, such as the increased cardiac strain or incidence of orthostatic intolerance commonly reported in hyperthermic individuals. In contrast, however, this same vasodilatory response may possess the potential, when appropriately applied, to confer benefits to vascular function through increases in tissue blood flow and shear rates alongside decreases in proatherogenic oscillatory flow patterns within the major vessels. Although the hemodynamic response to heat stress has previously been characterized in the human forearm (6, 25, 27), the presence of a much greater incidence of vascular dysfunction in the lower limbs (20) suggests that lower limb hemodynamic responses to heat stress may differ, both in the leg as a whole and in the individual vessels perfusing the major vascular beds.
Recent work from our laboratory has shown that increases in blood flow to the human leg during exposure to both isolated leg heating and moderate levels of direct whole body passive heat stress are mediated solely through changes in local vascular conductance and that these changes are closely associated with local temperature, suggesting a dominant role of local temperature-sensitive mechanisms during this direct form of whole body heat stress (7). Although this study has investigated the role of temperature on leg blood flow distribution during moderate levels of heat stress, no study to date has assessed the effect of local vs. central temperature contributions during more severe levels of whole body heat stress. These responses will be important if the use of heat stress as a therapeutic intervention is to be further investigated in patient populations and ideally optimized to provide maximal vascular benefit alongside minimal detrimental heat-stress-associated conditions. Despite the leg hyperemic response to heat stress previously being documented in a number of studies (7, 13, 29), the relative distribution of blood flow within not only the leg itself (i.e., thigh vs. lower leg), but also the individual major vessels supplying and draining these tissues, remains relatively unexplored. While the GSV is often claimed to be the major drainage vessel of the skin circulation, relatively little is known of the contribution of the deep veins to venous return during heat stress, with only one study to date investigating this phenomenon and only to heat stress approaching moderate levels (1). In addition, no study to date has characterized blood flow profiles within the major vessels supplying the leg, which may have the potential to enhance anti-atherogenic shear responses similar to those shown in the human forearm, or compared the effectiveness of local heating interventions vs. whole body heat stress in eliciting these responses.
This study, therefore, aimed to 1) comprehensively investigate blood flow distribution and profiles within the major vessels and compartments (thigh and lower leg) of the human leg during progressive elevations in heat stress to levels approaching that of an individual's thermal tolerance, and 2) build on previous work during moderate heat stress by investigating the relative contribution of local and central temperature in the distribution of leg tissue perfusion at higher levels of heat stress. We hypothesized that 1) direct passive heat stress would lead to progressive elevations in blood flow to all vessels of the leg alongside corresponding beneficial changes in flow profiles within the vessels themselves, and 2) that local control mechanisms would continue to be the dominant controlling mechanism responsible for these perfusion and hemodynamic changes during the direct heating.
METHODS
Ethical Approval
Informed written consent was obtained from each participant before commencing the study. All procedures were approved by the Brunel University London Research Ethics Committee (RE27-13) and conformed to the Declaration of Helsinki.
Participants
Fifteen healthy males (age: 23 ± 5 yr; height: 181 ± 7 cm; and weight: 75 ± 12 kg) were recruited to participate in two separate studies, with each participant exposed to either passive whole body heat stress (study 1; n = 8) or, in a follow-up study, isolated single leg heat stress (study 2; n = 7). Participants abstained from alcohol, caffeine, and strenuous exercise in the 24 h leading up to the day of testing.
Experimental Protocols
Experimental setups for both studies are depicted in Fig. 1. In study 1, each participant visited the laboratory on two occasions separated by at least 1 wk. These consisted of a shortened familiarization trial in the initial visit to estimate whole body sweat rate, followed by the main experimental trial at least 1 wk later. In the familiarization trial, participants attended the laboratory at 9 AM following ingestion of their usual breakfast and were weighed and measured in a seminude state (SECA 798). Following instrumentation, participants were fitted with a custom-built water-perfused suit designed to cover the entire body, before being wrapped in survival blankets to prevent heat loss to the surrounding environment and left to rest in the supine position for the remainder of the study. The suit was connected to a thermostatically controlled water circulator (Julabo F-34; Seelbach) to allow the constant perfusion of 50°C water and subsequent manipulation of body temperature, and participants were passively heated until core temperature (Tc) increased by 1°C. Following the end of the intervention, participants were weighed once again and whole body sweat rate was estimated in liters per hour as (preheating mass in kilograms − postheating mass in kilograms)/duration of heating in hours.
Fig. 1.
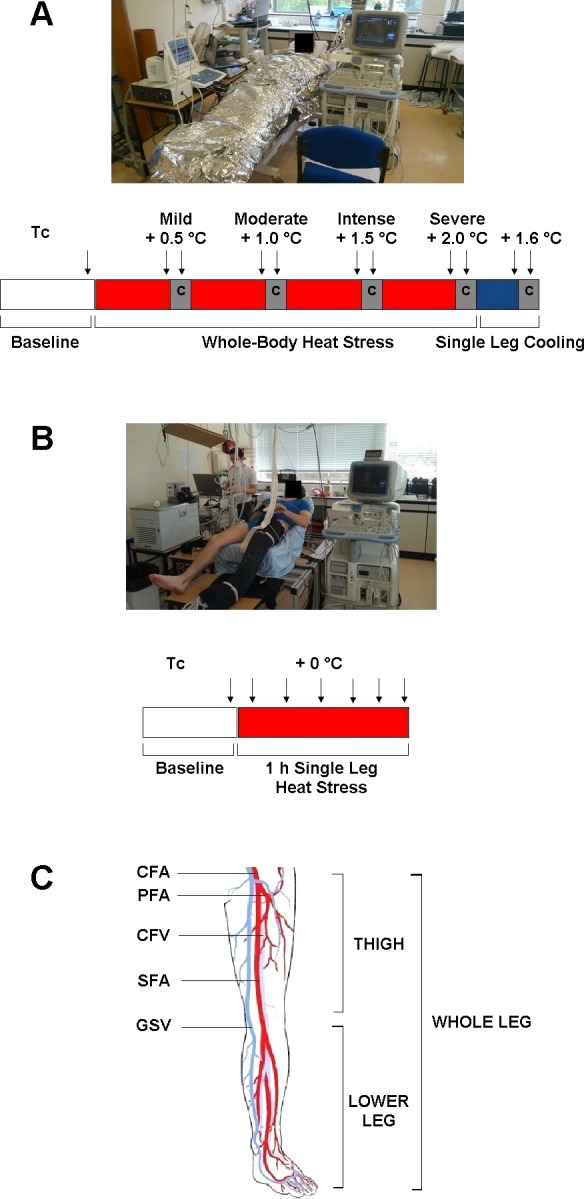
Sequence of the experimental protocols and schematic of the leg major vessels and anatomical sections. A: in study 1, following baseline measurements, participants were heated to core temperature (Tc) + 2°C with measurements (denoted by arrows) taken during mild (+0.5°C), moderate (+1°C), intense (+1.5°C), and severe (+2°C) heat stress, both before and after arterial cuff occlusions (denoted by C) at the level of the knee. Following the whole body heat stress protocol, the left leg was rapidly cooled and further measurements taken as before. B: participants in study 2 rested in ambient thermoneutral conditions while a single leg was heated for a duration of 1 h. C: illustration of the leg's major supplying [common, superficial, and profunda femoral arteries (CFA, SFA, and PFA)] and draining vessels [common femoral vein (CFV) and great saphenous vein (GSV)] and the anatomical differentiation between the thigh and the lower leg.
The experimental trial consisted of a similar protocol to the familiarization trial but with participants exposed to a more severe level of heat stress than their initial visit. Full body passive heating was continued until participants reached their level of thermal tolerance or achieved a Tc of at least 2°C above baseline. Levels of heat stress were defined as mild (+0.5°C), moderate (+1°C), intense (+1.5°C), and severe (+2°C). Thermal tolerance was defined by participants displaying symptoms of presyncope, reporting symptoms of nausea, or indicating they were no longer willing to continue. Participants were provided with water every 20 min at a rate equal to their calculated sweat rate in the familiarization trial and at a temperature approximately equal to that of Tc. At ∼20-min intervals throughout the heating protocol, complete arterial occlusion at the level of the knee was performed to assess blood flow distribution to the thigh and the lower leg, with the thigh defined as the section of the leg between the hip and the knee and the lower leg defined as the section below the knee. Occlusions were carried out for 5 min via the inflation of a pneumatic cuff at the level of the knee (immediately distal to the patella) to 240 mmHg (Hokanson E20 Rapid Cuff Inflator and CC17 Cuff, Bellevue, WA). A minimum of 20 min always elapsed between the deflation of the pneumatic cuff and the next measurement of whole leg blood flow to ensure that no residual effects of the postreactive hyperemia distorted the next set of measurements. Following the attainment of the target Tc, one leg of the water-perfused suit was removed and the exposed limb was completely surrounded in bags of crushed ice for 10 min to facilitate rapid skin and subcutaneous tissue cooling. This intervention resulted in the presence of a low local temperature/high core temperature state, allowing the contribution of each of these regulatory inputs to flow distribution to be assessed. Following measurements of blood flow in the different vessels after 5 min of local cooling, an arterial occlusion was performed at the level of the knee using the pneumatic cuff and temperature and hemodynamic responses were measured at various depths within the cooled thigh to establish the relationships between local and systemic temperature and blood flow within the deep and superficial tissues.
In study 2, participants reported to the laboratory at a similar time of day and, following instrumentation, rested in the supine position while a single leg was fitted with one leg of the water-perfused suit, designed to cover the entire limb. Similar to study 1, the single water-perfused trouser leg was subsequently perfused with 50°C water to raise limb tissue temperatures in the isolated leg alone. Blood flow and temperature measurements were recorded every 10 min in the experimental limb for a duration of 1 h, with contralateral control leg blood flow recorded at 0, 30, and 60 min.
Temperature Measurements
Tc was measured using an esophageal thermistor (PhysiTemp, Clifton, NJ). Following application of local anesthetic gel (1% lidocaine) to the dominant nostril, the probe was inserted into the nasal cavity and advanced to a level roughly one-fourth that of standing height to sit behind the left atrium (22). Skin temperature (Tsk) was measured using wireless telemetry buttons (iButtons; Maxim) fitted to the arm, chest, thigh, and calf; and mean whole body skin temperature (T̄sk) was calculated using a standard weighted formula (31). Mean leg skin temperature was calculated as the average of thigh and calf measurements. Muscle (Tm) and subcutaneous (Tsc) temperatures were measured using sterile implantable thermocouples inserted into the mid-portion of the vastus lateralis muscle using a 22-gauge catheter. Local anesthetic gel (1% lidocaine) was applied to the site of measurement before insertion to minimize any discomfort. Tm was measured at a depth of ∼2-3 cm, while Tsc was measured directly under the skin. Mean leg temperature (T̄leg) was calculated as a ratio of leg Tsk, Tsc, and Tm, weighted by the volume of each of these tissue compartments in the leg (43) and averaged to provide an indication of mean tissue temperature across the leg. The lack of Tsc measurements during single leg heating resulted in the calculation of T̄leg as a ratio of Tsk and Tm alone. The close tracking of Tsk and Tsc during whole body heat stress, however, suggested that results between the two studies would be comparable despite this limitation.
Hemodynamic Measurements
Arterial blood pressure and heart rate were measured noninvasively by infrared photoplethysmography (Finometer; FMS) via a cuff on the middle finger of the right hand. Stroke volume was estimated using the ModelFlow method included with the Beatscope computer software package (Beatscope; FMS), with cardiac output calculated as stroke volume × heart rate following corrections for age, height, and weight (44). Blood flow was repeatedly measured during the different stages of heat stress in the common, superficial, and profunda femoral arteries (CFA, SFA, and PFA, respectively) and the GSV using a duplex Doppler ultrasound system (Vivid 7 Dimension; GE Medical, Horton, Norway) with a 10-MHz linear array transducer probe (GE Medical Systems). Common femoral vein (CFV) blood flow was calculated as CFA blood flow minus GSV blood flow. Custom-made flaps in the water-perfused suit and surrounding survival blankets allowed the probe to be placed against the skin with minimal heat loss to the surrounding environment, while a small gap between ice packs allowed the same measurements to be taken during subsequent isolated leg cooling. All arterial measurements were taken at a distance of at least 2 cm from the bifurcation into the SFA and PFA to minimize disruption to measurements due to turbulent flow, whereas flow through the GSV was measured immediately distal to the preterminal valve separating the vein from the saphenofemoral junction in an attempt to prevent influx of flow from accessory veins draining areas other than the leg. Measurements of GSV blood flow using Doppler ultrasound have previously been shown in a number of studies to be reliable and repeatable (1, 26). Blood flow through each vessel was calculated as the product of the average vessel cross-sectional area obtained from three two-dimensional B-mode images and the mean velocity averaged over two 16-s Doppler scans (32 s total). Arterial diameter was consistently measured at peak systole (30), identified by an overlaid ECG trace, while venous diameter was measured every 2 s over the duration of one velocity trace (16 s total) to account for diameter changes due to both cardiac and respiratory cycles. Arterial and venous blood flows (BF) were calculated in ml/min using the equation BF = Vmean × π × (D/2)2 × 60, where Vmean is the time-averaged mean velocity of the blood expressed as cm/s, π is a mathematical constant, D is the diameter of the vessel in cm, and 60 is a constant employed to convert the units to ml/min. Shear rates were calculated using the formula SR = (4 × Vmean)/D, where SR is shear rate; Vmean is mean, anterograde, or retrograde blood velocity; and D is vessel diameter. Oscillatory shear index was calculated using the equation OSI = (SRret)/(SRant + SRret), where OSI is oscillatory shear index, SRret is mean retrograde shear rate, and SRant is mean anterograde shear rate. The OSI calculation provides a dimensionless variable that indicates the relative contribution of anterograde and retrograde shear profiles over the duration of a cardiac cycle and ranges from 0 (pure anterograde shear) to 0.5 (pure oscillatory shear).
Statistical Analysis
A one-way repeated-measures ANOVA was used to test for differences over time, with Holm-Bonferroni post hoc testing employed to identify the time points at which changes occurred once a significant effect was found. Multiple regression for within-subject repeated measures was used for the analysis of the relationship between leg blood flow and T̄leg (4). Differences in OSI between whole body and isolated lower-limb heat stress were compared using an independent samples t-test. All statistical analyses were carried out using SPSS (Version 20; IBM, Armonk, NY) with results expressed as mean ± SE. Significance was set at P < 0.05.
RESULTS
Temperature Responses During Whole Body and Isolated Leg Heat Stress
Full temperature responses can be seen in Table 1, while representative responses from one subject during both whole body and isolated leg heat stress are displayed in Fig. 2. In study 1, passive whole body heat-stress increased T̄sk and Tsc rapidly upon commencement of heat stress before leveling off following 40–50 min and remaining elevated for the remainder of the experiment (final values ∼6°C higher than baseline for both; P < 0.05 for all; Fig. 2A). As determined by the experimental design, Tc increased progressively up to 2.0 ± 0.1°C (mean heating duration: 94 ± 5 min) while Tm increased in a linear fashion from 34.9 ± 0.3 to 38.3 ± 0.1°C. Subsequent cooling of a single leg for 10 min reduced leg T̄sk, Tsc, and Tm by 11.4, 7.5, and 1.5°C, respectively, such that T̄sk and Tsc tended to be reduced below baseline values while Tm and Tc remained elevated.
Table 1.
Temperature and hemodynamic responses to whole body heat stress followed by single leg cooling and isolated single leg heat stress
| Whole Body Heat Stress |
Isolated Single Leg Heat Stress |
|||||||
|---|---|---|---|---|---|---|---|---|
| Baseline | Mild | Moderate | Intense | Severe | Leg cooling | Baseline | End | |
| Tc, °C | 36.8 ± 0.1 | 37.2 ± 0.1* | 37.8 ± 0.1* | 38.3 ± 0.1* | 38.8 ± 0.1* | 38.4 ± 0.1† | 37.2 ± 0.4 | 37.2 ± 0.6 |
| T̄sk, °C | 33.1 ± 0.4 | 37.5 ± 0.3* | 38.4 ± 0.2* | 39.0 ± 0.2* | 39.4 ± 0.2* | 38.2 ± 0.2† | 31.1 ± 0.4 | 38.9 ± 0.6* |
| Tsc, °C | 33.5 ± 0.6 | 37.0 ± 0.1* | 37.8 ± 0.3* | 38.2 ± 0.2* | 39.0 ± 0.4* | 31.5 ± 1.2† | — | — |
| Tm, °C | 34.9 ± 0.3 | 36.2 ± 0.2* | 37.0 ± 0.2* | 37.6 ± 0.2* | 38.3 ± 0.1* | 36.8 ± 0.2† | 34.5 ± 0.5 | 36.8 ± 0.1* |
| Tthigh, °C | 33.4 ± 0.9 | 40.3 ± 0.9* | 40.2 ± 0.7 | 40.1 ± 0.3 | 40.5 ± 0.3 | 29.0 ± 5.1† | 31.3 ± 0.2 | 39.1 ± 0.5 |
| Tcalf, °C | 31.5 ± 0.3 | 33.8 ± 0.5* | 35.9 ± 0.3* | 37.4 ± 0.2* | 37.8 ± 0.2 | 26.9 ± 5.3† | 30.7 ± 0.3 | 38.3 ± 0.5 |
| T̄leg, °C | 34.4 ± 0.4 | 35.9 ± 0.3 | 37.0 ± 0.1 | 37.8 ± 0.1 | 38.7 ± 0.3 | 36.2 ± 0.3 | 34.0 ± 1.3 | 37.1 ± 0.3 |
| CFA, l/min | ||||||||
| Whole leg | 0.31 ± 0.03 | 0.53 ± 0.07* | 0.86 ± 0.07* | 1.24 ± 0.10* | 1.22 ± 0.11 | 0.98 ± 0.04† | 0.25 ± 0.02 | 0.76 ± 0.08* |
| Leg occlusion | 0.22 ± 0.02 | 0.44 ± 0.02* | 0.64 ± 0.05* | 0.65 ± 0.05 | 0.71 ± 0.04 | 0.55 ± 0.05† | — | — |
| SFA, l/min | ||||||||
| Whole leg | 0.17 ± 0.01 | 0.41 ± 0.05* | 0.73 ± 0.08* | 0.91 ± 0.08* | 0.95 ± 0.09 | 0.76 ± 0.06† | 0.13 ± 0.01 | 0.46 ± 0.07* |
| Leg occlusion | 0.11 ± 0.02 | 0.28 ± 0.03* | 0.39 ± 0.04* | 0.42 ± 0.04 | 0.43 ± 0.04 | 0.29 ± 0.05† | — | — |
| PFA, l/min | ||||||||
| Whole leg | 0.10 ± 0.02 | 0.12 ± 0.02* | 0.18 ± 0.02* | 0.22 ± 0.04* | 0.26 ± 0.04* | 0.19 ± 0.02† | 0.08 ± 0.01 | 0.22 ± 0.05* |
| Leg occlusion | 0.08 ± 0.02 | 0.16 ± 0.02* | 0.20 ± 0.03* | 0.24 ± 0.03* | 0.27 ± 0.03* | 0.17 ± 0.02† | — | — |
| CFV, l/min | ||||||||
| Whole leg | 0.28 ± 0.03 | 0.40 ± 0.05* | 0.66 ± 0.07* | 0.98 ± 0.10* | 0.97 ± 0.10 | 0.78 ± 0.03† | — | — |
| Leg occlusion | 0.20 ± 0.02 | 0.34 ± 0.02* | 0.49 ± 0.04* | 0.49 ± 0.04 | 0.54 ± 0.03 | 0.40 ± 0.04† | — | — |
| GSV, l/min | ||||||||
| Whole leg | 0.02 ± 0.01 | 0.13 ± 0.02* | 0.21 ± 0.02* | 0.25 ± 0.02* | 0.25 ± 0.03 | 0.22 ± 0.05 | — | — |
| Leg occlusion | 0.01 ± 0.01 | 0.10 ± 0.01* | 0.15 ± 0.01* | 0.16 ± 0.02 | 0.17 ± 0.02 | 0.15 ± 0.03 | — | — |
| Q̇, l/min | 6.4 ± 0.5 | 7.3 ± 0.3* | 8.5 ± 0.6* | 9.3 ± 0.6* | 9.7 ± 0.6* | 8.4 ± 0.5† | 6.2 ± 0.5 | 6.4 ± 0.5 |
| HR, beats/min | 60 ± 3 | 72 ± 3* | 85 ± 4* | 96 ± 4* | 106 ± 3* | 93 ± 3† | 65 ± 8 | 72 ± 4 |
| SV, ml | 107 ± 8 | 102 ± 8 | 100 ± 8* | 98 ± 9 | 91 ± 7* | 92 ± 7 | 95 ± 5 | 90 ± 7 |
| MAP, mmHg | 91 ± 3 | 78 ± 2* | 80 ± 2 | 81 ± 2 | 82 ± 3 | 80 ± 2 | 78 ± 3 | 81 ± 3 |
Values are means ± SE for 8 participants (study 1) and 7 participants (study 2). Tc, core temperature; Tm, leg muscle temperature; Tsc, leg subcutaneous temperature; T̄sk, mean leg skin temperature; Tthigh, thigh skin temperature; Tcalf calf skin temperature; T̄leg mean leg temperature; CFA, common femoral artery; SFA, superficial femoral artery; PFA, profunda femoral artery; CFV, common femoral vein; GSV, great saphenous vein; Q̇, cardiac output; HR, heart rate; SV, stroke volume; MAP, mean arterial pressure.
P < 0.05, significantly different from previous condition.
P < 0.05, significantly different from severe whole body heat stress.
Fig. 2.

Temperature responses to passive whole body heat stress followed by single leg cooling and single leg heat stress. A: representative trace from a single participant showing typical core, muscle, subcutaneous, and skin temperature responses during progressive whole body heat stress followed by single leg cooling (indicated by dashed vertical line) (study 1). B: representative trace from a single participant showing typical core, muscle, and skin temperature responses during single leg heat stress (study 2).
In study 2, isolated leg heat stress led to increases in leg T̄sk and Tm from 31.1 ± 0.4 to 38.9 ± 0.6°C and from 34.5 ± 0.5 to 36.8 ± 0.1°C, respectively (P < 0.05 for both), with Tc remaining unchanged throughout. The time course of the temperature responses of a representative participant during isolated leg heat stress is illustrated in Fig. 2B.
Leg Perfusion and Systemic Hemodynamic Responses to Whole Body Heat Stress, Lower Leg Occlusion, and Single Leg Cooling
Passive whole body heat stress.
In study 1, CFA blood flow, an index of whole leg blood flow, increased in a linear fashion from 0.30 ± 0.03 l/min at baseline to 1.24 ± 0.10 l/min during intense heat stress (+0.93 l/min) but showed no further increases upon progression to severe heat stress (final values: 1.22 ± 0.11 l/min; Table 1 and Fig. 3A). This plateau occurred despite further elevations in both Tc and T̄leg. SFA blood flow showed a similar response (+0.73 l/min), with an apparent plateau during severe heat stress (Fig. 3B), while PFA flow displayed a modest yet steady increase over the entire duration of passive heat stress (+0.17 l/min; Fig. 3C). CFV and GSV blood flow showed similar responses to that observed on the arterial side of the circulation, with increases from baseline to intense heat stress (+0.80 and +0.23 l/min, respectively; P < 0.05), before plateauing during severe heat stress (Fig. 4). At the systemic level, cardiac output (Q̇) increased from 6.4 ± 0.5 l/min at baseline to 9.7 ± 0.7 l/min during severe heat stress. Mean arterial pressure (MAP) decreased from baseline to moderate heat stress (90 ± 3 to 80 ± 2 mmHg; P < 0.05) before plateauing for the remainder of heating (final value: 82 ± 3 mmHg).
Fig. 3.

Leg blood flow distribution in the thigh and leg during passive whole body heat stress and leg occlusion. Blood flow distribution to each of the major conduit arteries during passive heat stress. Thigh blood flow is represented by CFA blood flow following a cuff occlusion at the level of the knee, whereas lower leg blood flow is the difference between thigh blood flow and whole leg blood flow. A: CFA. B: SFA. C: PFA. Data are mean ± SE for 8 subjects. *P < 0.05, significantly higher than previous condition.
Fig. 4.

Relationship between leg hemodynamic responses and mean leg temperature during passive whole body heat stress followed by single leg cooling. CFA, SFA, and PFA blood flows vs. mean leg temperature (A) and GSV and CFV blood flow (B) during passive heat stress and rapid single leg cooling. Data are mean ± SE for 8 subjects. *Significantly higher than previous condition. #P < 0.05, significantly lower than severe heat stress.
Lower leg occlusion.
Lower leg occlusion at the level of the knee allowed blood flow distribution to the thigh and lower leg to be determined (Fig. 3). Thigh blood flow increased with increasing Tc and T̄leg temperatures from baseline to levels of moderate heat stress (0.22 ± 0.02 to 0.64 ± 0.05 l/min; P < 0.05), leveling off for the remainder of the protocol despite further increases in Tc and T̄leg of ∼1 and 2°C, respectively (P < 0.05; Table 1 and Fig. 3A). In contrast, lower leg blood flow showed significant increases until intense levels of heat stress were obtained, before also leveling off at 0.5 l/min before severe heat exposure. Blood flow to the lower leg was supplied exclusively by the SFA (Fig. 3B), as PFA blood flow remained unaffected by lower leg occlusion at all levels of heat stress (Fig. 3C).
Isolated leg cooling.
Single leg cooling following severe heat stress, both with and without leg occlusion, led to a significant decrease in blood flow to the CFA, SFA, PFA, and CFV (10–20%; P < 0.05; Fig. 4) but not the GSV (P = 0.21). These decreases in limb blood flow occurred alongside decreases in heart rate (106 ± 3 to 93 ± 3 beats/min; P < 0.05) and a subsequent decrease in Q̇ (9.7 ± 0.6 to 8.4 ± 0.5 l/min; P < 0.05), as stroke volume remained unchanged.
Leg Perfusion and Systemic Hemodynamic Responses During Isolated Leg Heat Stress
Isolated leg heat stress in study 2 led to significant increases in blood flow through the CFA (0.25 ± 0.02 to 0.76 ± 0.08 l/min; 3-fold increase), SFA (0.13 ± 0.01 to 0.46 ± 0.07 l/min; 3.5-fold increase), and PFA (0.08 ± 0.01 to 0.22 ± 0.05 l/min; 2.5-fold increase; P < 0.05 for all). In the contralateral control limb, no significant changes in flow were observed during either the cooling or heating protocol (P > 0.05). At the systemic level, there were no significant changes in hemodynamic variables during either the cooling or heating protocol.
Flow Profile and Shear Rate Responses During Whole Body and Isolated Leg Heat Stress
In both studies, mean shear rate significantly increased in all three arteries over the duration of passive heat stress (P < 0.05; Table 2). Increased shear in the CFA and SFA occurred as a result of an increased anterograde flow and shear rate component in conjunction with a significant decrease in opposing retrograde flow and shear. Mean PFA shear increased due to increases in anterograde shear rates only, as retrograde flow and shear remained unchanged throughout. The combination of an increased anterograde and decreased retrograde shear component in both the CFA and SFA led to significant decreases in the OSI. The PFA OSI was significantly lower than CFA and SFA at baseline but finished at levels similar to those of the other two vessels (final value: 0.08 ± 0.03). Exposure to moderate whole body heat stress (study 1) resulted in similar blood flows, shear rates, and OSIs in the CFA and PFA compared with isolated leg heat stress (Fig. 5), although SFA blood flow and OSI were significantly higher and lower, respectively (P < 0.05). Further severe heat stress resulted in additional increases in flow to all vessels alongside an almost complete abolition of oscillatory flow (maximum OSI = 0.05).
Table 2.
Arterial diameters and flow profiles during whole body heat stress followed by single leg cooling and isolated single leg heat stress
| Whole body Heat Stress |
Isolated Leg Heat Stress |
||||||
|---|---|---|---|---|---|---|---|
| Baseline | Mild | Moderate | Intense | Severe | Baseline | End | |
| Diameter, cm | |||||||
| CFA | 0.96 ± 0.04 | 0.95 ± 0.04 | 0.96 ± 0.04 | 0.96 ± 0.04 | 0.96 ± 0.04 | 0.83 ± 0.01 | 0.84 ± 0.02 |
| SFA | 0.75 ± 0.03 | 0.73 ± 0.03 | 0.76 ± 0.03 | 0.76 ± 0.03 | 0.76 ± 0.03 | 0.67 ± 0.02 | 0.68 ± 0.02 |
| PFA | 0.56 ± 0.03 | 0.57 ± 0.02 | 0.57 ± 0.02 | 0.58 ± 0.03 | 0.58 ± 0.03 | 0.61 ± 0.04 | 0.61 ± 0.04 |
| Vmean, cm/s | |||||||
| CFA | 6.6 ± 0.6 | 13.3 ± 2.1* | 20.8 ± 1.7* | 28.4 ± 2.1* | 28.5 ± 2.4* | 7.4 ± 0.4 | 22.6 ± 2.7* |
| SFA | 6.1 ± 0.3 | 16.6 ± 2.1* | 26.8 ± 1.9* | 33.9 ± 2.7* | 34.4 ± 2.8* | 6.2 ± 0.6 | 22.6 ± 3.9* |
| PFA | 6.2 ± 0.6 | 7.7 ± 1.0* | 11.7 ± 0.8* | 14.4 ± 1.2* | 16.8 ± 1.8* | 5.0 ± 0.6 | 13.6 ± 3.3* |
| Vant, cm/s | |||||||
| CFA | 10.5 ± 1.0 | 16.8 ± 1.9* | 23.5 ± 0.9* | 30.3 ± 1.2* | 30.2 ± 1.3* | 13.2 ± 0.8 | 25.3 ± 2.6* |
| SFA | 10.1 ± 0.8 | 19.8 ± 1.8* | 28.9 ± 0.8* | 35.1 ± 1.4* | 36.1 ± 1.6* | 12.7 ± 1.1 | 25.9 ± 3.9* |
| PFA | 7.3 ± 0.7 | 9.0 ± 1.1* | 12.6 ± 0.9* | 15.5 ± 1.5* | 18.7 ± 1.7* | 9.7 ± 1.0 | 17.0 ± 2.8* |
| Vret, cm/s | |||||||
| CFA | 3.6 ± 0.5 | 3.1 ± 0.6 | 2.7 ± 0.6 | 0.5 ± 0.7* | 0.5 ± 0.4* | 5.9 ± 0.8 | 2.8 ± 0.6* |
| SFA | 3.9 ± 0.7 | 2.3 ± 0.3* | 1.4 ± 0.2* | 0.1 ± 0.6* | 0.3 ± 0.3* | 6.5 ± 0.7 | 3.2 ± 0.8* |
| PFA | 1.1 ± 0.2 | 1.0 ± 0.3 | 1.3 ± 0.2 | 1.1 ± 0.3 | 1.1 ± 0.4 | 2.5 ± 0.5 | 1.8 ± 0.2 |
| SRmean, s−1 | |||||||
| CFA | 28.9 ± 3.7 | 59.8 ± 12.2* | 88.5 ± 6.6* | 126.0 ± 11.9* | 126.3 ± 11.0* | 34.9 ± 1.9 | 107.1 ± 14.5* |
| SFA | 33.1 ± 2.4 | 96.4 ± 12.2* | 143.4 ± 5.0* | 185.5 ± 16.0* | 187.4 ± 14.6* | 37.8 ± 3.7 | 138.9 ± 28.8* |
| PFA | 44.0 ± 5.6 | 56.9 ± 10.4* | 81.6 ± 7.9* | 101.3 ± 11.7* | 124.1 ± 15.2* | 35.7 ± 5.5 | 98.4 ± 25.0* |
| SRant, s−1 | |||||||
| CFA | 44.0 ± 5.8 | 72.4 ± 10.7* | 99.6 ± 5.7* | 128.1 ± 10.4* | 128.2 ± 11.0* | 62.9 ± 4.3 | 120.1 ± 14.3* |
| SFA | 53.7 ± 5.6 | 108.5 ± 12.9* | 150.6 ± 5.0* | 185.9 ± 13.9* | 188.9 ± 14.7* | 77.6 ± 6.7 | 159.4 ± 28.6* |
| PFA | 52.0 ± 6.2 | 64.1 ± 9.3* | 91.1 ± 8.2* | 109.2 ± 12.2* | 132.7 ± 16.3* | 66.7 ± 7.1 | 120.7 ± 22.1* |
| SRret, s−1 | |||||||
| CFA | 15.1 ± 2.6 | 12.7 ± 2.1 | 11.2 ± 2.3* | 2.1 ± 2.9* | 1.9 ± 1.6* | 28.0 ± 4.1 | 13.0 ± 2.8* |
| SFA | 20.6 ± 4.1 | 12.1 ± 1.7* | 7.2 ± 0.8* | 0.5 ± 3.1* | 1.5 ± 1.5* | 39.8 ± 4.3 | 19.5 ± 4.7* |
| PFA | 8.0 ± 1.7 | 7.1 ± 1.9 | 9.5 ± 1.9 | 7.9 ± 2.6 | 8.6 ± 2.8 | 18.5 ± 4.7 | 13.0 ± 2.3 |
| OSI | |||||||
| CFA | 0.25 ± 0.02 | 0.16 ± 0.04* | 0.10 ± 0.02* | 0.02 ± 0.02* | 0.01 ± 0.01 | 0.30 ± 0.02 | 0.10 ± 0.02* |
| SFA | 0.27 ± 0.02 | 0.10 ± 0.02* | 0.05 ± 0.01* | 0.01 ± 0.02* | 0.01 ± 0.01 | 0.34 ± 0.01 | 0.12 ± 0.03* |
| PFA | 0.13 ± 0.03 | 0.12 ± 0.04 | 0.09 ± 0.02 | 0.07 ± 0.02* | 0.06 ± 0.02* | 0.21 ± 0.03 | 0.10 ± 0.01* |
Values are means ± SE for 8 participants. Vmean, time-averaged mean velocity; Vant, time-averaged anterograde velocity; Vret, time-average retrograde velocity; SRmean, mean shear rate; SRant, anterograde shear rate; SRret, retrograde shear rate; OSI, oscillatory shear index.
P < 0.05, significantly different from previous condition.
Fig. 5.

CFA blood flow and oscillatory shear index responses to single-leg heat stress and moderate whole body heat stress. Leg blood flow (A) and oscillatory shear index (B) in the CFA during single leg heat stress and moderate whole body heat stress (Tc + 1°C). Data are mean ± SE. *Significant change from baseline.
Relationship Between Hemodynamic Responses and Temperatures During Whole Body and Isolated Limb Heat Stress
Whole limb blood flow was closely related to T̄leg throughout both whole body and isolated leg heat stress (R2 = 0.77 and 0.56, respectively; P < 0.01; slopes: 0.19 ± 0.05 and 0.26 ± 0.04 l·min−1·°C−1; Fig. 6). During whole body heat stress, CFA (+0.93 l/min), SFA (+ 0.73 l/min), CFV (+ 0.71 l/min), and GSV (+ 0.23 l/min) all increased with increasing T̄leg, T̄sk, and Tc from baseline to conditions of intense heat stress (Tc + 1.5°C). Thereafter, no significant increases in flow were seen in any of these vessels, despite further increases in Tc and T̄sk of 0.5 and 0.4°C, respectively, during severe heat stress. PFA displayed a modest yet steady increase throughout the entire heat stress protocol (+ 0.16 l/min). Isolated limb cooling maintained intense whole body heat stress (Tc + 1.6°C) while simultaneously lowering T̄sk and Tsc to values similar to those seen at baseline (28.0 ± 1.6 vs. 32.4 ± 0.6°C and 31.5 ± 1.2 vs. 33.5 ± 0.7°C for T̄sk and Tsc, respectively; P > 0.05). Modest decreases in flow were observed in the CFA (−0.24 l/min), SFA (−0.19 l/min), PFA (−0.08 l/min), and CFV (−0.19 l/min; P < 0.05 for all) in parallel to the decline in T̄leg but not in the GSV (P > 0.05; Fig. 4).
Fig. 6.

Arterial blood flows vs. mean leg temperature during passive whole body and single leg heat stress. Data are represented as mean ± SE (large black squares) for baseline (thermoneutral), moderate (Tc + 1°C) and severe (Tc + 2°C) whole body heat stress. Single leg baseline and heat stress values are also displayed (large white squares). A: CFA. B: SFA. C: PFA. *Significantly higher than equivalent single leg heat stress value. Individual data points are also displayed (small circles); n = 8 for whole body heat stress and n = 7 for single leg heat stress.
To investigate the relationship between different hemodynamic responses within the leg and their respective tissue temperatures, additional blood flow measurements were made in the GSV and PFA during leg cooling following an arterial occlusion at the level of the knee (Fig. 7). Blood flow through the GSV (major drainage vessel of the skin and subcutaneous tissues of the thigh) was closely related to increases in surrounding Tsk throughout all stages of passive heat stress (R2 = 0.81; P < 0.001), with rapid increases in both responses being observed at the start of the protocol before a subsequent plateau in both when approaching severe heat stress. This relationship was lost when leg T̄sk and Tsc were rapidly cooled under conditions of high Tc, with GSV flow remaining virtually unaffected despite decreases in leg T̄sk and Tsc to levels lower than that recorded at baseline (25.9 ± 2.0 and 30.3 ± 1.3°C, respectively; P < 0.05). In contrast, blood flow through the PFA (main arterial supply to the deep tissues of the thigh) was closely related to both increases in local Tm during isolated leg heat stress (R2 = 0.59; P < 0.001) and the subsequent decreases in Tm observed during isolated leg cooling.
Fig. 7.

Relationships between local blood flow and temperatures during isolated single leg cooling following whole body heat stress. A: relationship between profunda femoral arterial flow (predominantly supplying deep tissues of the thigh) and local deep tissue temperature. Data are mean ± SE for 8 subjects. B: relationship between GSV blood flow (predominantly draining superficial tissues of the thigh) and local subcutaneous temperature during both severe whole body passive heat stress and subsequent local thigh cooling with arterial cuff occlusion. *Significantly higher than previous measurement. #Significantly lower than severe heat stress.
DISCUSSION
This study sought to characterize hemodynamic adjustments within the major arteries and veins of the human leg during exposure to passive heat stress and attempted to elucidate the relative contribution of local vs. core temperatures in leg blood flow distribution via the manipulation of different regional temperatures. Both single leg and intense whole body heat stress led to progressive increases in blood flow and shear rates supplying the three major arteries of the leg alongside the virtual abolition of oscillatory shear profiles within the vessels. While further elevations in heat stress to severe levels were not accompanied by any further increases in flow to the CFA or SFA, continued modest increases to the PFA occurred in line with rising muscle temperature. Isolated single leg heat stress provided equivalent increases in leg blood flow and improvements in OSI compared with moderate levels of whole body heat stress but without the accompanying elevations in Tc and cardiovascular strain. Blood flow in the GSV (major vessel draining the skin) and CFV (major vessel draining the entire leg) also increased progressively with the rise in both Tc and T̄leg, with the deep venous system accounting not only for blood flow returning from the deep tissues of the leg but also a significant proportion of blood flow from the skin and superficial tissues. In line with previous studies from this laboratory (7, 29), the strikingly similar hemodynamic responses to both isolated leg and moderate whole body heat stress in the face of significantly different Tc suggest that limb tissue hyperemia with heat stress to moderate levels is closely coupled to local temperature. However, as heat stress progressed to more severe levels, rapid cooling of a single leg while maintaining intense levels of whole body hyperthermia resulted in a small decrease in flow draining the superficial tissues alone, suggesting that increased Tc has no effect on deep tissue perfusion at any level of heat stress.
Leg Blood Flow Distribution and Shear Rate Profiles During Heat Stress
This study is the first to investigate the distribution of blood flow through each of the major arterial and venous vessels supplying and draining the leg from normothermic conditions to levels of skin and internal body hyperthermia approaching an individual's level of thermal tolerance. Arterial inflow to the leg increased in line with elevations in both T̄leg and Tc to levels of intense heat stress (Tc + 1.5°C), thereafter plateauing with exposure to severe heat stress (Fig. 3A). While the majority (∼80%) of the increase in leg blood flow was directed through the SFA supplying the superficial tissues of the thigh and the lower leg, a threefold increase in blood flow through the PFA was also observed throughout the duration of the protocol. With blood flow through the PFA supplying the thigh alone [confirmed in the present study by an unchanged blood flow during leg cuff occlusion (Fig. 3C) and previously in anatomical studies showing that this vessel predominantly perfuses deep tissues; Ref. 21], these observations strongly suggest a linear increase in skeletal muscle blood flow in response to increasing levels of heat stress; agreeing with a number of recent studies (7, 13, 16, 29) and further challenging the dogma that increases in limb blood flow during internal body and skin hyperthermia are confined to the skin alone (9, 10, 32).
Simultaneous measurements of blood flow through the GSV and subsequent estimations of flow through the CFV shed light into the distribution of blood flow draining the major venous vessels of the leg. The GSV is often described as the major drainage vessel of the skin circulation, but previous studies utilizing moderate levels of heat stress have suggested that up to 50% of the increase in skin blood flow is drained through the deep venous system (1), most likely via the multiple perforating vessels linking the superficial and deep venous veins. Findings from this study appear to support this notion, with only 40% of the 0.5 l/min increase in thigh blood flow (during leg occlusion) returning directly through the GSV. Expanding upon the prior study investigating leg venous return during moderate heat stress (1), we observed that further increases in whole body heat stress to intense levels (Tc + 1.5°C) led to further substantial increases in leg blood flow that were matched through increases in CFV blood flow alone, as GSV blood flow remained essentially unchanged (Fig. 4). Together, these observations suggest that isolated leg heating and whole body heating to moderate level of heat stress have the potential to increase venous blood flow to an equal extent in both the superficial and deep venous systems of the leg, but that any further increases in leg blood flow during more severe levels of heat stress are diverted to the deep venous system for return to the heart. With the deep venous system being particularly at risk of thrombotic events in certain patient populations where lower leg movement is restricted (2), these findings reveal the ability of passively induced hyperthermia to substantially increase deep venous flow independently of lower limb exercise, although whether this can be applied chronically to reduce thrombotic risk remains to be determined.
Another aim of this study was to characterize the blood flow profiles within the leg's major vessels to assess whether the present leg and whole body heat stress interventions enhance anti-atherogenic shear responses. Interestingly, we found that severe whole body heat stress led to a three- to fivefold increase in blood flow and mean shear rates and the complete abolition of oscillatory shear profiles within each of the major arteries of the leg (Table 2). While the increased cardiovascular strain associated with heat stress has the potential to be detrimental to both health and exercise capacity, the idea has previously been advanced that whole body or local heat stress may be an effective nonpharmacological means for improving cardiovascular health in certain clinical populations (6, 14, 19), with part of these improvements attributed to enhancements in vascular endothelial health resulting from increased anterograde and decreased retrograde shear rates (37, 39–41). The majority of studies to date looking at repeated heat exposure as a method of “thermal conditioning” have employed indirect or whole body heat stress to moderate levels (6, 14, 19). Here, we report that moderate whole body heat stress to Tc + 1°C has little additional benefit to leg blood flow and shear rate patterns in any of the major vessels supplying and draining the leg compared with those observed during isolated leg heat stress, with no significant difference observed in any variable in the CFA and PFA and only modest improvements in blood flow and OSI values recorded in the SFA. These findings show for the first time that localized limb heat stress has the potential to increase blood flow and anti-atherogenic shear rates in the major arterial vessels of the leg to levels equivalent to those seen during moderate whole body heat stress, although without the added cardiac strain (increase in heart rate of up to 20–30 beats/min and cardiac output of up to 2 l/min) and thermal discomfort associated with whole body heat stress protocols. Whether the magnitude of changes in flow profiles observed is sufficient to cause chronic endothelial adaptation in the leg and whether the same benefits are observed in elderly/clinical populations compared with the healthy study group reported here, however, remain to be investigated.
Temperature and Regulation of Leg Perfusion with Passive Heat Stress
The increases in leg blood flow (up to 0.9 l/min) and vascular conductance were closely related to local limb tissue temperatures (R2 = 0.77 and 0.56 for whole body and isolated leg heat stress, respectively; P < 0.01). These occurred despite noticeable differences in Tc and Q̇ between the two studies of 0.6°C and 2.1 l/min, respectively, agreeing with previous work from this laboratory indicating that local temperature-sensitive mechanisms account for the vast majority of increases in limb skin and deep tissue blood flow during whole body direct heat stress to moderate levels of core hyperthermia (7). This raises the question as to whether local temperature and/or temperature-sensitive mechanisms is/are also a critical regulatory factor when Tc increases further during intense and severe heat stress. Although the precise regulatory mechanisms of blood flow regulation were not tested in the current study, a number of observations support a critical role for local temperature-sensitive mechanisms during whole body heat stress to levels approaching those of an individual's thermal tolerance. Firstly, the slopes relating leg blood flow to local temperatures (T̄leg) during both isolated limb heat stress and all whole body heat stress conditions were comparable (0.26 ± 0.04 vs. 0.19 ± 0.05 l·min−1·°C−1; respectively, P = 0.32; Fig. 5), indicating that additional increases in Tc do not appear to alter the flow-to-temperature relationship during even severe levels of heat stress, and therefore suggesting a continued important role for local temperature in limb blood flow regulation under these conditions. These findings agree with recent research from this (7, 29) and other (13) laboratories but disagree with a number of classical studies in which the majority of limb vasomotor response to internal hyperthermia was attributed to central reflex mechanism (3, 11, 33). This fundamental difference in the contribution of central vs. local mechanisms, however, can most likely be attributed to the different methodological approaches employed to raise body temperature, with the use of indirect passive heating (11, 33) or lower body exercise (3) in previous studies resulting in increased Tc but relatively little increase in skin and deep tissue temperatures at the site of measurement in the forearm. This contrasts with the direct whole body heating approach in the current study, in which direct heating of the site of measurement resulted in rapid elevations of Tsk to ∼39°C, followed by gradual increases in Tm and Tc to 38.3 and 38.8°C, respectively, once a positive skin-to-subcutaneous tissue temperature gradient had been established. A second observation was that, despite a steady increase in Tc during whole body heat stress, the time course of increased tissue perfusion within the upper and lower portions of the leg in the current study differed in line with a differing increase in local tissue temperatures. In short, the presence of a rapid and sustained increase in Tthigh to ∼40°C during the early stages of whole body heating was accompanied by the attainment of a plateau in thigh blood flow during levels of moderate heat stress, despite Tc only being elevated by 1°C. In contrast, lower leg blood flow at the same core temperature remained relatively low in line with a slower warming of local temperatures at this site (∼36°C during moderate heat stress), with the majority of blood flow increases in this portion of the leg occurring between moderate and intense levels of Tc alongside further increases in both Tc and Tcalf. Taken together, these observations suggest that under the current form of heat stress, the direct heating of the site of measurement (both during isolated and whole body heat stress) results in local temperature-sensitive mechanisms accounting for the majority of the elevation in leg blood flow before Tc rises sufficiently to exert any significant vasodilatory effects through central temperature mediated reflexes.
To further investigate this hypothesis, we employed the use of two additional interventions following the attainment of severe heat stress. On the one hand, we employed a rapid single limb cooling protocol to quickly lower local temperatures while maintaining an overriding high Tc, while on the other hand, we occluded blood flow at the level of the knee and assessed the relationship between 1) Tsk and GSV flow (representing relative changes in skin tissue perfusion alone), and 2) Tm and PFA flow (major supplier to deep tissues of the thigh and taken to predominantly represent relative changes to skeletal muscle tissues alone). Rapid cooling of the leg following heat stress had no significant effects on GSV blood flow (Δ −19 ml/min; P > 0.05; Fig. 7B), despite drastic decreases in local Tsk to levels below those recorded at baseline (final value of ∼28°C compared with 33°C at baseline). These findings agree with previous heat stress studies where an overriding cutaneous vasodilation was found to be maintained during cooling from prior heat stress (5, 42, 45), presumably due to a continued vasodilatory response mediated through the sympathetic nervous system. A novel observation of this study was that in contrast to superficial tissue blood flow, deep tissue blood flow in the thigh following an occlusion at the level of the knee appeared to continue to be mediated solely at a local level during all stages of heat stress (Fig. 6A), with PFA blood flow not only increasing in a linear fashion with Tm to the limits of thermal tolerance but also decreasing at the same rate when local muscle tissues were rapidly cooled. This finding expands upon previous research showing the local control of skeletal muscle blood flow during moderate heat stress (13) by showing that this response is maintained throughout severe levels of heat stress (despite an accompanying plateau in skin blood flow) and can be reversed with local cooling even when Tc is significantly elevated. Although the molecular mechanisms underpinning these changes in flow distribution were not investigated in this study, there are a number of potential candidates that may be responsible. Significant increases in skin blood flow during heat stress is a well-documented phenomenon and has been shown to be mediated through multiple synergistic and redundant pathways that include, but are not limited to, central-sympathetic drive, axon-reflex responses, and a large nitric oxide component (17, 18, 23). In contrast to the cutaneous circulation, pathways responsible for the moderate increases in muscle blood flow are not as well documented but may involve temperature-dependent erythrocyte ATP release (15), shear-mediated nitric oxide release (28), and/or actions mediated through transient receptor potential vanilloid (TRPV) channels (12).
Experimental Considerations
There are a number of experimental considerations that need to be taken into account when interpreting the current findings. Firstly, the Modelflow technique for the estimation of Q̇ has previously been reported to underestimate increases in systemic blood flow during heat stress conditions when compared with invasive thermodilution techniques (38), and as such, Q̇ values reported here are lower than expected. If we assume a stable stroke volume response across all levels of heat stress as reported in most of the literature (8, 24, 35), the increase in Q̇ would amount to 4.9 l/min, rather than 3.3 l/min estimated by the Modelflow technique. This limitation has no bearing on findings of this study, however, as the primary outcome of changes in leg blood flow were measured using duplex-Doppler ultrasound. Secondly, it should be noted that different individuals were tested between study 1 and study 2, making this a between-subjects design rather than the gold standard within-subjects design. That said, we are confident that this study design remains robust due to 1) the careful selection of age- and sex-matched participants for study 2, and 2) a wealth of data from this laboratory over the years showing highly reproducible leg blood flows with this method of heat stress during both local and whole body heating (∼ 0.3 l·min−1·°Cmuscle−1) (7, 29, unpublished data). This reproducibility is also supported in the current study by the individual data points displayed in Fig. 6.
Conclusions
Passive whole body heat stress that includes direct heating of the legs leads to substantial increases in blood flow and shear rates to all major arteries and veins supplying and draining the leg alongside a virtual abolition of oscillatory shear profiles within the vessels. The increase in skin blood flow during moderate to severe heat stress appears to be drained predominantly through the deep venous systems of the leg, with blood flow through the GSV plateauing before this point. These changes in limb tissue blood flow are predominantly mediated through local mechanisms, resulting in similar hemodynamic responses during both isolated limb and moderate whole body heat stress. As heat stress progresses to more severe levels, elevated core temperatures affect skin but not skeletal muscle circulations, as evidenced by the close association between local temperature changes and muscle, but not skin, blood flows when core temperatures are elevated. These findings further our knowledge of leg hemodynamic responses during heat stress and provide evidence of potentially beneficial vascular alterations during isolated limb heat stress that are equivalent to those experienced during exposure to moderate levels of whole body hyperthermia. Previous research in the human forearm has shown that repeated increases in blood flow and shear rates within the brachial artery result in chronic beneficial adaptations to the vasculature (6, 25). Further studies using validated measures of subclinical endothelial function and vascular health, alongside studies elucidating mechanistic responses, are required to establish whether these hemodynamic changes have the potential to exert a chronic beneficial effect in a variety of patient populations.
DISCLOSURES
No conflicts of interest, financial or otherwise, are declared by the author(s).
AUTHOR CONTRIBUTIONS
Author contributions: S.T.C. and J.G.-A. conception and design of research; S.T.C., S.J.T., and J.G.-A. performed experiments; S.T.C. analyzed data; S.T.C., S.J.T., and J.G.-A. interpreted results of experiments; S.T.C. prepared figures; S.T.C. drafted manuscript; S.T.C., S.J.T., and J.G.-A. edited and revised manuscript; S.T.C., S.J.T., and J.G.-A. approved final version of manuscript.
ACKNOWLEDGMENTS
We thank all of the participants for time, effort, and commitment to the studies. We also thank the reviewers for constructive comments and suggestions during the submission of the manuscript.
Present address of S.T. Chiesa: UCL Institute of Cardiovascular Science, London, UK.
Present address of S. J. Trangmar: Dept. of Life Sciences, University of Roehampton, London, UK.
REFERENCES
- 1.Abraham P, Leftheriotis G, Desvaux B, Saumet M, Saumet JL. Venous return in lower limb during heat stress. Am J Physiol Heart Circ Physiol 267: H1337–H1340, 1994. [DOI] [PubMed] [Google Scholar]
- 2.Anderson FA, Spencer FA. Risk factors for venous thromboembolism. Circulation 107: 9–16, 2003. [DOI] [PubMed] [Google Scholar]
- 3.Blair DA, Glover WE, Roddie IC. Vasomotor fibres to skin in the upper arm, calf and thigh. J Physiol 153: 232–238, 1960. [DOI] [PMC free article] [PubMed] [Google Scholar]
- 4.Bland JM, Altman DG. Calculating correlation coefficients with repeated observations: part 1–correlation within subjects. BMJ 310: 446, 1995. [DOI] [PMC free article] [PubMed] [Google Scholar]
- 5.Brengelmann GL, Wyss C, Rowell LB. Control of forearm skin blood flow during periods of steadily increasing skin temperature. J Appl Physiol 35: 77–84, 1973. [DOI] [PubMed] [Google Scholar]
- 6.Carter HH, Spence AL, Atkinson CL, Pugh CJA, Naylor LH, Green DJ. Repeated core temperature elevation induces conduit artery adaptation in humans. Eur J Appl Physiol 114: 859–865, 2014. [DOI] [PubMed] [Google Scholar]
- 7.Chiesa ST, Trangmar SJ, Kalsi KK, Rakobowchuk M, Banker DS, Lotlikar MD, Ali L, González-Alonso J. Local temperature-sensitive mechanisms are important mediators of limb tissue hyperemia in the heat-stressed human during rest and small muscle mass exercise. Am J Physiol Heart Circ Physiol 309: H369–H380, 2015. [DOI] [PMC free article] [PubMed] [Google Scholar]
- 8.Damato AN, Lau SH, Stein E, Haft JI, Kosowsky B, Cohen SI. Cardiovascular response to acute thermal stress (hot dry environment) in unacclimatized normal subjects. Am Heart J 76: 769–74, 1968. [DOI] [PubMed] [Google Scholar]
- 9.Detry JM, Brengelmann GL, Rowell LB, Wyss C. Skin and muscle components of forearm blood flow in directly heated resting man. J Appl Physiol 32: 506–511, 1972. [DOI] [PubMed] [Google Scholar]
- 10.Edholm OG, Fox RH, Macpherson RK. The effect of body heating on the circulation in skin and muscle. J Physiol 134: 612–619, 1956. [DOI] [PMC free article] [PubMed] [Google Scholar]
- 11.Edholm OG, Fox RH, MacPherson RK. Vasomotor control of the cutaneous blood vessels in the human forearm. J Physiol 139: 455–465, 1957. [DOI] [PMC free article] [PubMed] [Google Scholar]
- 12.Gifford JR, Ives SJ, Park SY, Andtbacka RH, Hyngstrom JR, Mueller MT, Treiman GS, Ward C, Trinity JD, Richardson RS. α1- and α2-Adrenergic responsiveness in human skeletal muscle feed arteries: the role of TRPV ion channels in heat-induced sympatholysis. Am J Physiol Heart Circ Physiol 307: H1288–H1297, 2014. [DOI] [PMC free article] [PubMed] [Google Scholar]
- 13.Heinonen I, Brothers RM, Kemppainen J, Knuuti J, Kalliokoski KK, Crandall CG. Local heating, but not indirect whole body heating, increases human skeletal muscle blood flow. J Appl Physiol 111: 818–824, 2011. [DOI] [PMC free article] [PubMed] [Google Scholar]
- 14.Imamura M, Biro S, Kihara T, Yoshifuku S, Takasaki K, Otsuji Y, Minagoe S, Toyama Y, Tei C. Repeated thermal therapy improves impaired vascular endothelial function in patients with coronary risk factors. J Am Coll Cardiol 38: 1083–1088, 2001. [DOI] [PubMed] [Google Scholar]
- 15.Kalsi KK, González-Alonso J. Temperature-dependent release of ATP from human erythrocytes: mechanism for the control of local tissue perfusion. Exp Physiol 97: 419–432, 2012. [DOI] [PMC free article] [PubMed] [Google Scholar]
- 16.Keller DM, Sander M, Stallknecht B, Crandall CG. α-adrenergic vasoconstrictor responsiveness is preserved in the heated human leg. J Physiol 588: 3799–3808, 2010. [DOI] [PMC free article] [PubMed] [Google Scholar]
- 17.Kellogg DL Jr, Liu Y, Kosiba IF, O'Donnell D. Role of nitric oxide in the vascular effects of local warming of the skin in humans. J Appl Physiol 86: 1185–1190, 1999. [DOI] [PubMed] [Google Scholar]
- 18.Kellogg DL Jr, Pergola PE, Piest KL, Kosiba WA, Crandall CG, Grossmann M, Johnson JM. Cutaneous active vasodilation in humans is mediated by cholinergic nerve cotransmission. Circ Res 77: 1222–1228, 1995. [DOI] [PubMed] [Google Scholar]
- 19.Kihara T, Biro S, Imamura M, Yoshifuku S, Takasaki K, Ikeda Y, Otuji Y, Minagoe S, Toyama Y, Tei C. Repeated sauna treatment improves vascular endothelial and cardiac function in patients with chronic heart failure. J Am Coll Cardiol 39: 754–759, 2002. [DOI] [PubMed] [Google Scholar]
- 20.Kroger K, Kucharczik A, Hirche H, Rudofsky G. Atherosclerotic lesions are more frequent in femoral arteries than in carotid arteries independent of increasing number of risk factors. Angiology 50: 649–654, 1999. [DOI] [PubMed] [Google Scholar]
- 21.Mamatha H, D'souza AS, Jessica S, Suhani S. A cadaveric study on the variations in the origin, course and branching pattern of the profunda femoris artery. Int J Cur Res Rev 4: 137–145, 2012. [Google Scholar]
- 22.Mekjavic IB, Rempel ME. Determination of esophageal probe insertion length based on standing and sitting height. J Appl Physiol 69: 376–379, 1990. [DOI] [PubMed] [Google Scholar]
- 23.Minson CT, Berry LT, Joyner MJ. Nitric oxide and neurally mediated regulation of skin blood flow during local heating. J Appl Physiol 91: 1619–1626, 2001. [DOI] [PubMed] [Google Scholar]
- 24.Minson CT, Wladkowski SL, Cardell AF, Pawelczyk JA, Kenney WL. Age alters the cardiovascular response to direct passive heating. J Appl Physiol 84: 1323–1332, 1998. [DOI] [PubMed] [Google Scholar]
- 25.Naylor LH, Carter H, FitzSimons MG, Cable NT, Thijssen DH, Green DJ. Repeated increases in blood flow, independent of exercise, enhance conduit artery vasodilator function in humans. Am J Physiol Heart Circ Physiol 300: H664–H669, 2011. [DOI] [PubMed] [Google Scholar]
- 26.Ogawa T, Lurie F, Kistner RL, Eklof B, Tabrah FL. Reproducibility of ultrasound scan in the assessment of volume flow in the veins of the lower extremities. J Vasc Surg 35: 527–531, 2002. [DOI] [PubMed] [Google Scholar]
- 27.Ooue A, Ichinose-Kuwahara T, Shamsuddin AK, Inoue Y, Nishiyasu T, Koga S, Kondo N. Changes in blood flow in a conduit artery and superficial vein of the upper arm during passive heating in humans. Eur J Appl Physiol 101: 97–103, 2007. [DOI] [PubMed] [Google Scholar]
- 28.Paniagua OA, Bryant MB, Panza JA. Role of endothelial nitric oxide in shear stress-induced vasodilation of human microvasculature : diminished activity in hypertensive and hypercholesterolemic patients. Circulation 103: 1752–1758, 2001. [DOI] [PubMed] [Google Scholar]
- 29.Pearson J, Low DA, Stöhr E, Kalsi K, Ali L, Barker H, González-Alonso J. Hemodynamic responses to heat stress in the resting and exercising human leg: insight into the effect of temperature on skeletal muscle blood flow. Am J Physiol Regul Integr Comp Physiol 300: R663–R673, 2011. [DOI] [PMC free article] [PubMed] [Google Scholar]
- 30.Rådegran G. Limb and skeletal muscle blood flow measurements at rest and during exercise in human subjects. Proc Nutr Soc 58: 887–898, 1999. [DOI] [PubMed] [Google Scholar]
- 31.Ramanathan NL. A new weighting system for mean surface temperature of the human body. J Appl Physiol 19: 531–533, 1964. [DOI] [PubMed] [Google Scholar]
- 32.Roddie IC, Shepherd JT, Whelan RF. Evidence from venous oxygen saturation measurements that the increase in forearm blood flow during body heating is confined to the skin. J Physiol 134: 444–450, 1956. [DOI] [PMC free article] [PubMed] [Google Scholar]
- 33.Roddie IC, Shepherd JT, Whelan RF. The contribution of constrictor and dilator nerves to the skin vasodilatation during body heating. J Physiol 136: 489–497, 1957. [DOI] [PMC free article] [PubMed] [Google Scholar]
- 34.Rowell LB, Blackmon JR, Bruce RA. Indocyanine green clearance and estimated hepatic blood flow during mild to maximal exercise in upright man. J Clin Invest 43: 1677–1690, 1964. [DOI] [PMC free article] [PubMed] [Google Scholar]
- 35.Rowell LB, Brengelmann GL, Murray JA. Cardiovascular responses to sustained high skin temperature in resting man. J Appl Physiol 27: 673–680, 1969. [DOI] [PubMed] [Google Scholar]
- 36.Rowell LB, Marx HJ, Bruce RA, Conn RD, Kusumi F. Reductions in cardiac output, central blood volume, and stroke volume with thermal stress in normal men during exercise. J Clin Invest 45: 1801–1816, 1966. [DOI] [PMC free article] [PubMed] [Google Scholar]
- 37.Schreuder TH, Green DJ, Hopman MT, Thijssen DH. Acute impact of retrograde shear rate on brachial and superficial femoral artery flow-mediated dilation in humans. Physiol Rep 2: e00193, 2014. [DOI] [PMC free article] [PubMed] [Google Scholar]
- 38.Shibasaki M, Wilson TE, Bundgaard-Nielsen M, Seifert T, Secher NH, Crandall CG. Modelflow underestimates cardiac output in heat-stressed individuals. Am J Physiol Regul Integr Comp Physiol 300: R486–R491, 2011. [DOI] [PMC free article] [PubMed] [Google Scholar]
- 39.Thijssen DH, Dawson EA, Tinken TM, Cable NT, Green DJ. Retrograde flow and shear rate acutely impair endothelial function in humans. Hypertension 53: 986–992, 2009. [DOI] [PubMed] [Google Scholar]
- 40.Tinken TM, Thijssen DH, Hopkins N, Black MA, Dawson EA, Minson CT, Newcomer SC, Laughlin MH, Cable NT, Green DJ. Impact of shear rate modulation on vascular function in humans. Hypertension 54: 278–285, 2009. [DOI] [PMC free article] [PubMed] [Google Scholar]
- 41.Tinken TM, Thijssen DH, Hopkins N, Dawson EA, Cable NT, Green DJ. Shear stress mediates endothelial adaptations to exercise training in humans. Hypertension 55: 312–318, 2010. [DOI] [PubMed] [Google Scholar]
- 42.Vuksanović V, Sheppard LW, Stefanovska A. Nonlinear relationship between level of blood flow and skin temperature for different dynamics of temperature change. Biophys J 94: L78–L80, 2008. [DOI] [PMC free article] [PubMed] [Google Scholar]
- 43.Wang W, Wang Z, Faith MS, Kotler D, Shih R, Heymsfield SB. Regional skeletal muscle measurement: evaluation of new dual-energy X-ray absorptiometry model. J Appl Physiol 87: 1163–1171, 1999. [DOI] [PubMed] [Google Scholar]
- 44.Wesseling KH, Jansen JR, Settels JJ, Schreuder JJ. Computation of aortic flow from pressure in humans using a nonlinear, three-element model. J Appl Physiol 74: 2566–2573, 1993. [DOI] [PubMed] [Google Scholar]
- 45.Wyss CR, Brengelmann GL, Johnson JM, Rowell LB, Silverstein D. Altered control of skin blood flow at high skin and core temperatures. J Appl Physiol 38: 839–845, 1975. [DOI] [PubMed] [Google Scholar]