

Abstract
Functional near‐infrared spectroscopy (fNIRS) is a non‐invasive brain imaging technology that uses light to measure changes in cortical hemoglobin concentrations. FNIRS measurements are recorded through fiber optic cables, which allow the participant to wear the fNIRS sensors while standing upright. Thus, fNIRS technology is well suited to study cortical brain activity during upright balance, stepping, and gait tasks. In this study, fNIRS was used to measure changes in brain activation from the frontal, motor, and premotor brain regions during an upright step task that required subjects to step laterally in response to visual cues that required executive function control. We hypothesized that cognitive processing during complex stepping cues would elicit brain activation of the frontal cortex in areas involved in cognition. Our results show increased prefrontal activation associated with the processing of the stepping cues. Moreover, these results demonstrate the potential to use fNIRS to investigate cognitive processing during cognitively demanding balance and gait studies. Hum Brain Mapp 34:2817–2828, 2013. © 2012 Wiley Periodicals, Inc.
Keywords: step‐initiation, gait, near‐infrared spectroscopy
INTRODUCTION
Mobility dysfunction in older adults can markedly affect function and quality of life and is associated with an increased risk of injury or death [Hoskin, 1998; Kannus et al., 1999; Studenski et al., 2011; Tinetti et al., 1994]. Previous research has demonstrated that executive function plays an important role in balance control and gait, especially in older adults [Brown et al., 1999; Redfern et al., 2001; Shumway‐Cook et al., 1997; Stelmach et al., 1989; Teasdale and Schmidt, 1991]. In particular, executive function is believed to be required for the preparation, maintenance, and processing of effortful tasks and for the coordination of multiple simultaneous tasks [Hartley et al., 1992]. Several recent dual‐task studies have shown an increased interference effect between executive function and mobility tasks during cognitive tasks such as trail making tests [Breteler et al., 1994; Manolio et al., 1994; O'Sullivan et al., 2004; Ylikoski et al., 1993], digit symbol substitution tests [Manolio et al., 1994; O'Sullivan et al., 2004], simple reaction time [SRT; Almkvist et al., 1992], speed of information processing [Burton et al., 2003, 2004; Junque et al., 1990], and attention tasks [Burton et al., 2003, 2004; Ylikoski et al., 1993]. These interference effects are more pronounced in older subjects, which suggest that gait and balance tasks may require more involvement from cognitive areas in the aged brain and that recruitment of these regions might somehow compensate for the normal effects of aging on posture (e.g. [Reuter‐Lorenz, 2008]). This concept has clinical implications, because gait and posture require situational awareness, attention, and other general cognitive activities akin to many of the variations of the experimental dual‐task condition. Thus, metrics of dual‐task interference have formed the basis for several proposed functional balance assessment tests for potential clinical diagnosis [Bloem et al., 2001; Lundin‐Olsson et al., 1997; Means et al., 1998]. However, despite the apparent interplay between cognitive and motor function in the brain, little is known about the neural basis of this cognitive‐motor interference as it pertains to mobility and balance.
In part, brain imaging during dual‐task or complex gait and posture tasks is hampered by technology. Over the last few decades, neuroimaging techniques such as positron emission tomography and functional magnetic resonance imaging (fMRI) have been developed to measure local changes in cerebral oxygenation and blood flow evoked during functional tasks (reviewed in Bakker et al. 2007). fMRI in particular has become an invaluable tool in the investigation of executive function regions in the brain. However, because fMRI requires participants to remain motionless in a supine position inside of a MRI magnet, this method does not easily allow the study of brain function during weight‐bearing ambulation. To date, fMRI of mobility has been limited to studies involving motor imagery or very limited foot or ankle movements in which the head of the participant must remain still [Bakker et al., 2008; Jahn et al., 2004]. These studies have confirmed that the expected regions of the motor cortex are involved in movement (including imagined movement) as well as cortical regions such as the superior temporal gyrus and peri‐insular vestibular cortex that play a role in the control of balance [Dieterich and Brandt, 2008].
The objective of this study was to examine the role of cognitive regions of the brain, particularly the dorsal–lateral prefrontal cortex (DLPFC), in the planning and execution of complex step movement. Based on similar nonambulatory interference task studies (e.g. [Liu et al., 2004]), we hypothesized that the DLPFC would be engaged during a complex choice‐step reaction task. Moreover, our goal was to assess the feasibility of using a novel brain imaging technology called functional near‐infrared spectroscopy (fNIRS) during upright movement tasks.
What Is fNIRS?
Functional near‐infrared spectroscopy (fNIRS) is a noninvasive technology that uses light to measure changes in the hemodynamic state of the brain [Cope et al., 1988; Jobsis, 1977; Obrig and Villringer, 2003]. In brief, fNIRS uses low levels (<0.2 W/cm2) of nonionizing red (690 nm) and near‐infrared (830 nm) colored light that is directed into the brain using flexible fiber optic cables placed in a cap worn on the surface of the head (as shown in Fig. 1). A fiber optic cable and camera records the amount of light that transmits through the head from a source to a detector position. By recording changes in how much light the brain absorbs at each color, the modified Beer–Lambert law [Cope et al., 1988] can be used to convert the measured light intensities into changes in oxy‐ and deoxyhemoglobin in the underlying brain. By placing the fiber optic cables at different spatial locations on the head, this brain activity can be localized to different areas with a lateral spatial resolution of a few centimeters (see Boas et al. 2004 for review). At these wavelengths, light from outside the surface of the scalp can penetrate up to several centimeters into the head and deep enough to reach the outer 5–8 mm of the brain cortex [Boas and Dale, 2005]. Previous work has demonstrated correlation between fNIRS and fMRI activations during motor tasks from concurrent multimodal recordings (reviewed in Steinbrink et al. 2006).
Figure 1.
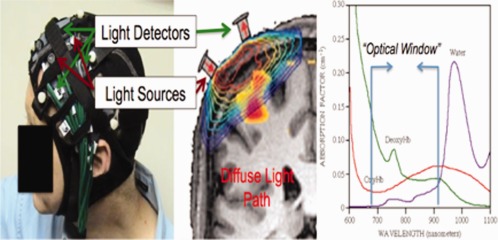
Functional near‐infrared spectroscopy (fNIRS) is used to noninvasively measure changes in oxy‐ and deoxyhemoglobin in the brain. A grid of fiber optic‐based light sources and detectors is mounted into a flexible head cap worn by the participant (left). Each of these source‐detector pairs measures light from a diffuse volume of tissue beneath the pair (center). This light can reach ∼ 5–8 mm into the cortex at a source‐detector spacing of 3.2 cm. [Color figure can be viewed in the online issue, which is available at http://wileyonlinelibrary.com.]
To date, a small number of studies have been published showing that it is possible to use fNIRS to measure brain activation signals from the motor cortex regions in upright and mobile individuals, including simple motor tasks such as walking [Harada et al., 2009; Miyai et al., 2001, 2002, 2003, 2006]. In particular, their studies have shown that fNIRS can be used to detect differences between slow and fast‐walking evoked activations [Harada et al., 2009; Miyai et al., 2001, 2002]. Of significance to this study is that when attention demands have been increased presumably due to increase in walking speed, activation of the prefrontal cortex has been reported [Harada et al., 2009].
METHODS
In this section, we will describe our experimental design, fNIRS instrumentation, and data analysis. Additional background information about the setup and analysis of fNIRS studies can be found in several review articles (e.g. instrumentation [Abdelnour and Huppert, 2009; Franceschini et al., 2006]; analysis [Huppert et al., 2009]; assumptions and limitations [Boas et al., 2005, 2001]).
Subjects
A total of 10 healthy, young‐adult subjects (ages 21–47 years; 5 males/5 females) were recruited for this study. University of Pittsburgh Institutional Review Board approved this study, and all subjects provided written informed consent. None of our subjects had any self‐reported history of falling or diagnosed balance disorders. During the study, subjects were placed in a support vest and harnessed to an overhead carriage to maintain subject stability and prevent falls (as shown in Fig. 2). This harness has been used in previous studies and does not interfere with stepping ability [Sparto et al., 2008].
Figure 2.
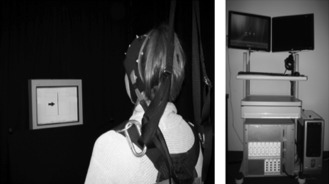
The fNIRS optical cap was worn by participants while standing on force plates for the stepping task (left). The fNIRS instrument (right) was positioned outside the testing room, and signals were recorded through long fiber optic cables (not shown) that connect the instrument to the fNIRS head cap.
Experimental Procedure
fNIRS was used to study the brain responses to a choice‐step reaction time task [Boas et al., 2001]. Similar tasks have previously shown predictive value in risk of falling in elderly adults [Lord and Fitzpatrick, 2001]. The task is based on interference between directional cues provided by arrows and the strong tendency for subjects to respond in the direction that a stimulus is located (this is also known as the Simon effect [Simon and Small, 1969], a well‐studied phenomenon in experimental psychology). Subjects were shown an arrow pointing left or right that was displayed on either the left of right side of the monitor (see Fig. 3). When a right‐pointing arrow was displayed on the right side of the monitor, the information about the directional cue and the spatial location of the stimulus was congruent, that is, both pieces of information conveyed a right step. When a left‐pointing arrow was displayed on the right side of the monitor, the information about the directional cue and spatial location was incongruent, and the direction of the step depended on the instructions that were provided to the subject before the block. One set of instructions required the subjects to step in the direction that the arrow was pointing (i.e., direction cues; Fig. 3). The other set of instructions required the subjects to step laterally toward the side in which the arrow was located (i.e., position cues). The visual cues were displayed on a 20″ cathode ray tube monitor set at eye height, 1 m from the subject. Thus, the horizontal display of the screen encompassed a visual arc of 23°.
Figure 3.
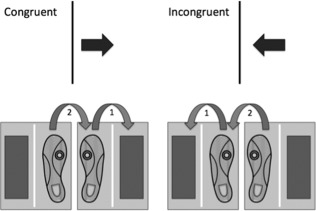
For the CRT:DIR blocks, subjects stepped in the direction that the arrow was pointing. During congruent trials, the arrow direction and position conveyed similar meanings (step to the right). During incongruent trials, the arrow direction and location conveyed different meanings (step to the left).
Eight imaging scans, each consisting of 32 trials, were presented in an event‐related fashion for each of the 10 subjects. The first scan was a SRT step task, which consisted primarily of subjects stepping to the left in response to a left‐pointing arrow being displayed on the left side of the display monitor (80% of the trials). Twenty percent of the trials were catch trials in which no arrows were displayed, and no steps were taken. The purpose of the catch trials was to prevent anticipation of the stimuli. The second scan was an SRT step task with right‐pointing arrows displayed on the right side of the monitor, resulting in steps to the right; again with 20% catch trials. The remainder of the scans involved choice reaction time (CRT) step tasks that are based on tests of executive function [Jennings et al., 2011; Nassauer and Halperin, 2003] In the CRT scans, left‐pointing arrows were displayed either on the left (20% of the trials) or right (20%) side of the monitor. Similarly, right‐pointing arrows were displayed either on the left (20%) or right (20%). The remaining 20% of the trials were catch trials. Trials in which the direction of the arrow and the side of the monitor it appeared on were the same are congruent. Trials in which the direction and side are different (i.e., right arrow on left side of monitor) are incongruent. The trials were displayed in random order. During odd‐numbered scans starting with scan 3, subjects were given instructions to step in the direction that the arrow was pointing (CRT:DIR). Finally, during even‐numbered blocks starting with scan 4, subjects were given instructions to step toward the side in which the arrow was located (CRT:POS). E‐Prime 1.0 (Psychology Software Tools) was used for the stimulus display. Nine of the 10 subjects completed all eight scans, and one subject asked to stop after performing six scans due to prior time commitments.
Immediately before each scan of simple or choice stepping, subjects practiced that condition. Subjects were able to master the protocol within five practice steps. For each step, the subjects were instructed to (a) bear weight equally on both feet, (b) step as quickly as possible to a target footfall location placed on the ground after seeing the appropriate visual stimulus, and (c) follow with the trailing leg until they came to a stop in the upright standing position. The target footfall location was placed laterally to the starting position at a distance of one‐third of the subjects' leg length. Subjects were instructed to move with both legs, so that they generated motor responses that would be similar to those seen during step initiation, rather than just moving one leg to a new location. Although we did not measure the accuracy of step placement, subjects were given verbal feedback and encouraged to accurately step to the location.
The presentation of the visual cues was controlled by a synchronizing pulse sent by National Instruments hardware and software, with a temporal resolution of 1 ms. After the step was completed with both feet and the subject returned to the starting position, the next stimulus occurred randomly during an 4–8 s window only after the subjects achieved a relatively equal weight distribution on both feet. A minimum delay of 4 s was used to ensure linearity of the hemodynamic response.
fNIRS Instrumentation
A 32‐channel continuous wave fNIRS instrument was used (CW6 Real‐time system; TechEn, Milford MA), as detailed in previous work [Abdelnour and Huppert, 2009]. Only 8 of the 32 detector channels were used for this study because of limitations in setup time and greater sensitivity of large fNIRS head caps to motion artifacts during subject movement. Consequently, a total of 15 source‐detector combinations at each wavelength were used, based on a nearest‐neighbor measurement geometry with a source‐detector spacing of 3.2 cm (Fig. 4). This instrument uses two wavelengths of light at 690 (12 mW) and 830 nm (8 mW) to provide sensitivity to both oxy‐ and deoxyhemoglobin changes in the brain. This light was delivered via fiber optic cables to a grid of source positions, called optodes, distributed over the head within a neoprene cap (Fig. 4). The cap was placed on the subject's head so as to position the fNIRS probe properly across the prefrontal and premotor cortexes of the left hemisphere and then anchored in place to prevent slippage during subject movement. The fibers, exiting via an opening in the top of the neoprene cap, were tethered above the subject to allow for free range of motion during the stepping task. A separate set of detector optodes and fiber optic cables carried the light back to the fNIRS instrument where it was then measured and digitized at a rate of 4 Hz. Ten‐meter long fiber‐optic cables transmitted data from the subject while the instrument was located outside the testing room. The subject was able to freely move within the safety harness without causing artifacts in the fNIRS signals as long as the optical probe and head cap remained fixed on the head.
Figure 4.
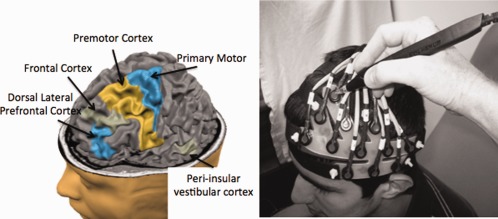
Based on previous fMRI studies, the left dorsal–lateral prefrontal cortex (DLPFC; BA 46), superior and inferior frontal cortex, inferior temporal gyrus (peri‐insular vestibular cortex; PIVC), premotor (BA 6), and primary (BA 4), and secondary motor cortices were targeted. The fNIRS sensors were mounted into a cap (shown without the neoprene hood for clarity on the right; also see Fig 1). A three‐dimensional wand (Polhemus) was used to mark the location of the sensors for later registration to structural MRI information. The image above (left) was generated using the BrainVoyager tutorial (http://www.brainvoyager.com). [Color figure can be viewed in the online issue, which is available at http://wileyonlinelibrary.com.]
During data collection, fNIRS data were displayed in real time to the operator as described in Abdelnour and Huppert 2009. This allowed verification of the signal quality and the absence of motion artifacts. The synchronizing pulse that controlled the cue presentation was also recorded by the NIRS instrument on one of eight analog channels.
Anatomical Registration of fNIRS Data
Before recording brain signals, the position of the fNIRS probe was registered on the head of each subject for the purpose of intersubject data registration and image reconstruction. A handheld three‐dimensional, FastSCAN stylus (Polhemus; Colchester, VT) was used to mark the location of each of the fNIRS detector optodes and additional landmark points on the subject's head (ears, nasion, inion, and top of head). A custom‐written navigation software program allowed immediate visualization of the location of the fNIRS probe relative to an atlas MRI (Colin 27 atlas [Holmes et al., 1998]) and verification that the probe was correctly positioned over the anticipated regions‐of‐interest (prefrontal cortex, frontal cortex, motor/premotor cortices, and peri‐insular vestibular cortex). The positioning of the probe was based on these atlas‐based locations as shown in Figure 4, which shows the locations of the DLPFC (BA 46), premotor cortex (BA 6), and primary motor cortex (BA 4) relative to the NIRS probe. Before data collection, the location of the fNIRS probe was verified with respect to the atlas locations and repositioned if necessary to center the probe over the expected brain regions.
Data Analysis
Analysis of fNIRS data consisted of four steps: (i) analysis of force‐plate data to identify onset of the steps and infer the amount of cognitive load for the different step task conditions [Sparto et al., 2008], (ii) analysis of the parametric stepping responses using a fNIRS‐specific general linear model [Abdelnour and Huppert, 2009; Ye et al., 2009], (iii) intrasubject registration of the location of the fNIRS sensors via the three‐dimensional Polhemus data [Abdelnour and Huppert, 2011], and (iv) reconstruction of the group‐level oxy‐ and deoxyhemoglobin images using a random‐effect model [Abdelnour and Huppert, 2011]. These steps will now be described in detail.
Analysis of Step Onset
Ground reaction forces generated during the steps were measured using two Bertec 5050 force platforms interfaced with National Instruments hardware and software. The lateral step responses induced vertical ground reaction force (VGRF) curves that most typically resembled Figure 5. The first deflection of the VGRF is the onset of the first postural adjustment (PA). The liftoff (LO) time occurs when all weight has been shifted to the stance leg and the VGRF under the first stepping leg goes to 0.
Figure 5.
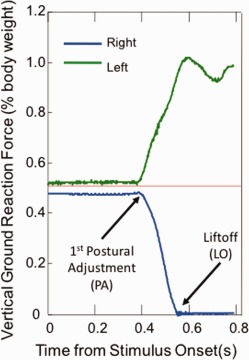
Typical vertical ground reaction force recordings, as a percentage of body weight, during a right step for a young adult subject. Stimulus onset occurs at time = 0. Onset of first postural adjustment (PA) and liftoff (LO) designated by arrows. [Color figure can be viewed in the online issue, which is available at http://wileyonlinelibrary.com.]
Although the PA and LO include peripheral muscle activation times, the duration of this process should be consistent across the SRT and CRT blocks. For each condition (SRT, CRT:DIR CON, CRT:DIR INCON, CRT:POS CON, and CRT:POS INCON), the median time of PA and LO was computed separately for left and right steps for each subject.
Any delays observed in the CRT steps relative to the SRT steps should be primarily determined by delays that occur in the central processing, because the conduction times in the peripheral sensory and motor systems should be consistent across tasks. Differences in the median time between the SRT and CRT conditions were tested using the paired t‐tests with α = 0.05.
Analysis of Brain Activity
Analysis of fNIRS data was based on a spatial‐temporal version of the general linear model [Ye et al., 2009]. This approach is similar to the standard model used for the analysis of fMRI data via a canonical general linear model (e.g. [Friston, 2007]). The average error rate for each of the stepping conditions was around 1–2% (out of around 256 stepping trials per subject). These erroneous trials were included in the analysis. A custom Matlab (Mathworks, Natick MA) script was used to process the fNIRS data. In brief, based on the onset times and identity of the stimulus events, a design matrix was constructed using the first two derivatives of a gamma‐variant function (five total canonical functions) as a model of the expected hemodynamic response. In addition, a series of discrete cosine transform terms (0–1/120 Hz) were used as nuisance regressors to remove slow drift [Ye et al., 2009]. The model of light propagation in the head was used to model an inhomogeneous random field in the model [Abdelnour and Huppert, 2011]. A similar model had been previously proposed by Ye et al. 2009 that used a spline interpolation function. In this work, we have used a probe‐specific finite element diffusion model of light diffusion through the head [Abdelnour et al., 2009]. Restricted maximum likelihood with a second‐order autoregressive noise term was used to estimate the noise statistics (prewhitening), and the linear model was solved using the Gauss–Markov equation (see Friston 2007). Temporal analysis was performed on a per subject basis, and the estimated weight coefficients and error models were then used for group‐level statistics as described in Abdelnour and Huppert 2011.
Intersubject Registration
Before collection of the fNIRS data, a three‐dimensional camera (Polhemus) was used to mark the location of the optical sensors relative to the nasion, inion, and ear‐lobe fiducial locations (see Fig. 4). This registration information was then used to register the location of the optical sensors to an anatomical MRI head using a custom registration algorithm [Abdelnour and Huppert, 2011]. In this study, the Colin27 MRI atlas [Holmes et al., 1998] was used based on previous work by Custo et al. 2006, which demonstrated that atlas‐based registration was sufficient for modeling light paths through the head of healthy, normal, subjects. Based on that work, we believe that the atlas‐based models are appropriate for our current subject population, but we recognize that this approach would not work for extension of these methods across distinct populations (e.g., comparison of brain activation in elderly and younger participants) where systematic differences in the structure and anatomy of the brain may introduce additional errors. Based on the registration of the optical sensors to the atlas head, a finite‐element model of light diffusion [Dehghani et al., 2008] was used as described in Abdelnour et al. [2008]. An image reconstruction model based on restricted maximum likelihood was used as described previously [Abdelnour and Huppert, 2011; Abdelnour et al., 2008, 2010].
Visualization and Group‐Level Analysis
Group‐level analysis across the subjects was performed using a further random‐effect model of brain activity and simultaneous reconstruction of all subject's data in an image reconstruction as described elsewhere [Abdelnour and Huppert, 2011]. The image reconstruction model was based on the cortical‐surface model described in Abdelnour et al. 2009, which used wavelets to model the surface of the cortex of the brain. In brief, a group‐level image is estimated that is simultaneously consistent (in a Bayesian sense using maximum likelihood [Dehghani et al., 2008]) with all the data from each subject. This method is described in detail in Abdelnour and Huppert 2011. In brief, random‐effect terms model the perturbation of each subject's brain activation from the group‐level image. We have previously shown that this group‐level analysis increases the statistical power of the fNIRS data in comparison with a more conventional two‐step group analysis procedure (e.g., an ill‐posed image reconstruction of each individual subject followed by averaging of the images together) [Abdelnour and Huppert, 2011]. Our random‐effect model attempts to find the image of brain activation that best describes the data from all of the subjects. The advantage of the random‐effect model is a greater insensitivity to outline signals from bad NIRS measurement channels (see discussion in Abdelnour and Huppert 2011). A Satterthwaite correction is applied to estimate the effective degrees of freedom of the model [Abdelnour and Huppert, 2011].
RESULTS
Step Onset
The CRT task induced changes in onset of the first PA and LO time that suggest increased central processing times (Table 1). Specifically, the onset of PA and LO during the CRT conditions was significantly greater than in the SRT condition (P < 0.037) Furthermore, the trials that displayed incongruent cues generated significantly greater PA and LO times compared to the trials that displayed congruent cues (P = 0.001).
Table 1.
Group average (SD) of the median onset of first postural adjustment (PA) and liftoff (LO) for right steps
| PA | LO | % Incorrect steps | |
|---|---|---|---|
| SRT | 271 (28) | 520 (81) | 0% |
| CRT Direction, Congruent | 309 (41) | 579 (83) | 0.8% |
| CRT Direction, Incongruent | 368 (50) | 634 (69) | 0.8% |
| CRT Position, Congruent | 309 (38) | 577 (89) | 1.1% |
| CRT Position, Incongruent | 361 (64) | 659 (104) | 1.8% |
Values represent time (in ms) relative to the onset of stimulus display. Similar results were observed with the left steps.
fNIRS Brain Responses
FNIRS signals were recorded from all subjects. Figure 6 shows a representative time course (low‐pass filtered at 0.8 Hz) for the evolution of the oxyhemoglobin signal over time during the SRT step task with the right leg for one of the subjects. The solid and dashed black lines show the fNIRS signals from two individual source‐detector pairs over the motor cortex. The red line shows the timing of the individual stimuli (stepping cues). The brain responses to individual stepping trials are visible in the fNIRS data as shown in Figure 6. Each time the subject stepped, the fNIRS oxyhemoglobin signal is observed to increase slowly (reaching a peak around 4–5 s after the event) and then returning to baseline after around 8–10 s. This response is typical of both fNIRS and fMRI studies and is associated with an increase in blood flow (hyperemic response) accompanying increased neuronal activity. This is known as the blood oxygen level dependent response.
Figure 6.
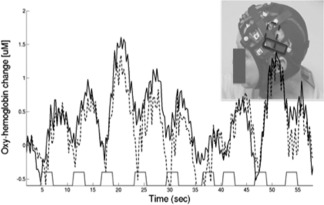
This figure shows the fNIRS data (oxyhemoglobin) from two channels over the posterior region of the probe. The timing of the stimulus/stepping events is shown along the bottom. During each step trial, the hemodynamic response is observed to transiently increase reflecting increases in cortical blood flow to the region of the brain beneath the optical sensors (shown in upper right). These data show the response to the SRT step task with the right leg.
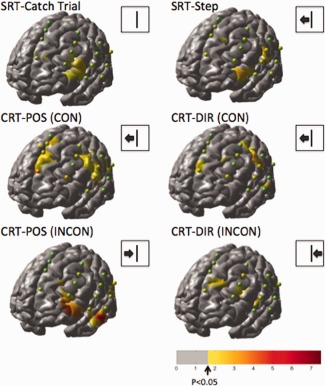
The fNIRS data from all the subjects were analyzed using a canonical general linear model. The responses for a total of 13 types of stimulus events were estimated comprising left/right/catch‐trial stepping responses for the congruent/incongruent directions and cues based on the position or direction of the arrow. The thirteen conditions were (1) SRT:Right step, (2) SRT:Left step, (3) SRT:catch trial, (4) CRT:POS:Incongruent:Right Step, (5) CRT:POS:Incongruent:Left Step, (6) CRT:POS:Congruent:Right Step, (7) CRT:POS:Congruent:Left Step, (8) CRT:POS:Catch trial, (9) CRT: DIR:Incongruent:Right Step, (10) CRT: DIR:Incongruent:Left Step, (11) CRT: DIR:Congruent:Right Step, (12) CRT:POS:Congruent:Left Step, and (13) CRT:DIR:Catch trial. The three types of catch trials were lumped together for display in the results. The average responses across the 10 participants were estimated using the registered brain model [Abdelnour and Huppert, 2011; Abdelnour et al., 2009] and are displayed in Figure 7 (right‐step trials) and Figure 8 (left‐step trials). The images show the effects maps (T‐test) for significant oxyhemoglobin increases compared to the baseline (rest) condition. Both the right and left‐directed steps showed similar activation with the exception of the posterior–superior frontal region in the area corresponding to the motor cortex. Because the fNIRS sensors were positioned only over the left hemisphere, only the right‐directed steps involving movement of right foot showed significant motor cortex involvement in the fNIRS measurements from the left hemisphere. The magnitude of the effect size (T‐score) for the original NIRS data for each measurement combination is indicated by a sphere placed at the midpoint between each source‐detector combination. The color of the sphere is the same scale as the underlying image with the exception that the center of the color map was kept green to distinguish the sphere from the background brain. For the remainder of the results, we focused on the six conditions corresponding to just these right‐directed steps.
Figure 7.

The reconstructed (N = 10) effects maps for oxyhemoglobin changes for the catch‐trial, SRT, and CRT responses. The images above show the response to right‐directed stepping motions only. Spheres indicating the locations of the fNIRS measurements (midpoint between each source‐detector measurement combination) for one subject are shown overlaid on the group images of brain activity. These spheres are color‐coded based on the effect‐size for the corresponding fNIRS measurement channel from the group‐averaged data.
Figure 8.
The reconstructed (N = 10) effects maps for oxyhemoglobin changes for the catch‐trial, SRT, and CSRT responses. The images above show the response to left‐directed stepping motions only. Spheres indicating the locations of the fNIRS measurements (midpoint between each source‐detector measurement combination) for one subject are shown overlaid on the group images of brain activity. These spheres are color‐coded based on the effect‐size for the corresponding fNIRS measurement channel from the group‐averaged data.
From the activation maps for the individual trial conditions, difference images were constructed to look at regions differentially activated in the congruent/incongruent tasks or between attending to positional or directional cues. Figure 9 shows the areas statistically more active in the CRT condition compared to the SRT for oxyhemoglobin. In both the congruent (top row) and incongruent (bottom row) CRT conditions, the inferior frontal gyrus near Brodmann area 46 (DLPFC) was more active in the choice task compared to the SRT task. Furthermore, this area was statistically more active during the incongruent trials compared to the congruent ones when either the position or directional cue was followed as shown in Figure 10 (top row). In addition to the inferior frontal gyrus, the CRT:POS blocks activated regions of the superior frontal cortex and inferior parietal cortex more than the CRT:DIR blocks as shown in Figure 9 (bottom). Conversely, regions near the supplementary and presupplementary motor area (pre‐SMA) were more active with attention to directional cues (CRT:DIR) compared to positional cues (CRT:POS). This is consistent with previous MRI studies [LaBar et al., 1999] indicating a role of the frontal eye fields (Brodmann area 6; premotor cortex) in tasks involving spatial attention, such as the CRT:POS task in which the subjects need to pay specific attention to the location of the arrow. The catch trials, which represent a control task with only cognitive but no motor involvement, showed only activation in the inferior frontal region.
Figure 9.
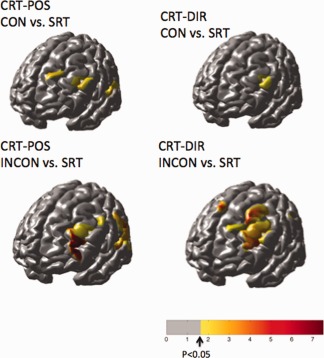
The effects maps above show regions that were more active in the CRT condition compared to the SRT conditions for oxyhemoglobin. The congruent (top) and incongruent (bottom) tasks are shown for the steps following positional and directional cues of the CRT task. Only the right‐step data are shown.
Figure 10.
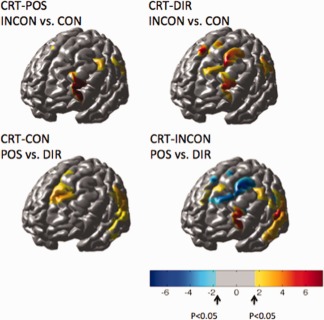
The top row of images shows regions more active during the incongruent trials compared to the congruent trials for the right‐step trials. The bottom row of images shows the comparison of activations based on the position versus the direction of the arrow cue. All images show the effects map for the oxyhemoglobin changes. Red indicates areas more active in the incongruent condition compared to the congruent condition (top row) or more active in tasks following a positional cue compared to a directional cue (bottom row). Blue indicates areas more active in the directional cues compared to the positional cues. No areas were statistically more active in the congruent conditions compared to the incongruent condition.
DISCUSSION
Information‐processing tasks, such as the Stroop [Banich et al., 2001] or Simon 1969 tasks, are known to engage cognitive frontal regions of the brain [Liu et al., 2004], particularly the DLPFC. We had hypothesized that these regions would also be engaged during the response to incongruent information (e.g., the location and direction of the presented arrow) during the choice‐step task. In this work, we used a novel brain‐imaging method called fNIRS to address this hypothesis. fNIRS was used to measure differences in cortical activation during a step task that involved varying levels of cognitive processing in brain areas that serve executive function. Specifically, when subjects need to make a choice about where to step based on congruent or incongruent stimulus‐response characteristics, reaction times were delayed, and there was greater activation of the inferior frontal gyrus that primarily regulates executive function processes. Consequently, these findings suggest that fNIRS may be a promising technique for examining the influence of executive function on posture and gait that has recently been shown to be so critical in understanding age‐related declines in mobility [Fitzpatrick et al., 2007; van Iersel et al., 2008; Yogev‐Seligmann et al., 2008].
Step Onset
The step data revealed greater onset latency of PAs and foot LO for the stepping leg during the CRT blocks compared to the SRT blocks. Furthermore, the trials with incongruent cues resulted in greater latencies than those trials with congruent cues. Assuming equal peripheral activation times in all conditions, these findings suggest greater central processing times during the conditions in which a choice must be made, especially when the meaning of the cues (i.e., which direction to step) can be interpreted in two ways. These findings are consistent with other CRT tests of step initiation [Lord and Fitzpatrick, 2001; Luchies et al., 2002].
The difference in reaction times between the incongruent cue trials and congruent cue trials has been attributed to engagement of inhibitory processes, a component of executive function [Nassauer and Halperin, 2003]. In the odd‐numbered scans starting from the third scan, subjects were instructed to step in the direction that the arrow was pointing; thus, when the direction of the arrow was incongruent with the side of the screen on which it was displayed, subjects were required to inhibit the strong tendency to step toward the side on which the stimulus was spatially located (i.e. the Simon effect [Simon, 1969]). The related executive function components of working memory and maintaining an attention set may be engaged in the step task, because subjects are required to remember what instructional rule to follow from scan to scan. As further evidence that the step test relates to executive function processes, a previous study found significant associations between the step reaction times and performance on neuropsychological tests assessing executive function, including the Digit Symbol Substitution test, Stroop Color‐Word test, and Trails‐Making test [Lord and Fitzpatrick, 2001].
fNIRS Brain Responses
In both the congruent and incongruent CRT conditions, the inferior frontal gyrus near Brodmann area 46 (DLPFC) was more active in the CRT compared to the SRT. In addition, this area was statistically more active during the incongruent trials compared to the congruent ones when either the position or directional cue was followed as shown in Figure 9 (top). Activation of the inferior frontal gyrus is consistent with the probable engagement of inhibitory processes, as shown in fMRI studies of Stroop interference [Banich et al., 2007; Langenecker et al., 2004; Liu et al., 2004; Milham et al., 2004]. Furthermore, Banich et al. 2001 suggest that this area is activated when people are required to override automatic responses, as may have occurred when subject were instructed to ignore the arrow position. The most closely related studies to the present study are those reported by Peterson et al. 2002 and Liu et al. 2004, which had similar tasks that involved manually pressing a button based on the direction and position of arrows. In addition to activation of the inferior frontal gyrus, these tasks elicited responses from the SMA and pre‐SMA, middle frontal cortex, anterior cingulate cortex, inferior temporal cortex, inferior parietal cortex, and posterior boundary of the insula. Several of these areas are either too deep to reach with the fNIRS technique or were not explicitly measured due to the location of our optical sensors, which for the purpose of this study was limited to the left frontal, temporal, and some of the most‐anterior portions of the posterior cortex. The catch trials showed only activation of the frontal cortex. A limitation of fNIRS is that information is only gathered from regions accessible to light, which limits measurements to the outer 5–8 mm of the cortex. Regions such as the primary motor cortex associated with leg movements are deeper into the central sulcus and have lower contrast‐to‐noise properties.
Utility of fNIRS for Studying Movement and Gait
Our functional near‐infrared spectroscopy (fNIRS) system uses long fiber optic cables, which allow measurements of brain activation during movement. Previously, fNIRS has been used to study motor activation during gait and locomotion during treadmill walking [Harada et al., 2009; Miyai et al., 2001, 2003; Suzuki et al., 2008]. These studies have provided many insights into brain control of locomotion particularly in the motor and supplemental motor areas. In our current study, we have focused specifically on the role of executive function and the frontal cortex in making step‐choice decisions. We believe that this is the first study to use fNIRS to explicitly look at the role of executive function in a complex locomotion task. Our results have demonstrated that fNIRS is well suited for these tasks and allows for frontal, temporal, and parietal regions to be measured during ambulatory movement.
Although this study demonstrated some of the utility of fNIRS, our current study had a few limitations. Because this was the first study of this kind, we had chosen to use a simplified fNIRS cap consisting only of sensors on the left hemisphere. Our current system, which has up to 1,024 possible measurement channels, allows us to record from the entire head simultaneously (see Franceschini et al. 2006). This was not done in this study because of the complexity of such a setup; however, the addition of more sensors in future work would allow bilateral measurements. Furthermore, systemic physiology is often confound in fNIRS studies. Over the last several years, our laboratory and others have developed several approaches to dealing with systemic physiology (reviewed in Huppert et al. 2009). In this work, a relatively simple‐weighted regression with a discrete cosine transform series was used to remove drift due to systemic effects. Although this is a standard approach in fMRI using similar analysis (e.g., [Friston, 2007]) to the general linear model used in this work, additional methods are available, which might have improved the results further. We do not feel that the results were errors due to systemic noise, because the observed activations were more focal to the frontal and parietal regions. Typically, noise artifacts (including motion artifacts) tend to be more uniform across the measurement space (e.g. [Franceschini et al., 2006]), a fact exploited in many of the noise‐reduction methods [Huppert et al., 2009]. The future use of additional recording devices to capture pulse‐oximetry, respiration rate, and beat‐to‐beat blood pressure changes is proposed to further reduce the possible influence of systemic effects.
In addition, the reconstruction of brain images from fNIRS remains a mathematically ill‐posed problem, meaning that it is impossible to isolate a single unique image of brain activity. Although the images shown in Figures 7, 8, 9, 10 represent the optimal images determined under a restricted maximum likelihood model, care must be taken in drawing too quantitative a conclusion from these presentations. Because we used an atlas MRI image, the group‐level analysis may be sensitive to the underlying gyri folds of the brain anatomy in individual subjects. Although differences in the placement of the fNIRS cap could be accounted for using the three‐dimensional registration and mathematical models of the light diffusion in the tissue (e.g., the forward model), we did not account for differences in the anatomy of the head, which may contribute to errors in the analysis. Because our sample size (N = 10) was small in this pilot study, we cannot assume that errors due to differences in subject anatomy or the physics of fNIRS light in tissue have not somehow biased the quantitative interpretation of our results.
CONCLUSION
In this work, we have demonstrated the ability to use fNIRS for measuring brain activity during upright stepping tasks. This allowed simultaneous recording of both the movement data via force plates and the brain signals. This demonstrates the utility of using fNIRS to study dual‐task effects associated with balance or gait. In particular, this study shows that regions of the frontal cortex are activated during complex stepping cues. Additional future work is needed to investigate the implications of this in dual‐task interference involving joint stepping and information‐processing tasks.
ACKNOWLEDGMENTS
We thank Susan Fuhrman, PhD for her assistance in data collection and analysis.
REFERENCES
- Abdelnour AF, Huppert T (2009): Real‐time imaging of human brain function by near‐infrared spectroscopy using an adaptive general linear model. Neuroimage 46:133–143. [DOI] [PMC free article] [PubMed] [Google Scholar]
- Abdelnour AF, Huppert TJ (2011): A random‐effects model for group‐level analysis of diffuse optical brain imaging. Biomed Opt Expr 2:1–25. [DOI] [PMC free article] [PubMed] [Google Scholar]
- Abdelnour AF, Schmidt B, Huppert TJ (2009): Topographic localization of brain activation in diffuse optical imaging using spherical wavelets. Phys Med Biol 54:6383–6413. [DOI] [PMC free article] [PubMed] [Google Scholar]
- Abdelnour AF, Genovese C, Huppert TJ (2010): Hierarchical Bayesian regularization of reconstructions for diffuse optical tomography using multiple priors. Biomed Opt Expr 1:1084–1103. [DOI] [PMC free article] [PubMed] [Google Scholar]
- Almkvist O, Wahlund LO, Andersson‐Lundman G, Basun H, Backman L (1992): White‐matter hyperintensity and neuropsychological functions in dementia and healthy aging. Arch Neurol 49:626–632. [DOI] [PubMed] [Google Scholar]
- Bakker M, Verstappen CC, Bloem BR, Toni I (2007): Recent advances in functional neuroimaging of gait. J Neural Transm 114:1323–1331. [DOI] [PMC free article] [PubMed] [Google Scholar]
- Bakker M, De Lange FP, Helmich RC, Scheeringa R, Bloem BR, Toni I (2008): Cerebral correlates of motor imagery of normal and precision gait. Neuroimage 41:998–1010. [DOI] [PubMed] [Google Scholar]
- Banich MT, Milham MP, Jacobson BL, Webb A, Wszalek T, Cohen NJ, Kramer AF (2001): Attentional selection and the processing of task‐irrelevant information: Insights from fMRI examinations of the Stroop task. Prog Brain Res 134:459–470. [DOI] [PubMed] [Google Scholar]
- Bloem BR, Valkenburg VV, Slabbekoorn M, Willemsen MD (2001): The Multiple Tasks Test: Development and normal strategies. Gait Posture 14:191–202. [DOI] [PubMed] [Google Scholar]
- Boas DA, Dale AM (2005): Simulation study of magnetic resonance imaging‐guided cortically constrained diffuse optical tomography of human brain function. Appl Opt 44:1957–1968. [DOI] [PubMed] [Google Scholar]
- Boas DA, Gaudette T, Strangman G, Cheng X, Marota JJ, Mandeville JB (2001): The accuracy of near infrared spectroscopy and imaging during focal changes in cerebral hemodynamics. Neuroimage 13:76–90. [DOI] [PubMed] [Google Scholar]
- Boas DA, Dale AM, Franceschini MA (2004): Diffuse optical imaging of brain activation: Approaches to optimizing image sensitivity, resolution, and accuracy. Neuroimage 23( Suppl 1):S275–S288. [DOI] [PubMed] [Google Scholar]
- Breteler MM, van Amerongen NM, van Swieten JC, Claus JJ, Grobbee DE, van Gijn J, Hofman A, van Harskamp F (1994): Cognitive correlates of ventricular enlargement and cerebral white matter lesions on magnetic resonance imaging. The Rotterdam Study. Stroke 25:1109–1115. [DOI] [PubMed] [Google Scholar]
- Brown LA, Shumway‐Cook A, Woollacott MH (1999): Attentional demands and postural recovery: The effects of aging. J Gerontol Ser A: Biol Sci Med Sci 54:M165–M171. [DOI] [PubMed] [Google Scholar]
- Burton E, Ballard C, Stephens S, Kenny RA, Kalaria R, Barber R, O'Brien J (2003): Hyperintensities and fronto‐subcortical atrophy on MRI are substrates of mild cognitive deficits after stroke. Dementia Geriatr Cogn Disorders 16:113–118. [DOI] [PubMed] [Google Scholar]
- Burton EJ, Kenny RA, O'Brien J, Stephens S, Bradbury M, Rowan E, Kalaria R, Firbank M, Wesnes K, Ballard C (2004): White matter hyperintensities are associated with impairment of memory, attention, and global cognitive performance in older stroke patients. Stroke 35:1270–1275. [DOI] [PubMed] [Google Scholar]
- Cope M, Delpy DT, Reynolds EO, Wray S, Wyatt J, van der Zee P (1988): Methods of quantitating cerebral near infrared spectroscopy data. Adv Exp Med Biol 222:183–189. [DOI] [PubMed] [Google Scholar]
- Custo A, Wells WM III, Barnett AH, Hillman EM, Boas DA (2006): Effective scattering coefficient of the cerebral spinal fluid in adult head models for diffuse optical imaging. Appl Opt 45:4747–4755. [DOI] [PubMed] [Google Scholar]
- Dehghani H, Eames ME, Yalavarthy PK, Davis SC, Srinivasan S, Carpenter CM, Pogue BW, Paulsen KD (2008): Near infrared optical tomography using NIRFAST: Algorithm for numerical model and image reconstruction. Commun Numer Methods Eng 25:711–732. [DOI] [PMC free article] [PubMed] [Google Scholar]
- Dieterich M, Brandt T (2008): Functional brain imaging of peripheral and central vestibular disorders. Brain 131 ( Pt 10):2538–2552. [DOI] [PubMed] [Google Scholar]
- Fitzpatrick AL, Buchanan CK, Nahin RL, Dekosky ST, Atkinson HH, Carlson MC, Williamson JD (2007): Associations of gait speed and other measures of physical function with cognition in a healthy cohort of elderly persons. J Gerontol A Biol Sci Med Sci 62:1244–1251. [DOI] [PubMed] [Google Scholar]
- Franceschini MA, Joseph DK, Huppert TJ, Diamond SG, Boas DA (2006): Diffuse optical imaging of the whole head. J Biomed Opt 11:054007. [DOI] [PMC free article] [PubMed] [Google Scholar]
- Friston KJ (2007): Statistical Parametric Mapping: The Analysis of Functional Brain Images. London:Academic; p647. [Google Scholar]
- Harada T, Miyai I, Suzuki M, Kubota K (2009): Gait capacity affects cortical activation patterns related to speed control in the elderly. Exp Brain Res 193:445–454. [DOI] [PubMed] [Google Scholar]
- Hartley A, Keiley J, Slabach E (1992): Allocation of visual attention in young and older adults. Percep Psychophys 52:175–185. [DOI] [PubMed] [Google Scholar]
- Holmes C, Hoge R, Collins L, Woods R, Toga A, Evans A (1998): Enhancement of MR images using registration for signal averaging. J Comput Assist Tomogr 22:324–333. [DOI] [PubMed] [Google Scholar]
- Hoskin AF (1998): Fatal falls: Trends and characteristics. Stat Bull Metropolitan Insur Compan 79:10–15. [PubMed] [Google Scholar]
- Huppert TJ, Diamond SG, Franceschini MA, Boas DA (2009): HomER: A review of time‐series analysis methods for near‐infrared spectroscopy of the brain. Appl Opt 48:D280–D298. [DOI] [PMC free article] [PubMed] [Google Scholar]
- Jahn K, Deutschlander A, Stephan T, Strupp M, Wiesmann M, Brandt T (2004): Brain activation patterns during imagined stance and locomotion in functional magnetic resonance imaging. Neuroimage 22:1722–1731. [DOI] [PubMed] [Google Scholar]
- Jennings JR, Mendelson DN, Redfern MS, Nebes RD (2011): Detecting age differences in resistance to perceptual and motor interference. Exp Aging Res 37:179–197. [DOI] [PMC free article] [PubMed] [Google Scholar]
- Jobsis FF (1977): Noninvasive, infrared monitoring of cerebral and myocardial oxygen sufficiency and circulatory parameters. Science 198:1264–1267. [DOI] [PubMed] [Google Scholar]
- Junque C, Pujol J, Vendrell P, Bruna O, Jodar M, Ribas JC, Vinas J, Capdevila A, Marti‐Vilalta JL (1990): Leuko‐araiosis on magnetic resonance imaging and speed of mental processing. Arch Neurol 47:151–156. [DOI] [PubMed] [Google Scholar]
- Kannus P, Parkkari J, Koskinen S, Niemi S, Palvanen M, Jarvinen M, Vuori I (1999): Fall‐induced injuries and deaths among older adults. JAMA 281:1895–1899. [DOI] [PubMed] [Google Scholar]
- LaBar KS, Gitelman DR, Parrish TB, Mesulam M (1999): Neuroanatomic overlap of working memory and spatial attention networks: A functional MRI comparison within subjects. Neuroimage 10:695–704. [DOI] [PubMed] [Google Scholar]
- Langenecker SA, Nielson KA, Rao SM (2004): fMRI of healthy older adults during Stroop interference. Neuroimage 21:192–200. [DOI] [PubMed] [Google Scholar]
- Liu X, Banich MT, Jacobson BL, Tanabe JL (2004): Common and distinct neural substrates of attentional control in an integrated Simon and spatial Stroop task as assessed by event‐related fMRI. Neuroimage 22:1097–1106. [DOI] [PubMed] [Google Scholar]
- Lord SR, Fitzpatrick RC (2001): Choice stepping reaction time: A composite measure of falls risk in older people. J Gerontol A Biol Sci Med Sci 56:M627–M632. [DOI] [PubMed] [Google Scholar]
- Luchies CW, Schiffman J, Richards LG, Thompson MR, Bazuin D, DeYoung AJ (2002): Effects of age, step direction, and reaction condition on the ability to step quickly. J Gerontol A Biol Sci Med Sci 57:M246–M249. [DOI] [PubMed] [Google Scholar]
- Lundin‐Olsson L, Nyberg L, Gustafson Y (1997): “Stops walking when talking” as a predictor of falls in elderly people [see comment]. Lancet 349:617. [DOI] [PubMed] [Google Scholar]
- Manolio TA, Kronmal RA, Burke GL, Poirier V, O'Leary DH, Gardin JM, Fried LP, Steinberg EP, Bryan RN (1994): Magnetic resonance abnormalities and cardiovascular disease in older adults. The Cardiovascular Health Study. Stroke 25:318–327. [DOI] [PubMed] [Google Scholar]
- Means KM, Rodell DE, O'Sullivan PS (1998): Obstacle course performance and risk of falling in community‐dwelling elderly persons. Arch Phys Med Rehabil 79:1570–1576. [DOI] [PubMed] [Google Scholar]
- Milham MP, Erickson KI, Banich MT, Kramer AF, Webb A, Wszalek T, Cohen NJ (2002): Attentional control in the aging brain: Insights from an fMRI study of the stroop task. Brain Cogn 49:277–296. [DOI] [PubMed] [Google Scholar]
- Miyai I, Tanabe HC, Sase I, Eda H, Oda I, Konishi I, Tsunazawa Y, Suzuki T, Yanagida T, Kubota K (2001): Cortical mapping of gait in humans: A near‐infrared spectroscopic topography study. Neuroimage 14:1186–1192. [DOI] [PubMed] [Google Scholar]
- Miyai I, Yagura H, Oda I, Konishi I, Eda H, Suzuki T, Kubota K (2002): Premotor cortex is involved in restoration of gait in stroke. Ann Neurol 52:188–194. [DOI] [PubMed] [Google Scholar]
- Miyai I, Yagura H, Hatakenaka M, Oda I, Konishi I, Kubota K (2003): Longitudinal optical imaging study for locomotor recovery after stroke. Stroke 34:2866–2870. [DOI] [PubMed] [Google Scholar]
- Miyai I, Suzuki M, Hatakenaka M, Kubota K (2006): Effect of body weight support on cortical activation during gait in patients with stroke. Exp Brain Res 169:85–91. [DOI] [PubMed] [Google Scholar]
- Nassauer KW, Halperin JM (2003): Dissociation of perceptual and motor inhibition processes through the use of novel computerized conflict tasks. J Int Neuropsychol Soc 9:25–30. [DOI] [PubMed] [Google Scholar]
- Obrig H, Villringer A (2003): Beyond the visible—Imaging the human brain with light. J Cereb Blood Flow Metab 23:1–18. [DOI] [PubMed] [Google Scholar]
- O'Sullivan M, Morris RG, Huckstep B, Jones DK, Williams SC, Markus HS (2004): Diffusion tensor MRI correlates with executive dysfunction in patients with ischaemic leukoaraiosis. J Neurol Neurosurg Psychiatr 75:441–447. [DOI] [PMC free article] [PubMed] [Google Scholar]
- Peterson BS, Kane MJ, Alexander GM, Lacadie C, Skudlarski P, Leung HC, May J, Gore JC (2002): An event‐related functional MRI study comparing interference effects in the Simon and Stroop tasks. Brain Res Cogn Brain Res 13:427–440. [DOI] [PubMed] [Google Scholar]
- Redfern MS, Jennings JR, Martin C, Furman JM (2001): Attention influences sensory integration for postural control in older adults. Gait Posture 14:211–216. [DOI] [PubMed] [Google Scholar]
- Reuter‐Lorenz PA (2008): Neurocognitive aging and the compensation hypothesis. Curr Directions Psychol Sci 17:177–182. [Google Scholar]
- Shumway‐Cook A, Woollacott M, Kerns KA, Baldwin M (1997): The effects of two types of cognitive tasks on postural stability in older adults with and without a history of falls. J Gerontol Ser A: Biol Sci Med Sci 52:M232–M240. [DOI] [PubMed] [Google Scholar]
- Simon J (1969): Reactions towards the source of stimulation. J Exp Psychol 81:174–176. [DOI] [PubMed] [Google Scholar]
- Simon JR, Small AM Jr. (1969): Processing auditory information: Interference from an irrelevant cue. J Appl Psychol 53:433–435. [DOI] [PubMed] [Google Scholar]
- Sparto PJ, Aizenstein HJ, Vanswearingen JM, Rosano C, Perera S, Studenski SA, Furman JM, Redfern MS (2008): Delays in auditory‐cued step initiation are related to increased volume of white matter hyperintensities in older adults. Exp Brain Res 188:633–640. [DOI] [PMC free article] [PubMed] [Google Scholar]
- Steinbrink J, Villringer A, Kempf F, Haux D, Boden S, Obrig H (2006): Illuminating the BOLD signal: Combined fMRI‐fNIRS studies. Magn Reson Imag 24:495–505. [DOI] [PubMed] [Google Scholar]
- Stelmach GE, Teasdale N, Di Fabio RP, Phillips J (1989): Age related decline in postural control mechanisms. Int J Aging Hum Dev 29:205–223. [DOI] [PubMed] [Google Scholar]
- Studenski S, Perera S, Patel K, Rosano C, Faulkner K, Inzitari M, Brach J, Chandler J, Cawthon P, Connor EB, Nevitt M, Visser M, Kritchevsky S, Badinelli S, Harris T, Newman AB, Cauley J, Ferrucci L, Guralnik J (2011): Gait speed and survival in older adults. JAMA 305:50–58. [DOI] [PMC free article] [PubMed] [Google Scholar]
- Suzuki M, Miyai I, Ono T, Kubota K (2008): Activities in the frontal cortex and gait performance are modulated by preparation. An fNIRS study. Neuroimage 39:600–607. [DOI] [PubMed] [Google Scholar]
- Teasdale N, Schmidt RA (1991): Deceleration requirements and the control of pointing movements. J Mot Behav 23:131–138. [DOI] [PubMed] [Google Scholar]
- Tinetti ME, de Leon CFM, Doucette JT, Baker DI (1994): Fear of falling and fall‐related efficacy in relationship to functioning among community‐living elders. J Gerontol 49:M140–M147. [DOI] [PubMed] [Google Scholar]
- van Iersel MB, Kessels RP, Bloem BR, Verbeek AL, Rikkert MGO (2008): Executive functions are associated with gait and balance in community‐living elderly people. J Gerontol A Biol Sci Med Sci 63:1344–1349. [DOI] [PubMed] [Google Scholar]
- Ye JC, Tak S, Jang KE, Jung J, Jang J (2009): NIRS‐SPM: Statistical parametric mapping for near‐infrared spectroscopy. Neuroimage 44:428–447. [DOI] [PubMed] [Google Scholar]
- Ylikoski R, Ylikoski A, Erkinjuntti T, Sulkava R, Raininko R, Tilvis R (1993): White matter changes in healthy elderly persons correlate with attention and speed of mental processing. Arch Neurol 50:818–824. [DOI] [PubMed] [Google Scholar]
- Yogev‐Seligmann G, Hausdorff JM, Giladi N (2008): The role of executive function and attention in gait. Mov Disord 23:329–342. [DOI] [PMC free article] [PubMed] [Google Scholar]