Abstract
Background
Intensive care units (ICUs) in human hospitals are consistently noisy environments with sound levels sufficient to substantially decrease sleep quality. Sound levels in veterinary ICUs have not been studied previously, but environmental sound has been shown to alter activity in healthy dogs.
Hypothesis
Veterinary ICUs, like those in human medicine, will exceed international guidelines for hospital noise.
Animals
NA.
Methods
Prospective, observational study performed consecutively and simultaneously over 4 weeks in 2 veterinary ICUs. Conventional A‐weighted sound pressure levels (equivalent continuous level [a reflection of average sound], the sound level that is exceeded 90% of the recording period time [reflective of background noise], and maximum sound levels) were continuously recorded and the number of spikes in sound >80 dBA were manually counted.
Results
Noise levels were comparable to ICUs in human hospitals. The equivalent continuous sound level was higher in ICU1 than in ICU2 at every time point compared, with greatest differences observed on week day (ICU1, 60.1 ± 3.7 dBA; ICU2, 55.9 ± 2.5 dBA, P < .001) and weekend nights (ICU1, 59.9 ± 2.4 dBA; ICU2, 53.4 ± 1.7 dBA, P < .0001) reflecting a 50% difference in loudness. Similar patterns were observed for the maximum and background noise levels. The number of sound spikes was up to 4 times higher in ICU1 (162.3 ± 84.9 spikes) than in ICU2 (40.4 ± 12.2 spikes, P = .001).
Conclusions and Clinical Importance
These findings show that sound in veterinary ICUs is loud enough to potentially disrupt sleep in critically ill veterinary patients.
Keywords: Critical care, Hospital soundscape, Noise, Sleep
Abbreviations
- dBA
decibels
- LAeq
A‐weighted equivalent continuous sound pressure level
- LAmax
A‐weighted maximum sound pressure level over the recording time
- LA90
A‐weighted sound pressure level which is exceeded 90% of the recording time
- SD
secure digital
Sleep plays an essential role in long‐term health in humans1 and animals.2 Disruption of normal sleep has been unequivocally demonstrated in human patients within the intensive care unit (ICU) environment over the past 3 decades.3, 4, 5, 6, 7, 8, 9 Using both objective (polysomnography) and subjective (patient reporting) measures, several studies have demonstrated that sleep disruption in the ICU is a major source of patient anxiety (ranked second after pain), and is characterized by a loss of circadian rhythm, fragmented sleep, and reduction in sleep quality.3, 4, 5, 10, 11, 12 In addition, short‐term sleep disturbances, associated with respiratory, metabolic, immunologic, and psychological dysfunction, lead to increased morbidity and mortality.13, 14, 15
Environmental noise, defined as unwanted sound, is a major source of sleep disruption in ICU patients, accounting for up to 53% of arousals (transition to a lighter sleep stage) and awakenings.3, 7, 10 High environmental noise has been identified within ICUs in several countries7, 16, 17, 18 with reported average sound pressure levels (A‐weighted equivalent continuous sound pressure level [LAeq]) ranging from 50 to 72 dBA.7, 16, 17, 18 This range far exceeds the US Environmental Protection Agency (EPA) and World Health Organisation (WHO) recommendations (EPA, not greater than LAeq 45 dBA [day time] and 35 dBA [night time]; WHO, LAeq 30–35 dBA [day time] and A‐weighted maximum sound pressure level over the recording time [LAmax] 40 dBA [night time]).19, 20 Furthermore, spikes (sudden increases) in sound >75 dBA are not uncommon3, 7, 21, 22, 23 and are particularly disruptive to sleep, associated with 30–35% of arousals or awakenings.7
A common rule of thumb used to interpret dBA levels is that perceived loudness doubles with a 10 dBA increase in sound pressure level (Table 1). Increases in sound levels of approximately 1 dBA (less if the sound pressure level is >50 dBA) are noticeable to the human ear,24, 25 and small increases in sound levels (in the range of 2 dBA) can result in increased arousal and awakenings.7
Table 1.
Relationship between dB and perceived loudness
| Sound Pressure Change | dB Change | Increase in Perceived Loudness (%) |
|---|---|---|
| 2‐fold | 3 | 20 |
| 3‐fold | 5 | 50 |
| 10‐fold | 10 | 200 |
The relationship between sound pressure level (dB) and intensity is described by: Sound pressure level (dB) = 20 log10 (ρ/ρ0), where sound pressure, ρ (pascals), is compared to a reference value, ρ0 (20 × 10−6 pascals), the threshold of human hearing.
A logarithmic scale is used to facilitate reporting of the wide range in audible sound pressures. Associated changes in perceived loudness are based on reported responses from humans.25
Dogs have a sleep architecture similar to that of humans, and serve as an animal model for narcolepsy.26, 27, 28 Like humans, dogs have a 24‐hour rest‐activity cycle with the majority of sleep occurring at night.28 Auditory stimulation (sound pressure level, sound duration, and frequency) alters the circadian rhythm of dogs.29, 30 A pilot study of healthy dogs housed in an artificial ICU environment showed significantly higher diurnal and nocturnal activity levels during periods of high auditory and light stimulation, compared with times of lower stimulation.30
In ICUs in human hospitals, causes of increased sound levels include patient‐associated noise, staff conversation, heating and cooling systems, alarms, and operational noise from life support devices.3, 4, 5, 7, 10, 12, 16, 17, 31 In veterinary ICUs, a similar soundscape can be expected, with the obvious addition of animal noise.
To the authors' knowledge, no studies have been published in the veterinary literature reporting noise levels within veterinary ICUs. We hypothesized that veterinary ICUs, similar to those in human hospitals, would exceed WHO and EPA recommendations. We also postulated that day time periods would be louder than night time periods and that week days would be louder than weekends. A prospective observational study was undertaken in 2 referral veterinary ICUs to investigate these hypotheses.
Materials and Methods
In a prospective, observational, multicenter study, sound levels were continuously and simultaneously recorded over 4 weeks in the ICUs of 2 private veterinary referral centers in Calgary, Alberta (Canada). Each ICU had a different floor plan and infrastructure (Fig 1). The construction of each ICU was similar, with the exception of 5 mm tempered glass forming the top half of 3 walls in ICU1. Construction materials were: ICU1—ceiling (acoustic tile; noise reduction coefficient, 0.55), floor (epoxy coated concrete), walls (gyp‐rock over a metal frame) and ICU2—ceiling (acoustic tile; noise reduction coefficient, 0.45), floor (epoxy coated concrete), walls (dry wall over a timber frame).
Figure 1.
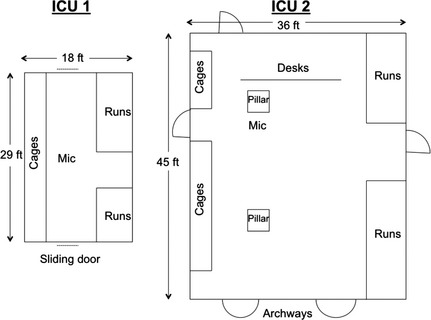
Floor plans of intensive care units (ICU)1 and ICU2. Drawing is not to scale. Mic, microphone suspended 2.5 m above floor level.
A calibrated hand‐held sound level meter and analyzer1 was attached by an extension lead to a microphone2 which was suspended from the ceiling in the center of each ICU at a height of approximately 2.5 m above floor level. Sound data were downloaded using a secure digital (SD) card to a laptop computer at least once daily and analyzed off‐line3 . No changes were made to daily routine or practice in either of the participating ICUs.
Matched data were compared from pooled week day and weekend daytime (0800–1959) and overnight (2000–0759) periods from both centers over the recording period. The sound level meter recorded sound at 1 minute intervals and these data were averaged to give a single value for the day and night time periods. An A‐weighted decibel scale was used to facilitate comparison with existing medical literature. Three parameters were recorded (Fig 2): LAeq, LAmax, and A‐weighted sound pressure level which exceeded 90% of the recording time (LA90). A‐weighted equivalent continuous sound pressure level is a standard method for the representation of fluctuating sound levels and is calculated by integrating recorded sound pressure over the duration of the reporting period to generate a single sound pressure level. A‐weighted sound pressure level which is exceeded 90% of the recording time represents background noise levels because it is the sound pressure level that is exceeded for 90% of the recording period. A‐weighted maximum sound pressure level over the recording time is the maximum sound pressure level during the recording period. Together, these parameters create a soundscape of the environment. In addition, the number of minutes during which sound levels exceeded 80 dBA (visual inspection of LAmax trace) were manually counted over the entire recording period. Patient occupancy of each ICU was recorded at the start and end of each 12 hour recording period.
Figure 2.
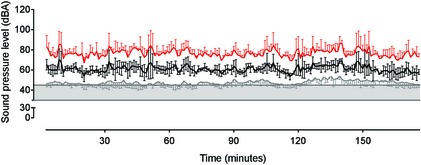
Sample of sound pressure level data from a 3‐hour week day recording in intensive care unit (ICU)1 illustrating relationships between LA 90 (grey line), LA eq (black line), and LA max (red line). Data are mean ± SD. The shaded horizontal box represents the WHO (30–35 dBA) and US EPA (45 dBA) range for hospital noise.
Statistical Analyses
Nonparametric statistics were applied if data failed (P > .05) a D'Agostino and Pearson Omnibus normality test or if sample size was <30 (ICU occupancy data).
A 1‐way analysis of variance (ANOVA) with repeated measures and a least significant difference post hoc test was used to compare differences within each ICU at different times. The following comparisons were selected a priori, with a corrected significance level set as P < .013: week days versus week nights, weekend days versus weekend nights, week days versus weekend days and week nights versus weekend nights. Between ICUs, the following comparisons were selected a priori and compared with unpaired t‐tests: week days, week nights, weekend days, weekend nights. Patient occupancy rates were compared with a Mann–Whitney test at the same time points. A P value <.05 was considered significant for both tests. Unless otherwise stated, data are presented as mean ± SD. Statistical analyses were performed with commercial software4,5.
Results
Overall, ICU1 was noisier than ICU2 for all sound pressure level parameters (LAeq, LAmax, LA90) and at all time points compared (Table 2 and Figs 2, 3, 4, 5, 6). This observation was made despite higher occupancy levels in ICU2 during the study period (Fig 7).
Table 2.
Sound pressure level parameters recorded from intensive care units (ICU)1 and ICU2
| Parameter | Week Day | Week Night | Weekend Day | Weekend Night | ||||
|---|---|---|---|---|---|---|---|---|
| ICU1 | ICU2 | ICU1 | ICU2 | ICU1 | ICU2 | ICU1 | ICU2 | |
| LAeq (dBA) | 62.74 ± 2.9†† | 59.42 ± 1.5 | 60.12 ± 3.7 | 55.98 ± 2.5 | 59.15 ± 2.2†† | 56.89 ± 1.6††† | 59.85 ± 2.4 | 53.35 ± 1.7††† |
| LAmax (dBA) | 78.32 ± 3.3 | 74.88 ± 1.7 | 75.52 ± 4.2††† | 71.12 ± 2.4† | 74.67 ± 2.5*** | 72.35 ± 1.6*** | 75.14 ± 2.7†††,*** | 68.34 ± 1.5†,*** |
| LA90 (dBA) | 49.22 ± 1.5†† | 46.97 ± 1.1†† | 47.97 ± 1.5††† | 45.11 ± 2.1 | 47.23 ± 1.7††,*** | 44.91 ± 1.3†† | 48.15 ± 1.6†††,*** | 42.81 ± 1.4 |
For comparisons within each intensive care unit (week days versus week nights, weekend days versus weekend nights, week days versus weekend days and week nights versus weekend nights), matching symbols illustrate significant differences with the number of symbols representing the level of significance: † P < .013, †† P < .01, ††† P < .001, *** P < .001. Results of statistical comparisons between each ICU are presented in the text. Values are mean ± SD.
Figure 3.
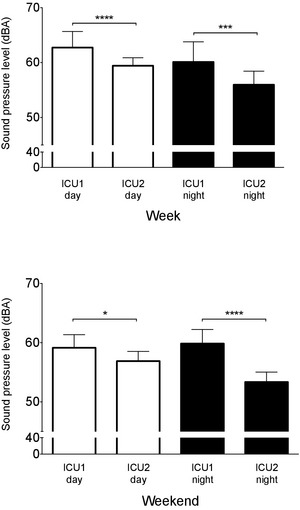
Intensive care unit (ICU)1 has higher equivalent sound pressure levels (LA eq) than ICU2 during both week days and nights (top panel) and weekend days and nights (bottom panel). Data are mean ± SD. *P < .05, ***P < .001, ****P < .0001.
Figure 4.
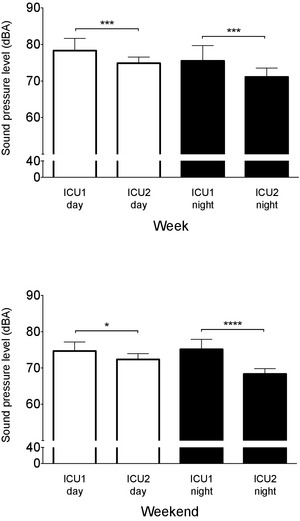
Intensive care unit (ICU)1 has higher mean peak sound pressure levels (LA max) than ICU2 during both week days and nights (top panel) and weekend days and nights (bottom panel). Data are mean ± SD. *P < .05, ***P < .001, ****P < .0001.
Figure 5.
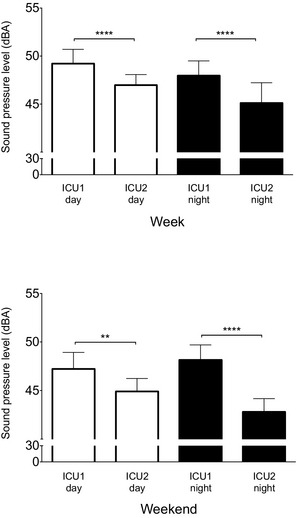
Intensive care unit (ICU)1 has higher background sound pressure levels (LA 90) than ICU2 during both week days and nights (top panel) and weekend days and nights (bottom panel). Data are mean ± SD. **P < .01, ****P < .0001.
Figure 6.
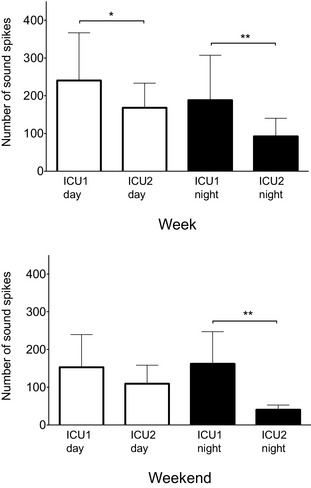
The number of sound spikes observed at each intensive care unit (ICU) on week days and nights (top panel) and weekend days and nights (bottom panel). Data are mean ± SD. *P = .03 **P = .003 (week nights) and P = .001 (weekend nights).
Figure 7.
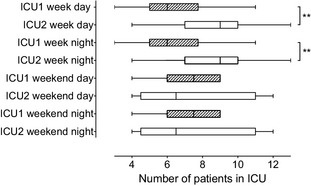
Box and whisker plot showing patient occupancy rates in each intensive care unit (ICU) at different times of day. Box shows median value and is delimited by interquartile range. Whiskers are range (minimum, maximum). **P = .003.
Sound Pressure Levels
The equivalent continuous sound level (LAeq) was higher in ICU1 than in ICU2 at every time point compared (Fig 3). The mean differences ranged from 2.3 to 6.8 dBA (Table 2) indicating that ICU1 could be as much as 50% louder, such as when comparing weekend nights (ICU1, 59.9 ± 2.4 dBA; ICU2, 53.4 ± 1.7 dBA; P < .0001; Fig 3). The next largest observable mean difference was during week nights (mean difference, 4.1 dBA; P < .001), followed by week days (mean difference, 3.3 dBA; P < .0001), and weekend days (mean difference, 2.3 dBA; P < .05).
Differences in LAeq within ICU1 and ICU2 were approximately 3 dBA between week (62.7 ± 2.9 dBA) and weekend days (59.2 ± 2.2 dBA; P < .01; ICU1), and weekend days (56.9 ± 1.6 dBA) and nights (53.4 ± 1.7; P < .001; ICU2; Table 2). These results approximate a difference in loudness of approximately 20% (Table 1).
This pattern of differences persisted for both the maximum sound levels (LAmax) and background noise levels (LA90) during both week and weekend time points (Table 2 and Figs 4, 5).
The largest difference in LAmax between ICU1 and ICU2 was recorded during weekend nights (ICU1, 75.1 ± 2.7 dBA; ICU2, 68.3 ± 1.5 dBA; P < .0001; Fig 4) with a mean difference of nearly 7 dBA, comparable to a difference in loudness in excess of 50% between ICUs. For the other time periods compared, mean differences were in the range of 3 dBA (Fig 5). In ICU1, LAmax changed minimally between week and weekend nights, and between weekend days and nights (Table 2). The same comparisons in ICU2 showed a larger difference between weekend days and nights, with a mean difference of 4 dBA.
A similar pattern was observed for LA90. As with LAmax and LAeq, the largest difference between the ICUs occurred on weekend nights (ICU1, 48.2 ± 1.6 dBA; ICU2, 42.8 ± 1.4 dBA; P < .0001; Fig 5) with background noise in ICU1 being 50% louder than in ICU2. At other time periods, the mean differences ranged from 2 to 3 dBA (Fig 5). Within each ICU, LA90 did not differ by more than 2 dBA among the compared time points, showing little variation in the levels of background noise regardless of the time of day or time of week (Table 2).
Sound Spikes
The number of sounds spikes >80 dBA in ICU1 was considerably higher than in ICU2 during the majority of the compared time points (Fig 6). The largest differences were observed during week nights, when the number of observed spikes was double in ICU1 (188.4 ± 119.0) compared with ICU2 (92.4 ± 47.9, P = .003) and during weekend nights, when the number of observed spikes was 4‐fold higher in ICU1 (162.3 ± 84.9) compared with ICU2 (40.4 ± 12.2; P = .001). A smaller difference in spike number was observed during week days (ICU1, 240.5 ± 126.3; ICU2, 168.2 ± 65.2; P = .03) and no difference was observed during weekend days (ICU1, 152.9 ± 86.8; ICU2, 109.3 ± 49.1; P = .24). Examination of spike frequency within each ICU showed that the number of spikes did not differ between days in ICU1 (week days versus week nights, P = .23; weekend days versus weekend nights, P = .63; week days versus weekend days, P = .18; week nights versus weekend nights, P = .65). In contrast, ICU2 had the fewest sound spikes during weekend night time periods (week nights versus weekend nights, P = .004; weekend days versus weekend nights, P = .004) with approximately half as many sound spikes observed. There were no differences between week days and week nights (P = .34) and week days and weekend days (P = .37).
ICU Occupancy
Occupancy rates differed between ICUs during week days (ICU1, 6 [3,11] patients; ICU2 9 [4,13] patients; P = .003) and week nights (ICU1, 6 [3,11] patients; ICU2, 9 [4,13] patients; P = .003; Fig 7). There were no significant differences at other times (weekend days and nights, ICU1, 7.5 [4,9] patients; ICU2 6.5 [4,12]; P = .8221).
Discussion
The crucial findings of this study were: (1) a marked difference in sound levels between the 2 veterinary ICUs studied, with ICU1 being consistently noisier than ICU2 despite lower occupancy rates; (2) a significantly higher number of sound spikes >80 dBA in ICU1 compared with ICU2; and (3) diurnal variation in sound levels in ICU2 but not ICU1. Together, these data show that the soundscape in the 2 veterinary ICUs studied is comparable to those of ICUs in human hospitals for both frequency of sound spikes and sound pressure levels (LAeq, LAmax, LA90). These findings raise the possibility that noise plays a role in sleep disruption in veterinary patients with potential effects on recovery from critical illness.
Florence Nightingale documented concerns regarding the impact of noise on human patients in 1859: “Unnecessary noise, then, is the most cruel absence of care which can be inflicted either on sick or well.”32 Sleep disruption (largely as a result of noise) however, has been consistently documented in ICUs in human hospitals, along with a progressive annual increase in noise levels.3, 7, 10, 15, 16 The causal relationship between noise and sleep has been identified using both objective (polysomnography) and subjective (patient self‐reports) measures.7, 21, 23, 33, 34, 35, 36
Sleep disruption in the ICU is multifactorial, with extrinsic (eg noise, light, treatment interventions, temperature) and intrinsic (eg patient factors: pain, anxiety, disease) sources.3, 4, 5, 12, 37 Noise is a major cause of sleep disruption in the ICU, responsible for 17–53% of awakenings and arousals depending on the patient population and reporting methods.3, 7, 10, 15
Similar studies in the human literature (using continuous sound recording for ≥24 h), found mean equivalent sound levels (LAeq) of 50–72 dBA in ICU environments.3, 7, 11, 16, 17, 18 These findings are consistent with our data, confirming that ICUs in both human and veterinary medicine exceed current EPA and WHO recommendations.19, 20 Stress in hospitalized dogs has been documented using physiological, behavioral, and biochemical measurements.38, 39, 40 Although noise level recommendations for veterinary ICUs do not exist, it has been shown that the behavior of dogs is affected by environmental noise, both within a simulated ICU environment and in a rescue shelter.29, 30, 38 In addition, noise within the ranges typically recorded in ICUs can have detrimental effects on staff performance and stress.18, 41, 42, 43
Our data show that even background sound levels (LA90) exceeded WHO and EPA recommendations for LAeq during both day and night times at the majority of time points assessed. In comparison to the higher EPA guidelines, LA90 levels were regularly 2–4 dBA higher in both ICUs during the day and 7–13 dBA higher at night, corresponding to 20–200% increases in loudness.
Without spectral analysis it is not possible to identify specific causes of background noise, but common contributors are air conditioning systems, conversation, life‐support devices, and cleaning equipment.17, 31 Night time LAmax levels in both ICUs were consistently 30–35 dBA above the WHO recommendation of 40 dBA, 8 times louder than recommended.
Few studies in human hospitals have reported LAmax and LA90 parameters.17, 18, 31 Similar to our findings, these studies have reported high levels for these parameters, including LAmax >50 dBA for 90% of the recording period (continuous recording over 5 wk days), and LA90, LAeq, and LAmax of 47, 56, and 90 dBA, respectively, over a 6‐month recording period.17, 18
The difference in sound levels between the 2 ICUs studied is similar to the documented variability among ICUs in human hospitals.3, 7, 11, 16, 17, 18 Because small differences in dBA level (as little as 2 dBA) can result in sleep disruption (arousals and awakenings), these inter‐ICU differences are clinically relevant.7
The existence of diurnal variation in LAeq in ICUs in human hospitals is unclear. Differences in 3–4 dBA are reported frequently but not all studies performed statistical comparisons.3, 7, 11, 17, 18 In our data, a significant difference was observed only in ICU2 (weekend day versus weekend night).
Evidence from studies in human medicine suggests that both the number of sound spikes (>70–80 dBA) and the overall noise level contribute to arousal and awakening from sleep.7, 23 Few studies have reported spectral frequency in the hospital environment, with limited investigation on the relationship between spectral frequency and sleep disturbance, but low frequency noise is a reported cause of sleep disturbance.15, 44 In a study of ICU patients, 31% of arousals and awakenings were caused by sound spikes exceeding 75 dBA.7 A similar arousal level (35%) has been identified in healthy volunteers exposed to short (0.5 s) sound spikes (85 dBA).45 The number of spikes occurring per hour varies widely among studies, ranging from 10 to 460 during the day and from 2 to 147 at night.7, 11, 21, 22 Differences in classification of day and night time periods and counting methods account for some of the variation. The numbers of spikes observed in our study fell within ranges reported for ICUs in human hospitals.
In human medicine, the number of sound spikes >80 dBA shows diurnal variation, higher during the day than at night.7, 21, 22 Data collected from ICU2 showed a similar diurnal pattern, with significantly fewer sound spikes on weekend nights, but week days and nights did not differ. In contrast, ICU1 did not exhibit diurnal variation and had consistently more sound spikes than ICU2.
Whenever the sources of sound spikes have been identified, many have been associated with modifiable causes. In one report, television and human conversation accounted for 50% of sound spikes >80 dBA,21 and in another report the highest frequency of spikes >80 dBA occurred during staff shift changeover.17
The observed differences in noise levels between ICUs in our study were not associated with differences in patient occupancy. It is likely, therefore, that ICU location and dimensions contributed to the observed differences.
The ICU1 has a smaller floor area than ICU2, resulting in a higher density of patients (and staff). Building materials at each location were similar, consisting primarily of hard surfaces with no specific noise reduction material. In addition, ICU1 is located at the center of the hospital and can function as a thoroughfare for staff, whereas ICU2 is located at the periphery of the building and does not form a shortcut to other areas. Although ICU1 has the potential to form a more enclosed space with the presence of sliding doors (versus the open archways of ICU2), these doors are usually kept open. Together these factors are likely to have resulted in increased reverberation time (time for sound to decay) in ICU1.15, 46 The presence of staff in the ICUs was not recorded and no steps were taken to modify staff behavior. Although it is possible that staff behavior differed between ICUs, it is equally likely that relative staff density (resulting from ICU size differences) affected noise levels. Staff numbers in each of the study ICUs fluctuated considerably and relatively unpredictably during the 24‐hour cycles, but the mornings (approximately 0900) tended to be busier periods, coinciding with hospital rounds.
Investigation of noise sources has identified staff conversations and alarms as important contributors, indicating the potential to decrease noise levels by changes in practice.5, 7, 10 Whenever interventions to decrease noise exposure have been introduced, sleep quality has improved.21, 33, 34, 35, 36Interventions have included ear plugs, changes in staff behavior, decreasing alarm and telephone volumes and sound masking (addition of other sound such as ocean sounds). The use of acoustic absorbing material has been shown to substantially decrease environmental sound levels by approximately 3 dBA and may be simpler to implement than achieving sustained change in human behavior.31, 46, 47
Although the relative importance of extrinsic and intrinsic factors contributing to sleep disruption for veterinary patients is unclear, noise and light do affect behavior. Activity levels (measured by accelerometry as a proxy for wakefulness) of healthy dogs housed in an artificial veterinary ICU are affected by extraneous auditory and visual stimuli.30 Six experimental dogs were significantly more active during times of high stimulation (when exposed to 50–80 dBA of recorded veterinary ICU noise and 24‐h lighting) compared to low auditory and light exposure. Similarly, dogs in a rescue shelter were found to spend significantly more time resting when classical music was played and more time barking when exposed to heavy metal music.29
The results of this study should be interpreted in the context of the following limitations: microphone placement was selected to represent the average sound level within the ICU and may not have reflected the experience of individual patients. All sound recordings were performed using an A‐weighted scale which is weighted to match human hearing. These data do not allow conclusions to be drawn regarding sleep disturbance, since the relationship between noise and sleep in hospitalized dogs has yet to be studied.
The microphones in our study were suspended from the ceiling of each ICU, at the approximate center of the room. In the human literature, microphones commonly are suspended close to a patient's head to allow more accurate determination of noise at patient level.3, 11, 17, 21 This would have presented a logistical challenge in the veterinary setting, because animal patients would be likely to interfere with the device.
The A‐weighted dB scale was employed to facilitate comparison with the existing human and veterinary literature. The few studies that examined noise and behavior in dogs have used the A‐weighted scale.29, 30, 48 This scale approximates the response of the human ear to sound frequencies, eliminating lower and higher frequency sounds not audible to humans. Although the range of frequencies audible to dogs (approximately 67–45 kHz) differs from those detectable by the human ear (approximately 20–20 kHz),49, 50 the A‐weighted decibel scale spans most frequencies encountered in the hospital environment.18 In addition, higher frequencies attenuate more rapidly and hence are potentially less detrimental.15 Therefore, low frequency sounds in particular may adversely affect sleep and recovery of dogs in a veterinary ICU.
In conclusion, sound pressure levels in the 2 veterinary ICUs studied were similar to those previously reported in ICUs in human hospitals, exceeding international guidelines for hospital noise. Unexpected significant differences in noise levels and sound spikes >80 dBA were observed between the 2 veterinary ICUs. In general, fewer significant differences in sounds levels were observed in ICU1 than in ICU2, indicating that (as well as being more noisy than ICU2) ICU1 was consistently more noisy.
Similar to ICUs in human hospitals, the noisier ICU did not display diurnal variation in noise levels. The observed differences between veterinary ICUs may result from differences in infrastructure between centers. The effects of environmental noise on sleep in veterinary patients is unclear, but there is some documented evidence of its effects on activity and behavior. Additional research is required to understand noise perception in dogs and its physiological impact on sleep quality and duration, as well as to test the implementation of noise reduction strategies in a veterinary ICU. To facilitate these studies, accurate identification of arousal states is essential, necessitating the use of polysomnography.51, 52 If clinically relevant sound reduction is possible, there is the potential to improve the sleep and recovery of critically ill veterinary patients.
Acknowledgments
The authors thank Dr Valerie Madden (Cornell University College of Veterinary Medicine, USA) and Mr Jim Ulicki (Xscala Sound and Vibration) for technical assistance.
Funding: Clinical Research Fund, Faculty of Veterinary Medicine, University of Calgary and Office of Community Partnerships of the Faculty of Veterinary Medicine, University of Calgary.
Conflict of Interest Declaration: Authors disclose no conflict of interest.
Off‐label Antimicrobial Declaration: Authors declare no off‐label use of antimicrobials.
Work performed at: CARE Centre Animal Hospital, T2H 2Y4 and Western Veterinary Specialist and Emergency Centre, T3C 0J8 Both referral clinics are located in Calgary, Alberta, Canada.
Meeting presentation: Preliminary data, approximately 25%, were presented at Association of Veterinary Anaesthetists Spring Meeting, London (UK) April 10–12, 2013 (published proceedings: Vet Anaesth Analg 2013 40:18)
Footnotes
Sound level meter Type 2250, fast response time (125 ms), reference 20 μPa, 16.6–140 dB(A), (Bruel and Kjær, Nærum, Denmark, DK‐2850)
Prepolarized free‐field condenser microphone, Type 4189, with 65 mm windscreen (Bruel and Kjær, Nærum, Denmark, DK‐2850)
BZ 5503 Utility Software for Hand Held Analyzers (Bruel and Kjær, Nærum, Denmark, DK‐2850)
Graphpad Prism version 6.0c (GraphPad Software Inc., La Jolla, USA, 92037)
IBM SPSS Statistics version 20 (IBM Canada Ltd., Markham, ON, Canada, L3R 9Z7)
References
- 1. Rod NH, Kumari M, Lange T, et al. The joint effect of sleep duration and disturbed sleep on cause‐specific mortality: results from the Whitehall II cohort study. PLoS One 2014;9:e91965. [DOI] [PMC free article] [PubMed] [Google Scholar]
- 2. Everson CA. Functional consequences of sustained sleep deprivation in the rat. Behav Brain Res 1995;69:43–54. [DOI] [PubMed] [Google Scholar]
- 3. Freedman NS, Gazendam J, Levan L, et al. Abnormal sleep/wake cycles and the effect of environmental noise on sleep disruption in the intensive care unit. Am J Respir Crit Care Med 2001;163:451–457. [DOI] [PubMed] [Google Scholar]
- 4. Aurell J, Elmqvist D. Sleep in the surgical intensive care unit: continuous polygraphic recording of sleep in nine patients receiving postoperative care. Br Med J (Clin Res Ed) 1985;290:1029–1032. [DOI] [PMC free article] [PubMed] [Google Scholar]
- 5. Freedman NS, Kotzer N, Schwab RJ. Patient perception of sleep quality and etiology of sleep disruption in the intensive care unit. Am J Respir Crit Care Med 1999;159:1155–1162. [DOI] [PubMed] [Google Scholar]
- 6. Gabor JY, Cooper AB, Hanly PJ. Sleep disruption in the intensive care unit. Curr Opin Crit Care 2001;7:21–27. [DOI] [PubMed] [Google Scholar]
- 7. Gabor JY, Cooper AB, Crombach SA, et al. Contribution of the intensive care unit environment to sleep disruption in mechanically ventilated patients and healthy subjects. Am J Respir Crit Care Med 2003;167:708–715. [DOI] [PubMed] [Google Scholar]
- 8. Orr WC, Stahl ML. Sleep disturbances after open heart surgery. Am J Cardiol 1977;39:196–201. [DOI] [PubMed] [Google Scholar]
- 9. Cooper AB, Thornley KS, Young GB, et al. Sleep in critically ill patients requiring mechanical ventilation. Chest 2000;117:809–818. [DOI] [PubMed] [Google Scholar]
- 10. Hilton BA. Quantity and quality of patients' sleep and sleep‐disturbing factors in a respiratory intensive care unit. J Adv Nurs 1976;1:453–468. [DOI] [PubMed] [Google Scholar]
- 11. Elliott R, McKinley S, Cistulli P, et al. Characterisation of sleep in intensive care using 24‐hour polysomnography: an observational study. Crit Care 2013;17:R46. [DOI] [PMC free article] [PubMed] [Google Scholar]
- 12. Novaes MA, Knobel E, Bork AM, et al. Stressors in ICU: perception of the patient, relatives and health care team. Intensive Care Med 1999;25:1421–1426. [DOI] [PubMed] [Google Scholar]
- 13. Kamdar BB, Needham DM, Collop NA. Sleep deprivation in critical illness: its role in physical and psychological recovery. J Intensive Care Med 2012;27:97–111. [DOI] [PMC free article] [PubMed] [Google Scholar]
- 14. Hardin KA. Sleep in the ICU: potential mechanisms and clinical implications. Chest 2009;136:284–294. [DOI] [PubMed] [Google Scholar]
- 15. Xie H, Kang J, Mills GH. Clinical review: the impact of noise on patients' sleep and the effectiveness of noise reduction strategies in intensive care units. Crit Care 2009;13:208. [DOI] [PMC free article] [PubMed] [Google Scholar]
- 16. Busch‐Vishniac IJ, West JE, Barnhill C, et al. Noise levels in Johns Hopkins Hospital. J Acoust Soc Am 2005;118:3629–3645. [DOI] [PubMed] [Google Scholar]
- 17. Elliott RM, McKinley SM, Eager D. A pilot study of sound levels in an Australian adult general intensive care unit. Noise Health 2010;12:26–36. [DOI] [PubMed] [Google Scholar]
- 18. Ryherd EE, Waye KP, Ljungkvist L. Characterizing noise and perceived work environment in a neurological intensive care unit. J Acoust Soc Am 2008;123:747–756. [DOI] [PubMed] [Google Scholar]
- 19. The US Environmental Protection Agency Office of Noise Abatement and Control . Information on levels of environmental noise requisite to protect public health and welfare with an adequate margin of safety. 1974.
- 20. Berglund B, Lindvall T, Schwela DH, et al. Guidelines for community noise. 1999.
- 21. Kahn DM, Cook TE, Carlisle CC, et al. Identification and modification of environmental noise in an ICU setting. Chest 1998;114:535–540. [DOI] [PubMed] [Google Scholar]
- 22. Meyer TJ, Eveloff SE, Bauer MS, et al. Adverse environmental conditions in the respiratory and medical ICU settings. Chest 1994;105:1211–1216. [DOI] [PubMed] [Google Scholar]
- 23. Aaron JN, Carlisle CC, Carskadon MA, et al. Environmental noise as a cause of sleep disruption in an intermediate respiratory care unit. Sleep 1996;19:707–710. [DOI] [PubMed] [Google Scholar]
- 24. Backus J. The Acoustical Foundations of Music. New York: WW Norton and Company, Inc; 1969. [Google Scholar]
- 25. Rossing TD. The Science of Sound. Menlo Park, CA: Addison‐Wesley Publishing Company, Inc.; 1982. [Google Scholar]
- 26. Lucas EA, Foutz AS, Dement WC, et al. Sleep cycle organization in narcoleptic and normal dogs. Physiol Behav 1979;23:737–743. [DOI] [PubMed] [Google Scholar]
- 27. Nishino S, Tafti M, Sampathkumaran R, et al. Circadian distribution of rest/activity in narcoleptic and control dogs: assessment with ambulatory activity monitoring. J Sleep Res 1997;6:120–127. [PubMed] [Google Scholar]
- 28. Lucas EA, Powell EW, Murphree OD. Baseline sleep‐wake patterns in the pointer dog. Physiol Behav 1977;19:285–291. [DOI] [PubMed] [Google Scholar]
- 29. Wells DL, Graham L, Hepper PG. The influence of auditory stimulation on the behaviour of dogs housed in a rescue shelter. Anim Welf 2002;11:385–393. [Google Scholar]
- 30. Gent T, Pang DSJ, Sauvage V, et al. A pilot study of the effect of environmental alterations on activity levels in dogs in an intensive care unit setting. Vet Anaesth Analg 2010;37:382–384. [Google Scholar]
- 31. Walder B, Francioli D, Meyer JJ, et al. Effects of guidelines implementation in a surgical intensive care unit to control nighttime light and noise levels. Crit Care Med 2000;28:2242–2247. [DOI] [PubMed] [Google Scholar]
- 32. Nightingale F. Noise. Notes on Nursing: What It is, and What It is Not. New York: Dover Publications, Inc; 1969;44–58. [Google Scholar]
- 33. Li SY, Wang TJ, Vivienne Wu SF, et al. Efficacy of controlling night‐time noise and activities to improve patients' sleep quality in a surgical intensive care unit. J Clin Nurs 2011;20:396–407. [DOI] [PubMed] [Google Scholar]
- 34. Wallace CJ, Robins J, Alvord LS, et al. The effect of earplugs on sleep measures during exposure to simulated intensive care unit noise. Am J Crit Care 1999;8:210–219. [PubMed] [Google Scholar]
- 35. Patel J, Baldwin J, Bunting P, et al. The effect of a multicomponent multidisciplinary bundle of interventions on sleep and delirium in medical and surgical intensive care patients. Anaesthesia 2014;69:540–549. [DOI] [PubMed] [Google Scholar]
- 36. Williamson JW. The effects of ocean sounds on sleep after coronary artery bypass graft surgery. Am J Crit Care 1992;1:91–97. [PubMed] [Google Scholar]
- 37. Bourne RS, Mills GH. Sleep disruption in critically ill patients–pharmacological considerations. Anaesthesia 2004;59:374–384. [DOI] [PubMed] [Google Scholar]
- 38. Bowman A, Scottish S, Dowell FJ, et al. ‘Four Seasons’ in an animal rescue centre; classical music reduces environmental stress in kennelled dogs. Physiol Behav 2015;143:70–82. [DOI] [PubMed] [Google Scholar]
- 39. Bragg RF, Bennett JS, Cummings A, et al. Evaluation of the effects of hospital visit stress on physiologic variables in dogs. J Am Vet Med Assoc 2015;246:212–215. [DOI] [PubMed] [Google Scholar]
- 40. Part CE, Kiddie JL, Hayes WA, et al. Physiological, physical and behavioural changes in dogs (Canis familiaris) when kennelled: testing the validity of stress parameters. Physiol Behav 2014;133:260–271. [DOI] [PubMed] [Google Scholar]
- 41. Stevenson RA, Schlesinger JJ, Wallace MT. Effects of divided attention and operating room noise on perception of pulse oximeter pitch changes: a laboratory study. Anesthesiology 2013;118:376–381. [DOI] [PMC free article] [PubMed] [Google Scholar]
- 42. Murthy VS, Malhotra SK, Bala I, et al. Detrimental effects of noise on anaesthetists. Can J Anaesth 1995;42:608–611. [DOI] [PubMed] [Google Scholar]
- 43. Morrison WE, Haas EC, Shaffner DH, et al. Noise, stress, and annoyance in a pediatric intensive care unit. Crit Care Med 2003;31:113–119. [DOI] [PubMed] [Google Scholar]
- 44. Persson Waye K. Effects of low frequency noise on sleep. Noise Health 2004;6:87–91. [PubMed] [Google Scholar]
- 45. Carley DW, Applebaum R, Basner RC, et al. Respiratory and arousal responses to acoustic stimulation. Chest 1997;112:1567–1571. [DOI] [PubMed] [Google Scholar]
- 46. Blomkvist V, Eriksen CA, Theorell T, et al. Acoustics and psychosocial environment in intensive coronary care. Occup Environ Med 2005;62:e1. [DOI] [PMC free article] [PubMed] [Google Scholar]
- 47. Johnson AN. Neonatal response to control of noise inside the incubator. Pediatr Nurs 2001;27:600–605. [PubMed] [Google Scholar]
- 48. Scheifele P, Martin D, Clark JG, et al. Effect of kennel noise on hearing in dogs. Am J Vet Res 2012;73:482–489. [DOI] [PubMed] [Google Scholar]
- 49. Lauer AM, El‐Sharkawy AM, Kraitchman DL, et al. MRI acoustic noise can harm experimental and companion animals. J Magn Reson Imaging 2012;36:743–747. [DOI] [PubMed] [Google Scholar]
- 50. Heffner HE. Hearing in large and small dogs: absolute thresholds and size of the tympanic membrane. Behav Neurosci 1983;97:310–318. [Google Scholar]
- 51. Pang DS, Robledo CJ, Carr DR, et al. An unexpected role for TASK‐3 potassium channels in network oscillations with implications for sleep mechanisms and anesthetic action. Proc Natl Acad Sci USA 2009;106:17546–17551. [DOI] [PMC free article] [PubMed] [Google Scholar]
- 52. Authier S, Bassett L, Pouliot M, et al. Effects of amphetamine, diazepam and caffeine on polysomnography (EEG, EMG, EOG)‐derived variables measured using telemetry in Cynomolgus monkeys. J Pharmacol Toxicol Methods 2014;70:86–93. [DOI] [PubMed] [Google Scholar]


