

Abstract
Background
Symmetric dimethylarginine (SDMA) is a small molecule formed by methylation of arginine, and released into blood during protein degradation. SDMA is primarily eliminated by renal excretion and is a promising endogenous marker of glomerular filtration rate (GFR).
Objectives
To validate an assay for SDMA measurement, determine stability of SDMA in blood, and compare SDMA with serum creatinine concentration (sCr) and GFR for early detection of decreasing kidney function in dogs with chronic kidney disease (CKD).
Animals
Eight male dogs affected with X‐linked hereditary nephropathy and 4 unaffected male littermates.
Methods
Prospective study validating SDMA measurement using liquid chromatography‐mass spectrometry, assessing stability of SDMA in serum and plasma, and serially determining sCr, SDMA, and GFR (using iohexol clearance) in dogs during progression from preclinical disease to end‐stage renal failure. Correlations were determined using linear regression. Timepoints at which sCr, SDMA, and GFR identified decreased renal function were compared using defined cutoffs, trending in an individual dog, and comparison with unaffected littermates.
Results
Symmetric dimethylarginine was highly stable in serum and plasma, and the assay demonstrated excellent analytical performance. In unaffected dogs, SDMA remained unchanged whereas in affected dogs, SDMA increased during disease progression, correlating strongly with an increase in sCr (r = 0.95) and decrease in GFR (r = −0.95). Although trending improved sCr's sensitivity, SDMA identified, on average, <20% decrease in GFR, which was earlier than sCr using any comparison method.
Conclusions and Clinical Importance
Symmetric dimethylarginine is useful for both early identification and monitoring of decreased renal function in dogs with CKD.
Keywords: canine, glomerular filtration rate, serum creatinine, X‐linked hereditary nephropathy
Abbreviations
- ADMA
asymmetric dimethylarginine
- BCS
body condition score
- CI
confidence interval
- CKD
chronic kidney disease
- CV
coefficient of variation
- GFR
glomerular filtration rate
- m/z
mass to charge ratio
- MMA
monomethylarginine
- sCr
serum creatinine
- SDMA
symmetric dimethylarginine
- XLHN
X‐linked hereditary nephropathy
Chronic kidney disease (CKD) is an insidious and serious illness in both dogs and cats. Recent diagnostic efforts have focused on early determination of renal compromise so that renoprotective therapies can be instituted early in the disease process, thereby slowing disease progression. Estimating glomerular filtration rate (GFR) can aid in the clinical assessment of kidney function. The most widely used endogenous serum biochemical marker of GFR is serum creatinine concentration (sCr). However, sCr is often cited as an insensitive marker for detecting an early decrease in kidney function. Furthermore, muscle mass is a primary nonrenal factor affecting sCr. Therefore, its reliability for identifying small but clinically relevant decreases in GFR can be poor in animals with decreased muscle mass (e.g., cachectic or geriatric animals).
Methylated arginines (symmetric dimethylarginine [SDMA], asymmetric dimethylarginine [ADMA] and monomethylarginine [MMA]) are derived from intranuclear methylation of l‐arginine by protein‐arginine methyltransferase and released into circulation after proteolysis.1 Although ADMA is largely cleared by enzymatic hydrolysis, SDMA is primarily eliminated by renal excretion,2 suggesting SDMA as a potential endogenous marker of GFR.3, 4 Major nonrenal influences on serum SDMA have not been consistently identified in humans, although obesity,5 sex, and age may minimally influence concentrations.6 Additionally, some degree of enzymatic degradation is possible.3, 7 Overall, however, nonrenal influences on SDMA appear to be minor.
Many studies support SDMA as a marker of renal disease, including a large meta‐analysis of SDMA studies in humans, where SDMA correlated strongly with inulin clearance and sCr.4 Increased SDMA also has been associated with both all‐cause and cardiovascular mortality in people.8 Although SDMA has been implicated as an inflammatory mediator in CKD,9 any specific biological role of SDMA, and in particular, any influence of SDMA on myocardial or renal function, is still ill‐defined.3, 10
Recent studies determined that SDMA correlates strongly with GFR in cats with and without evidence of decreased renal function.11, 12, 13 Importantly, SDMA consistently increased months to years earlier than sCr in cats with naturally occurring CKD.12 SDMA also correlated more strongly with GFR than did sCr in older cats with muscle wasting, and SDMA increased as cats aged as opposed to sCr, which decreased with aging.13 Although studies in dogs are limited, 1 study demonstrated increased plasma SDMA in dogs with partial nephrectomy, and GFR correlated more strongly with SDMA (r = −0.85) than sCr (r = −0.75).14 Studies on nonrenal influences in dogs showed no influence of lean body mass, age, breed, sex, or exercise on serum SDMA.15, 16, 17 However, adjusted body weight weakly correlated with SDMA when excluding sCr as an explanatory variable, and higher SDMA was found in larger dogs, presumably because of lower GFR in large versus small dogs.15
The primary objectives of this study were to validate an assay for measurement of SDMA in dogs, assess its stability in blood samples, and compare the utility of SDMA for identifying onset of decreased renal function with sCr and GFR (as determined by iohexol clearance) in dogs with progressive CKD.
Materials and Methods
SDMA Assay Validation
Symmetric dimethylarginine was extracted from 50 μL samples (serum or plasma) as well as calibrators1 and quality control standards2 and measured by liquid chromatography‐mass spectrometry as previously described.12 Fragmentation of SDMA and the internal standard (D‐7‐ADMA2) resulted in differently‐sized fragments, allowing for differential detection of these molecules that otherwise would have the same mass‐to‐charge ratio (m/z). The observed transitions for SDMA and D‐7‐ADMA were m/z = 203.1 to 172.1 and m/z = 210.2 to 164.2, respectively. SDMA was quantified using a standard curve obtained using 9 concentrations of calibrator solutions, prepared in charcoal‐stripped canine serum as previously described.12 To assess whether the lowest concentration of calibrator could be distinguished from the blank, SDMA was measured in each 5 times. The signal‐to‐noise ratio of the total ion counts was determined (dividing the calibrator result with the blank result), setting its minimum acceptable value >10. Linearity was determined by running 5 replicates of a 9‐point standard curve (1.56–100 μg/dL). Sample recovery was determined using 3 serum samples spiked with SDMA1 to obtain concentrations of 5.7, 28, and 58.5 μg/dL. For intra‐assay precision, 9 different dilutions (range, 1.56–100 μg/dL) were run 5 times in the same day, whereas for inter‐assay precision, 9 different dilutions were measured for each of 5 days. Dilutional integrity was determined by diluting 12 samples with 50 μg/dL and 200 μg/dL concentrations by factors 2 and 10, respectively. Operator and machine variability were determined using 2 operators and 2 instruments, repeating the 9‐point standard curve 2 times for the 1st operator versus 3 times for the 2nd operator, and 2 times for each instrument.
The effect of interfering substances also was evaluated. For hemolysis, lipemia, and bilirubin, canine serum samples were analyzed using 5 concentrations of spiked lysate from separated and washed canine red blood cells, Intralipid 20% Emulsion3 (final concentrations of 0, 80, 160, 320, and 400 mg/dL) or a solution of lyophilized bilirubin3 (final concentrations of 31, 63, 125, and 250 μM), respectively. Interference of arginine3 and its other methylated derivatives, MMA3 and ADMA,3 along with homocitrulline3 also were studied, spiked into canine serum samples to obtain 5 different concentrations (1,000, 500, 250, 125 and 62.5 μg/dL).
SDMA Stability
Canine serum4 (from red top and serum separator tubes) and plasma4 (EDTA and lithium heparin) were used to determine SDMA stability. Samples were stored at 2 different temperatures (4°C and room temperature [20°C]), and 3 different concentrations of SDMA (12, 35, and 100 μg/dL) were evaluated. SDMA was measured on days 1, 3, and 7 for samples stored at 20°C, and days 1, 3, 7, 10, and 14 for samples stored at 4°C, where day 1 was the day after blood collection. Three freeze‐thaw cycles were performed on each sample type over the course of 3 days to determine the effect of freeze thaw cycles on SDMA concentration.
Animals and Study Design
Prospective analysis was performed for 8 juvenile male dogs affected with X‐linked hereditary nephropathy (XLHN) and 4 unaffected male littermates. The dogs were members of a single family maintained in a colony at Texas A&M University. In this kindred, XLHN is caused by a mutation in the gene encoding the α5 chain of type IV collagen.18 The salient clinical and pathologic features of the nephropathy that occurs in affected males have been described, and end‐stage renal disease develops between 6 and 18 months of age (median, 10 months).19 No treatments were administered to dogs used in this study. The study protocol was reviewed and approved by the Texas A&M University Institutional Animal Care and Use Committee.
Sample Collection
Blood and midstream voided urine samples were collected on a weekly basis starting at 7 weeks of age. GFR was determined by iohexol clearance using an 8‐point sampling protocol starting at 9 weeks of age. GFR was determined monthly and when dogs reached certain milestones of disease (milestone 1: onset of microalbuminuria [2 consecutive weeks >1.0 mg/dL albumin in urine diluted to 1.010 specific gravity]), milestone 2: urine protein creatinine ratio ≥2 [2 consecutive weeks], milestone 3: sCr ≥ 1.2 mg/dL, milestone 4: sCr ≥ 2.4 mg/dL, and milestone 5: sCr ≥ 5 mg/dL). Unaffected dogs were paired with an affected littermate for milestone evaluations. Dogs were fasted overnight before GFR determination but allowed free access to water. In the morning, dogs were given a bolus IV infusion of 300 mg I/kg of iohexol5 over 3 minutes into a cephalic vein, followed by 2 mL saline. Blood was drawn by alternating jugular venipunctures at 5, 15, 30, 60, 120, 180, 240, and 360 minutes after the 1st min of infusion. Blood was collected immediately before iohexol injection for sCr and SDMA measurement. Serum was separated within 2 hours of collection and sCr measured immediately.6 For SDMA and total iohexol determination,7 , 20 serum was aliquoted and frozen at −80°C until measurement within 1 year postcollection. GFR was calculated from iohexol clearance by the noncompartmental method using WinNonlin.8
Statistical Methods
For SDMA assay validation, linearity was determined using the correlation coefficient of the standard curve, and sample recovery, accuracy, dilutional integrity, and effect of interfering substances were determined using observed/expected ratios. For intra‐ and inter‐assay precision, the coefficient of variation (CV) for each concentration over 5 runs was calculated. For operator comparison, y‐intercepts, slopes, and correlation coefficients of the 9‐point standard curve generated by each operator were calculated. For instrument comparison, percentage difference in calculated values was determined.
Analysis of SDMA in different sample types, including stability at 20°C and 4°C and effect of freeze‐thaw cycles, was performed using a conditional generalized linear effect model with “working” correlation structure. Furthermore, two one‐sided tests (TOST) approach, with 90% confidence intervals (CI) for the differences being calculated within a linear mixed effect model, was used to test for the 95% confidence on equivalence among tube types, storage times, storage temperatures, and pre‐ vs. postfreeze‐thaw samples.21 A clinically relevant equivalence range was chosen to be within 10% of initial values.9
Descriptive statistics of the dogs were performed using medians and ranges at initial onset of each disease milestone. Variability of SDMA for earlier versus later timepoints was estimated using maximum likelihood to obtain a 95% CI for the estimated standard deviation (i.e., for each dog and for each age group [≤20 weeks versus >20 weeks] a linear regression model of SDMA was fit, as a function of age and age2). The use of maximum likelihood allowed for computation of a CI about the standard deviation of the residuals (mean squared error).
Correlation of sCr, SDMA, GFR, age, weight, and body condition score (BCS) were determined using linear regression using standard errors clustered by dog. Log and power transformations were applied as necessary to obtain linear relationships and improve normality of residuals.
Trending of sCr, SDMA, and GFR within an affected dog was performed using linear regression to estimate the change per week (slope) based on the current and 4 previous weekly results. A change in result was considered clinically relevant when the estimated slope was >0.05 for sCr, >0.5 for SDMA for the first of at least 3 consecutive measurements, and ≤−0.2 for GFR. The initial onset of a clinically relevant difference in sCr, SDMA, and GFR between each affected dog and the 4 unaffected dogs was determined by observing a difference of a certain size between the estimated average of the current and 4 previous measurements for the affected dog and the average at that age for all 4 unaffected dogs. The size of the difference required was that which provided a distinction between the affected and unaffected dogs: affected dog sCr > 0.15 mg/dL, SDMA ≥ 3 μg/dL and GFR < 0.7 mL/min/kg compared with the unaffected dog average. For calculating the percentage decrease in GFR identified by sCr and SDMA, a week‐to‐week weighted average of GFR was calculated as previously described.22 The GFR of the affected dog then was compared with the average GFR of the 4 unaffected dogs at that week of age. Analyses were performed using Stata.10
Results
SDMA Assay Validation
The lowest concentration of calibrator (1.56 μg/dL) had a signal‐to‐noise ratio = 104, with CV = 1.8% and accuracy of 98–103% (mean, 101%). Excellent linearity was observed (mean R 2 = 0.9997, accuracy = 95–106%). Sample recovery using spiked SDMA was 95–98%. Intra‐assay precision CV was 1.5–2.8% (mean, 2.2%), with an accuracy of 99–101%. Inter‐assay precision CV was 2.3–3.7% (mean, 2.7%), with an accuracy of 98–101%. For dilutional integrity, accuracy was 95–107% for the 50 μg/dL samples (diluted to 25 μg/dL) and 95–106% for the 200 μg/dL samples (diluted to 20 μg/dL), with CVs < 3% over 12 replicates. Both operators produced similar results, with nearly identical calculated y‐intercepts, slopes, and correlation coefficients of the 9‐point standard curve. The 2 different instruments tested also produced similar results (average % difference of their means = −0.1% [range, −1.8–1.9%]).
No interference on SDMA concentration was found for hemoglobin, lipids, and bilirubin at tested concentrations (recoveries, 94–105%, 103–107%, and 93–101%, respectively). Similarly, arginine, MMA, ADMA, and homocitrulline did not interfere with SDMA measurement (recoveries, 94–106%).
SDMA Stability
Symmetric dimethylarginine concentrations among serum and plasma samples from different tube types, stored at 20°C versus 4°C and exposed versus not exposed to 3 freeze‐thaw cycles were found to be equivalent within the ±10% clinically relevant range (CIs for differences ranged from ±4.1–8.4% for different tube types, ±1.6–3.4% for storage at 20°C versus 4°C, and ±3.5–5.7% for freeze‐thaws versus no freeze‐thaws). The effect of time on SDMA was not significant (P = .09) in samples stored for 7 and 14 days at 20°C and 4°C, respectively, with 95% CI for difference in means being within 11% of initial SDMA concentrations.
Dogs‐Clinical Course
Table 1 shows a summary of selected variables at initial onset of each milestone for all dogs, demonstrating typical progression of CKD in affected dogs versus normal age‐related changes observed in unaffected littermates. Six of the 8 affected dogs reached study endpoint (sCr > 5 mg/dL). Because of renal‐related (n = 2) and nonrenal (n = 1) disease, 3 dogs were euthanized either before study endpoint (before milestone 4, last sCr = 1.7 mg/dL; before milestone 5, last sCr = 3.2 mg/dL) or before full evaluation at milestone 5 (i.e., no GFR obtained; sCr = 6.8 mg/dL).
Table 1.
Summary of selected clinical and laboratory variables in affected dogs with X‐linked hereditary nephropathy (n = 8) and unaffected (n = 4) littermates (median [range]) at initial onset of each milestone.
| Baseline | Milestone 1 | Milestone 2 | Milestone 3 | Milestone 4 | Milestone 5 | |
|---|---|---|---|---|---|---|
| Microalbuminuria | 2nd UPC ≥ 2 | sCr ≥ 1.2 mg/dL | sCr ≥ 2.4 mg/dL | sCr ≥ 5 mg/dL | ||
| Affected | N = 8 | N = 8 | N = 8 | N = 8 | N = 7 or 6a | N = 6a or 5b |
| Age (weeks) | 7 (7–8) | 13.5 (10–19) | 20 (14–29) | 27 (21–39) | 33 (23–48) | 37a (26–52) |
| sCr (mg/dL) | 0.36 (0.30–0.44) | 0.49 (0.34–0.64) | 0.63 (0.47–0.73) | 1.27 (1.20–1.38) | 2.47 (2.40–2.80) | 5.71a (5.41–6.75) |
| BUN (mg/dL) | 3.5 (2–7) | 4.5 (4–8) | 7.5 (5–10) | 16 (13–27) | 33 (31–50) | 115a (77–128) |
| SDMA (μg/dL) | 13.5 (9–14) | 13 (10–15) | 11.5 (10–15) | 22.5 (17–29) | 36 (29–45) | 69b (54–95) |
| GFR (mL/min/kg) | 5.34 (4.75–5.56) | 4.65 (3.33–5.41) | 3.33 (3.00–4.86) | 1.47 (0.99–1.69) | 0.67 (0.65–0.81) | 0.36b (0.28–0.37) |
| USG | 1.019 (1.005–1.024) | 1.014 (1.009–1.027) | 1.014 (1.003–1.029) | 1.013 (1.012–1.021) | 1.012 (1.008–1.017) | 1.017b (1.014–1.021) |
| UPC | 0.3 (0.2–1.0) | 0.4 (0.3–1.0) | 4.3 (2.0–8.0) | 21.3 (13.6–41.0) | 23.7 (20.6–60.0) | 25.2b (17.6–29.8) |
| Weight (kg) | 4.8 (3.2–5.1) | 10.4 (5.8–17.4) | 16.4 (11.9–21.4) | 19.3 (17.0–25.1) | 19.9 (16.8–24.2) | 15.8a (14.9–20.8) |
| BCS | 2.5 (2.5–3) | 2.75 (2.5–3.5) | 3.25 (2.5–3.5) | 3 (2–3.5) | 2.25a (2–3) | 1.5a (1–1.5) |
| Unaffected* | N = 4 | N = 4 | N = 4 | N = 4 | N = 4 | N = 4 or 3c |
|---|---|---|---|---|---|---|
| Age (weeks) | 7 (7–8) | 13 (10–17) | 19 (14–29) | 24.5 (21–39) | 32.5 (23–43) | 37 (26–49) |
| sCr (mg/dL) | 0.40 (0.32–0.43) | 0.45 (0.36–0.62) | 0.65 (0.45–0.78) | 0.78 (0.58–0.80) | 0.85 (0.65–0.98) | 0.92 (0.69–1.05) |
| BUN (mg/dL) | 5 (3–8) | 4 (3–11) | 7.5 (7–9) | 9.5 (8–14) | 12 (10–13) | 14 (11–15) |
| SDMA (μg/dL) | 12.5 (10–14) | 11.5 (11–15) | 12 (11–15) | 11 (10–12) | 11 (11–14) | 11c (11–11) |
| GFR (mL/min/kg) | 4.96 (4.52–5.32) | 4.80 (3.10–5.39) | 3.64 (2.99–4.41) | 2.80 (2.57–3.73) | 2.45 (2.26–2.67) | 2.36 (2.12–2.41) |
| USG | 1.010 (1.004–1.014) | 1.017 (1.012–1.023) | 1.011 (1.008–1.026) | 1.023 (1.010–1.035) | 1.022 (1.010–1.038) | 1.029 (1.017–1.036) |
| UPC | 0.6 (0.3–0.8) | 0.2 (0.1–0.4) | 0.2 (0.0–0.3) | 0.1 (0.0–0.2) | 0.1 (0.0–0.1) | 0.1 (0.0–0.2) |
| Weight (kg) | 4.5 (3.9–5.8) | 9.3 (6.2–13.6) | 15.6 (11.9–18.0) | 21.2 (17.0–23.4) | 23.8 (21.1–25.8) | 24.4 (23.5–27.5) |
| BCS | 2.75 (2–3) | 2.75 (2.5–3.5) | 3 (2.5–3.5) | 3.25 (3–4) | 3.5 (3–3.5) | 3.5 (3–4) |
sCr, serum creatinine; BUN, blood urea nitrogen; SDMA, symmetric dimethylarginine; GFR, glomerular filtration rate; USG, urine specific gravity; UPC, urine protein creatinine ratio; BCS, body condition score.
*Results used in unaffected dogs correspond with initial onset of each milestone in an affected sibling.
aN = 6 dogs; bN = 5 dogs; cN = 3 dogs.
In affected dogs, sCr and SDMA increased whereas GFR decreased throughout disease progression, except in the dog euthanized before milestone 4, in which sCr and SDMA abruptly increased over the course of 1 week (1.2 to 2.2 mg/dL and 21 to 35 μg/dL, respectively). However, both results decreased before death (sCr = 1.7 mg/dL; SDMA = 33 μg/dL). Although this dog had extreme muscle wasting, which could partially explain a decrease in sCr, acute on chronic renal failure with subsequent partial recovery of GFR was suspected.
In unaffected dogs, there was a steady physiologic increase in sCr (medians, 0.4 to 0.9 mg/dL) and decrease in GFR (medians, 4.96 to 2.36 mL/min/kg) as dogs matured (from 7 weeks up to 49 weeks old; Table 1). In 3 dogs, there was no notable increase or decrease in SDMA, and results typically fluctuated between 10–13 μg/dL (mean, 12; range, 9–16 μg/dL). However, in the other unaffected dog, SDMA significantly decreased with maturity (2.5 μg/dL in a 20‐week period; P = .02).
The standard deviation of SDMA fluctuated between 0.8–1.2 μg/dL (mean, 1.0; range, 0.6–1.7 μg/dL) for all dogs ≤ 20 weeks old, with no significant difference between affected and unaffected dogs. There also was no difference between unaffected dogs ≤20 versus >20 weeks old. Conversely, SDMA in affected dogs older than 20 weeks (SDMA range, 11–95 μg/dL) increased significantly in standard deviation from the expected value (mean, 4.2; range, 3.4–7.5 μg/dL).
Correlation of sCr and SDMA with GFR
In affected dogs, both sCr and SDMA correlated strongly with GFR (r = −0.98 and −0.95, respectively) and each other (Fig. 1A, C, and E, Table 2). In unaffected dogs, sCr demonstrated strong correlations with GFR, age, and weight and a moderately strong correlation with BCS (Fig. 1B, Table 2). In contrast, SDMA was not significantly correlated with any of these variables or with sCr in unaffected dogs (Fig. 1D and F, Table 2).
Figure 1.
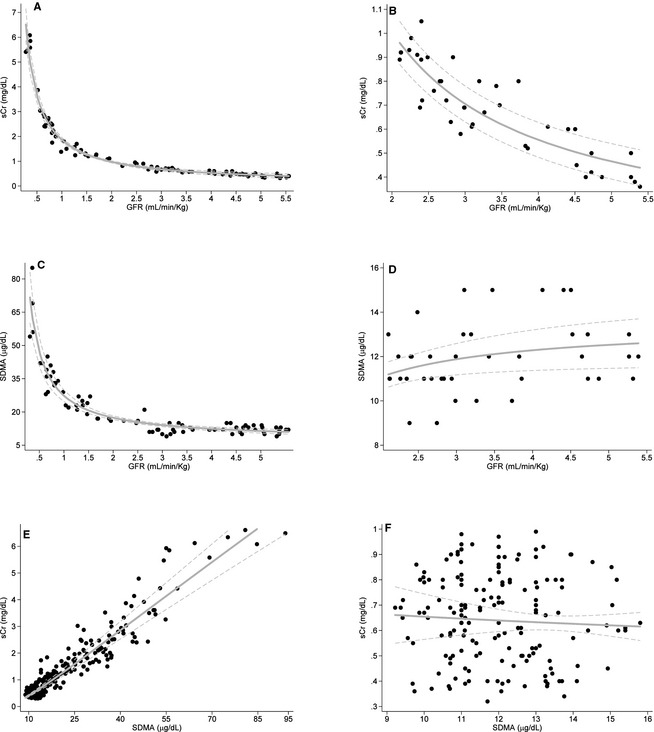
Correlations of serum creatinine (sCr), SDMA and GFR in dogs affected with X‐linked hereditary nephropathy (n = 8; graphs A, C, and E) and unaffected littermates (n = 4; graphs B, D, and F).
Table 2.
Correlations of clinical variables with serum creatinine, GFR, and SDMA (estimate [95% confidence interval]), for dogs affected with X‐linked hereditary nephropathy (n = 8) and unaffected (n = 4) littermates
| Serum creatinine | GFR | SDMA | ||||
|---|---|---|---|---|---|---|
| Affected | Unaffected | Affected | Unaffected | Affected | Unaffected | |
| Age |
0.89 (0.74,1) N = 340 |
0.92 (0.72,1) N = 174 |
−0.88 (−1, −0.62) N = 84 |
−0.86 (−1, −0.63) N = 41 |
0.73 (0.55,0.90) N = 333 |
−0.23 (−0.55,0.08) N = 166 |
| Weight |
0.37 (0.24,0.50) N = 333 |
0.90 (0.65,1) N = 173 |
−0.76 (−0.96, −0.55) N = 84 |
−0.94 (−1, −0.68) N = 41 |
0.32 (0.20,0.44) N = 328 |
−0.21 (−0.56,0.13) N = 166 |
| BCS |
−0.67 (−0.99, −0.35) N = 157 |
0.67 (0.31,1) N = 79 |
0.40 (0.10,0.70) N = 82 |
−0.71 (−1, −0.25) N = 41 |
−0.68 (−0.95, −0.41) N = 157 |
0.14 (−0.32,0.60) N = 76 |
| GFR |
−0.98 (−1, −0.80) N = 84 |
−0.87 (−1, −0.68) N = 41 |
– | – | – | – |
| SDMA |
0.95 (0.87,1) N = 329 |
−0.06 (−0.37,0.25) N = 166 |
−0.95 (−1, −0.72) N = 83 |
0.34 (0.02,0.65) N = 40 |
– | – |
GFR, glomerular filtration rate; SDMA, symmetric dimethylarginine; BCS, body condition score.
Comparison of sCr and SDMA for Identifying Initial Decrease in Renal Function
Cutoff Values
The GFR cutoff for decreased renal function was set at <2 mL/min/kg, and the sCr cutoff for azotemia was set at ≥1.2 mg/dL. Using the average GFR of unaffected littermates at the age corresponding to timepoints at which affected littermates demonstrated GFR <2 mL/min/kg, a GFR = 2 mL/min/kg indicated a mean 30% (range, 15–47%) decrease in GFR. The sCr cutoff was based on historical observations that healthy unaffected dogs in this colony rarely have sCr > 1.1 mg/dL, even as adults. The SDMA cutoff was set at ≥14 μg/dL, based on an established reference interval in adult dogs11 and concentrations observed in unaffected littermates. Because of fluctuations observed in young affected and unaffected dogs, an increase in SDMA was only considered indicative of decreased renal function when all subsequent results were ≥14 μg/dL. No unaffected dogs had sCr ≥ 1.2 mg/dL or GFR < 2 mL/min/kg at any time point.
Using these cutoff values, SDMA increased an average of 4.1 weeks earlier than the measured decrease in GFR and 4.8 weeks earlier than sCr (Fig. 2). SCr increased and GFR decreased at the same age for all but 2 dogs, in which sCr increased above 1.2 mg/dL 2–3 weeks after GFR had decreased <2 mL/min/kg (Fig. 2). Notably, a GFR < 2 mL/min/kg detected a 45% (range, 18–68%) decrease in GFR compared with unaffected littermates based on intermittent GFR measurements and a 34% (range, 18–52%) decrease when based on week‐to‐week weighted average GFRs. The latter method detected the decrease an average of 1 week earlier. The sCr cutoff detected a 48% (range, 39–68%) decrease in GFR whereas the SDMA cutoff detected an 8% (range, −6–24%) decrease compared with unaffected littermates. SDMA was frequently ≥14 μg/dL in unaffected littermates, exceeding the cutoff 8 times between 13 and 33 weeks of age in 1 dog (range, 11–15 μg/dL). Because of this result, calculations also were performed using an SDMA cutoff ≥16 μg/dL, which identified decreased renal function 2.75 weeks earlier than GFR and 3.4 weeks earlier than sCr, corresponding to an average 16% (range, −6–35%) decrease in GFR compared with unaffected littermates.
Figure 2.
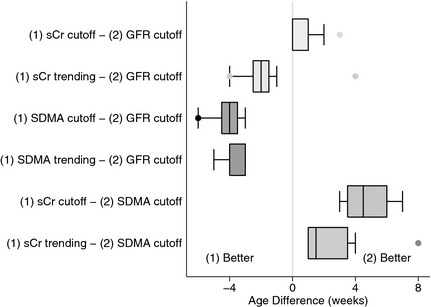
Difference in weeks between comparisons of various methods for the analysis of serum creatinine (sCr), SDMA, and GFR for detecting initial decline in renal function in dogs affected with X‐linked hereditary nephropathy (n = 8). Age difference was calculated by subtracting the age at which a decrease in renal function was identified by method (2) from that identified by method (1). “(1) Better” indicates that method (1) detected a decline in renal function earlier than method (2); “(2) Better” indicates that method (2) detected this decline earlier than method (1). sCr cutoff: sCr ≥ 1.2 mg/dL; GFR cutoff: GFR <2 mL/min/kg; SDMA cutoff: SDMA≥14 μg/dL; sCr and SDMA trending refer to detection of a clinically relevant difference in the rate of change from prior values in an individual dog.
Trending – Clinically Relevant Difference in Rate of Change From Previous Weekly Values
When trending values in an individual dog over time (i.e., to determine whether or not a new result is higher compared with 4 previous weekly results), sCr increased earlier than when using the 1.2 mg/dL cutoff in all but 1 dog (average, 2.1 weeks earlier). In contrast, SDMA increased at the same time (n = 5) or 1–3 weeks later (n = 3) when trending was compared with SDMA ≥ 14 μg/dL. Trending of sCr identified an increase earlier than GFR < 2 mL/min/kg in all but 1 dog (average, 1.5 weeks earlier), whereas trending of SDMA identified an increase earlier than GFR in all dogs (average, 3.5 weeks earlier; Fig. 2). Overall, increases were observed earlier when trending SDMA as compared with trending sCr (average, 2 weeks earlier), and the decrease in GFR detected was 14% (range, −6–26%) for SDMA vs. 27% (range, 5–49%) for sCr compared with corresponding unaffected littermate GFRs. Trending of GFR in an individual dog based on intermittent measurements failed to reliably identify a clinically relevant decrease in GFR.
Comparison With Unaffected Littermates
When comparing affected dogs with unaffected littermates to determine the point at which a new result in affected dogs deviated from the current average in the 4 unaffected dogs, sCr and SDMA increased within 1 week of each other in all but 1 dog, in which SDMA increased 3 weeks earlier than sCr. Comparison with unaffected littermates was similar to trending for both sCr and SDMA (mean, 0.6 weeks earlier and 0.9 weeks later than trending, respectively). Comparison with unaffected littermates also detected an increase in both sCr and SDMA before GFR < 2 mL/min/kg by an average of 2.1 and 2.6 weeks earlier, respectively. The decrease in GFR detected was 27% (range, 10–41%) for sCr and 19% (range, 5–34%) for SDMA compared with unaffected littermates. For GFR using intermittent measurements, comparing affected dogs with unaffected littermates identified a decrease at the same age as using the cutoff (<2 mL/min/kg) in all but 1 dog, in which the comparison with littermates detected a decrease 3 weeks later.
Discussion
In our study, SDMA paralleled the progression of renal disease in dogs, correlating strongly with GFR in dogs with progressive kidney disease. Furthermore, SDMA identified decreased renal function earlier than sCr and GFR. On average, sCr detected <50% loss of renal function using a reference limit generated for this population of dogs and consistently detected <50% loss if serial monitoring was performed. SDMA consistently detected <30% loss of renal function using either a general reference limit or serial monitoring. This study also showed the reliable measurement of SDMA in serum and plasma.
Our study compared several different methods for detecting decreasing renal function based on sCr, SDMA, and GFR: (1) use of a defined cutoff (i.e., reference limit); (2) trending in an individual dog over time; and (3) comparison with unaffected littermates. Our study supports that use of an appropriate reference limit increases sCr's sensitivity for detecting loss of renal function compared with the commonly cited 75% loss of function, and our findings are in line with a study demonstrating increased sCr with 50–60% loss of renal function after 75% loss of nephron mass.23 However, use of a cutoff for sCr still is an unreliable method for detecting an early decrease in kidney function, because it detected this decrease later than the other 2 methods for sCr and all methods for SDMA and GFR evaluation. In contrast, for SDMA, use of a cutoff detected decreasing renal function earlier than all other methods for sCr, SDMA, and GFR. These findings indicate a more sensitive reference limit for SDMA than conventional methods and support that SDMA could add value in early detection of renal disease, particularly if evaluating a dog for the first time without benefit of previous testing. Additional clinical studies are needed to determine if SDMA can detect <30% decrease in renal function in other kidney diseases, particularly with the less intensive monitoring performed in clinical practice.
Both trending of sCr and comparison with unaffected littermates improved its sensitivity for identifying a decrease in renal function, whereas SDMA trending and comparison with unaffected littermates slightly lowered its sensitivity compared with using SDMA ≥ 14 μg/dL. For both, trending produced similar results to littermate comparisons. This indicates that trending of sCr and SDMA can be a useful tool in the absence of healthy controls to identify early changes in renal function. Interestingly, trending of GFR often failed to detect a clinically relevant decrease in renal function (largely because of the limited number of determinations obtained) or it detected the initial physiologic decrease. Trending for both sCr and GFR was complicated in this study population by the normally observed changes in young growing dogs. Therefore, although trending of sCr or calculating GFR between measurements to obtain weekly results improved their sensitivity, our findings likely do not fully reflect the improved performance that trending of sCr or close monitoring of GFR would have in identifying decreased renal function in adult dogs.
SDMA recently has been shown to increase up to 4 years before sCr in cats with CKD.12 Our study supports an earlier increase in SDMA compared with sCr in dogs, but the much shorter time frame for early detection in our study can be attributed to the rapid progression of CKD in juvenile dogs with XLHN compared with slowly progressive CKD in cats. In addition to SDMA increasing earlier than sCr based on all methods evaluated, SDMA also increased earlier than a decrease in GFR based on iohexol clearance, and several affected dogs had GFR results comparable to unaffected littermates at the same age that SDMA first increased, even using a higher cutoff (i.e., ≥16 μg/dL). Furthermore, trending of sCr and comparison with unaffected littermates also identified a decrease in renal function earlier than GFR. These findings indicate that GFR may not be the most sensitive method for detecting decreasing renal function, particularly given the difficulty in obtaining frequent determinations.
Importantly, SDMA intermittently reached 14–15 μg/dL (rarely up to 16 μg/dL) in unaffected dogs and in young affected dogs before a decrease in renal function. Therefore, using an SDMA cutoff of ≥14 μg/dL, it was only deemed a true increase when all subsequent results were ≥14 μg/dL. Although intermittent SDMA results at and slightly above the reference limit may be more likely in juvenile dogs, given the decrease in SDMA with maturity in 1 unaffected dog, a persistent increase should be verified before concluding decreased renal function. Variability in SDMA in these dogs (1 μg/dL) was similar to that observed in healthy geriatric cats (1.54 μg/dL),12 and this variability also must be considered near the reference limit in clinical patients.
One of the major limitations of sCr is its dependence on muscle mass, which typically decreases in older animals and often is a confounding factor with CKD. This can lead to overestimation of kidney function in muscle‐wasted animals. Furthermore, it complicates trending of sCr over time in an individual animal, which, as demonstrated in this study, is otherwise a more sensitive method for detecting decreases in GFR as compared with a reference interval. Recent studies in cats and dogs found that SDMA was unaffected by lean mass.13, 17 Our study further supports this finding, given SDMA's lack of correlation with weight and BCS in unaffected dogs as compared with sCr's moderate to high correlation with these variables (Table 2). Because of the lack of association with muscle mass, SDMA helped to detect what was likely an acute on chronic event with partial recovery in 1 dog in our study. Without SDMA, the decrease in sCr observed might have been deemed secondary to muscle wasting rather than improving renal function after an acute event.
A surprising finding was that SDMA remained either unchanged or even decreased as unaffected dogs matured despite a physiological decrease in GFR. This could indicate that more SDMA is produced in juvenile dogs (e.g., if increased protein turnover is present). However, the mechanism currently remains unknown. In contrast, sCr steadily increased as unaffected dogs matured, likely both because of increased muscle mass and physiological decrease in GFR.
Lastly, our study showed that SDMA is stable in the types of clinical samples typically submitted for analysis and for longer than the typical time frame for clinical sample storage. Furthermore, multiple freeze‐thaw cycles did not significantly alter SDMA concentrations in serum and plasma. Data regarding long‐term stability of SDMA in frozen samples still is needed.
In summary, SDMA is a useful test for both identifying and monitoring decreased renal function in dogs. It adds value as an endogenous marker of GFR, which will be particularly helpful in situations when sCr evaluation might be compromised because of muscle wasting or inexperience with its interpretation in different dog breeds. Additional studies in dogs with CKD with slower disease progression are needed to determine how much earlier SDMA will identify decreasing renal function compared with sCr in a clinical setting.
Acknowledgments
The authors acknowledge the technical assistance of Mary Sanders (Texas A&M University).
Grand Support: Funding support for the study was provided by IDEXX Laboratories Inc.
Conflict of Interest Declaration: Maha Yerramilli, Edward Obare, Murthy Yerramilli, Andrei Rakitin, Jason Aguiar, and Roberta Relford are currently employed by IDEXX Laboratories, Inc. Mary Nabity and George Lees have served on an advisory board and received honoraria and travel reimbursement from IDEXX Laboratories, Inc. within the past 3 years.
Off‐label Antimicrobial Declaration: Authors declare no off‐label use of antimicrobials.
This study is a collaborative project between IDEXX Laboratories Inc., Westbrook, ME and Texas A&M University, College Station, TX. All work was performed at these two institutions.
Presented in part at the 2013 ACVIM Forum, Seattle, Washington, June 12–15, 2013 and the 2014 ACVIM Forum, Nashville, Tennessee, June 4–7, 2014.
Footnotes
EMD Millipore, Billerica, MA
Cambridge Isotope Laboratories, Tewksbury, MA
SigmaAldrich, St. Louis, MO
Stillmeadow, Inc, Sugarland, TX
Omnipaque 300, GE Healthcare Inc, Princeton, NJ
Vitros 250, Johnson & Johnson Co., Rochester, NY
Diagnostic Center for Population and Animal Health, Michigan State University, E. Lansing, MI
PhoenixTM WinNonlin® Version 6.3, Pharsight‐Certara, St. Louis, MO
SAS 9.4, SAS Institute Inc., Cary, NC
Stata 13.0 MP, Stata Corp LP, College Station, TX
Rentko V, Nabity MB, Yerramilli M, et al. Determination of serum symmetric dimethylarginine reference limit in clinically healthy dogs. J Vet Intern Med 2013; 27:750 (abstract).
References
- 1. Kakimoto Y, Akazawa S. Isolation and identification of N‐G,N‐G‐ and N‐G,N’‐G‐dimethyl‐arginine, N‐epsilon‐mono‐, di‐, and trimethyllysine, and glucosylgalactosyl‐ and galactosyl‐delta‐hydroxylysine from human urine. J Biol Chem 1970;245:5751–5758. [PubMed] [Google Scholar]
- 2. McDermott JR. Studies on the catabolism of Ng‐methylarginine, Ng, Ng‐dimethylarginine and Ng, Ng‐dimethylarginine in the rabbit. Biochem J 1976;154:179–184. [DOI] [PMC free article] [PubMed] [Google Scholar]
- 3. Schwedhelm E, Böger RH. The role of asymmetric and symmetric dimethylarginines in renal disease. Nat Rev Nephrol 2011;7:275–285. [DOI] [PubMed] [Google Scholar]
- 4. Kielstein JT, Salpeter SR, Bode‐Boeger SM, et al. Symmetric dimethylarginine (SDMA) as endogenous marker of renal function–a meta‐analysis. Nephrol Dial Transplant 2006;21:2446–2451. [DOI] [PubMed] [Google Scholar]
- 5. Marliss EB, Chevalier S, Gougeon R, et al. Elevations of plasma methylarginines in obesity and ageing are related to insulin sensitivity and rates of protein turnover. Diabetologia 2006;49:351–359. [DOI] [PubMed] [Google Scholar]
- 6. Atzler D, Schwedhelm E, Nauck M, et al. Serum reference intervals of homoarginine, ADMA, and SDMA in the Study of Health in Pomerania. Clin Chem Lab Med 2014;52:1835–1842. [DOI] [PubMed] [Google Scholar]
- 7. Siroen MP, van der Sijp JR, Teerlink T, et al. The human liver clears both asymmetric and symmetric dimethylarginine. Hepatology 2005;41:559–565. [DOI] [PubMed] [Google Scholar]
- 8. Schwedhelm E, Wallaschofski H, Atzler D, et al. Incidence of all‐cause and cardiovascular mortality predicted by symmetric dimethylarginine in the population‐based study of health in pomerania. PLoS ONE 2014;9:e96875. [DOI] [PMC free article] [PubMed] [Google Scholar]
- 9. Schepers E, Barreto DV, Liabeuf S, et al. Symmetric dimethylarginine as a proinflammatory agent in chronic kidney disease. Clin J Am Soc Nephrol 2011;6:2374–2383. [DOI] [PMC free article] [PubMed] [Google Scholar]
- 10. Veldink H, Faulhaber‐Walter R, Park JK, et al. Effects of chronic SDMA infusion on glomerular filtration rate, blood pressure, myocardial function and renal histology in C57BL6/J mice. Nephrol Dial Transplant 2013;28:1434–1439. [DOI] [PubMed] [Google Scholar]
- 11. Braff J, Obare E, Yerramilli M, et al. Relationship between serum symmetric dimethylarginine concentration and glomerular filtration rate in cats. J Vet Intern Med 2014;28:1699–1701. [DOI] [PMC free article] [PubMed] [Google Scholar]
- 12. Hall JA, Yerramilli M, Obare E, et al. Comparison of serum concentrations of symmetric dimethylarginine and creatinine as kidney function biomarkers in cats with chronic kidney disease. J Vet Intern Med 2014;28:1676–1683. [DOI] [PMC free article] [PubMed] [Google Scholar]
- 13. Hall JA, Yerramilli M, Obare E, et al. Comparison of serum concentrations of symmetric dimethylarginine and creatinine as kidney function biomarkers in healthy geriatric cats fed reduced protein foods enriched with fish oil, L‐carnitine, and medium‐chain triglycerides. Vet J 2014;202:588–596. [DOI] [PubMed] [Google Scholar]
- 14. Tatematsu S, Wakino S, Kanda T, et al. Role of nitric oxide‐producing and ‐degrading pathways in coronary endothelial dysfunction in chronic kidney disease. J Am Soc Nephrol 2007;18:741–749. [DOI] [PubMed] [Google Scholar]
- 15. Pedersen LG, Tarnow I, Olsen LH, et al. Body size, but neither age nor asymptomatic mitral regurgitation, influences plasma concentrations of dimethylarginines in dogs. Res Vet Sci 2006;80:336–342. [DOI] [PubMed] [Google Scholar]
- 16. Moesgaard SG, Holte AV, Mogensen T, et al. Effects of breed, gender, exercise and white‐coat effect on markers of endothelial function in dogs. Res Vet Sci 2007;82:409–415. [DOI] [PubMed] [Google Scholar]
- 17. Hall JA, Yerramilli M, Obare E, et al. Relationship between lean body mass and serum renal biomarkers in healthy dogs. J Vet Intern Med 2015;doi:10.1111/jvim.12607 (Epub ahead of print) [DOI] [PMC free article] [PubMed] [Google Scholar]
- 18. Cox ML, Lees GE, Kashtan CE, Murphy KE. Genetic cause of X‐linked Alport syndrome in a family of domestic dogs. Mamm Genome 2003;14:396–403. [DOI] [PubMed] [Google Scholar]
- 19. Lees GE, Helman G, Kashtan CE, et al. New form of X‐ linked dominant hereditary nephritis in dogs. Am J Vet Res 1999;60:373–383. [PubMed] [Google Scholar]
- 20. Braselton WE, Stuart KJ, Kruger JM. Measurement of serum iohexol by determination of iodine with inductively coupled plasma‐atomic emission spectroscopy. Clin Chem 1997;43:1429–1435. [PubMed] [Google Scholar]
- 21. Wellek S. Testing Statistical Hypotheses of Equivalence and Noninferiority, 2nd ed Boca Raton, FL: Chapman & Hall/CRC; 2010. [Google Scholar]
- 22. Nabity MB, Lees GE, Cianciolo R, et al. Urinary biomarkers of renal disease in dogs with X‐linked hereditary nephropathy. J Vet Intern Med 2012;26:282–293. [DOI] [PubMed] [Google Scholar]
- 23. Brown SA, Finco DR, Crowell WA, et al. Single‐nephron adaptations to partial renal ablation in the dog. Am J Physiol 1990;258:F495–F503. [DOI] [PubMed] [Google Scholar]