

Abstract
Background
Symmetric dimethylarginine (SDMA) is an accurate and precise biomarker for estimating glomerular filtration rate (GFR) in humans and cats. Serum creatinine (sCr) also correlates with GFR, but has limitations as a biomarker of renal function because nonrenal factors can influence its concentration.
Hypothesis
Differences in lean body mass (LBM) influence sCr, but not serum SDMA concentrations.
Animals
Forty‐one healthy Beagles, mean age 9.9 years (range: 3.1–14.8 years), were studied over a 6 month period.
Methods
Serum biomarkers of renal function were measured prospectively at baseline, and 1, 3, and 6 months. SDMA concentrations were measured by liquid chromatography‐mass spectroscopy and sCr concentrations by enzymatic colorimetry. Body composition was determined by dual energy x‐ray absorptiometry.
Results
LBM (P < .001) and age (P = .006) were significant explanatory variables for sCr concentration (R 2 = 0.38), but not SDMA concentration. Time on food was the only significant explanatory variable for SDMA concentration (R 2 = 0.49). SDMA concentrations decreased across time (P < .001). LBM was affected by sex (males > females; P = .02). Mature adult dogs (<8 years) had greater LBM compared with geriatric dogs (≥8 years; P < .001).
Conclusion and Clinical Importance
sCr concentrations, but not SDMA concentrations, are influenced by LBM, which limits sCr utility as a biomarker for monitoring renal function in dogs with decreased LBM. Reductions in LBM can lower sCr concentration and overestimate GFR. SDMA concentrations, but not sCr concentrations were influenced by time on food. SDMA could have clinical advantages over sCr in monitoring response to nutritional interventions.
Keywords: Canine, Creatinine, Symmetric dimethylarginine, Urea nitrogen
Abbreviations
- ADMA
asymmetric dimethylarginine
- CKD
chronic kidney disease
- GFR
glomerular filtration rate
- HPLC
high performance liquid chromatography
- HRS
hepatorenal syndrome
- IRIS
International Renal Interest Society
- LC‐MS
liquid chromatography‐mass spectroscopy
- NOS
nitric oxide synthase
- sCr
serum creatinine
- SDMA
symmetric dimethylarginine
- SUN
serum urea nitrogen
Early indicators of kidney damage include a reduction in glomerular filtration rate (GFR) and impaired urine concentrating ability. Later indicators include azotemia, with increased serum creatinine (sCr) and serum urea nitrogen (SUN) concentrations. Dogs with chronic kidney disease (CKD) are staged according to guidelines developed by the International Renal Interest Society (IRIS) and accepted by the American and European Societies of Veterinary Nephrology and Urology. The four tier IRIS CKD staging system is based on sCr concentration, the magnitude of proteinuria as measured by the urine protein:creatinine ratio, and blood pressure.1
Renal function in dogs with CKD should be regularly monitored. Determination of GFR is a valuable tool for estimating renal function and staging kidney disease.2 Measuring iohexol plasma clearance appears to be the simplest and most accurate method for determining GFR in clinical practice. Yet measuring GFR is technically cumbersome and expensive, such that sCr remains the standard surrogate for GFR. However, sCr has limitations as a marker of kidney function, most notably insensitivity because it remains in the reference interval for healthy dogs until GFR is reduced approximately 75%.3 In addition, other nonrenal factors can influence sCr, including endogenous production by muscle such that age, breed, and body weight can influence sCr concentration.4 Although serial evaluations of sCr within the same dog increase its sensitivity for detecting progressive changes in GFR, there is a need for better biomarkers for monitoring CKD. Symmetric dimethylarginine (SDMA) correlates with GFR, and increases before sCr in cats with CKD (mean 17.0 months; range: 1.5–48 months).5
Symmetric dimethylarginine is an accurate and precise biomarker for calculating estimated GFR in humans with coronary artery disease,6 as well as a more sensitive biomarker than sCr for assessing renal dysfunction in humans.1 , 2 A meta‐analysis of 18 studies involving human patients showed that 1/SDMA concentrations correlated closely with inulin clearance (r = 0.85), and SDMA concentrations correlated closely with sCr concentrations (r = 0.75).7 In another study with human subjects, plasma SDMA concentrations correlated with both GFR (measured by an iodothalamate clearance technique; r = −0.84, P < .01) and sCr (r = 0.89, P < .01).8
Methylated arginine is a byproduct of protein methylation. There are three main species of methylated arginine: monomethylarginine, asymmetric dimethylarginine (ADMA), and SDMA.9 Subsequent protein degradation of methylated proteins yields individual methylated arginine amino acids. Although, ADMA is metabolized enzymatically by dimethylarginine dimethylaminohydrolase, SDMA is excreted primarily (≥90%) by renal clearance in humans.10, 11 In dogs, SDMA excretion has not been documented. Because SDMA is eliminated by the kidneys, serum concentrations are affected by changes in GFR. Prolonged oral supplementation with l‐arginine does not influence serum concentrations of SDMA12 because serum SDMA derives predominantly from methylated nuclear proteins.9
Feeding healthy dog foods containing reduced protein and phosphorus content and enhanced with fish oil, medium‐chain triglycerides, and l‐carnitine counterbalances changes in these serum biochemistries as dogs age.13 Among dog groups, there was no change in lean body weight or biomarkers of protein adequacy (serum total protein and serum albumin concentrations), based on time on food or dietary treatment.13 The purpose of this study was to determine if lean body mass influenced renal function biomarkers, including SDMA, sCr, and SUN concentrations.
Materials and Methods
Dogs and Ethics Statement
The study protocol was reviewed and approved by the Institutional Animal Care and Use Committee, Hill's Pet Nutrition, Inc., Topeka, KS, USA (Permit Number: 09‐487). All dogs were considered healthy, with no evidence of chronic systemic disease on the basis of results of physical examination, complete blood count determination, serum biochemical analyses, urinalysis, and fecal examination for parasites. Dogs were housed in pairs in indoor runs or in groups in spacious rooms with natural light that varied with seasonal changes. All dogs were exercised daily, and were provided with regular opportunities for socialization and environmental enrichment.
Forty‐one healthy Beagles with mean age of 9.9 years (range: 3.1–14.8 years) were included in this study. Equal numbers of females (n = 22; ovariohysterectomized) and males (n = 19; neutered) were randomized to 3 study groups. Mean initial body weight was 12.4 kg (range: 8.7–17.9 kg). Exclusion criteria included the inability to eat dry food and/or any diagnosed disease condition. The criterion for removal from the study was development of any condition whereby removal would benefit the animal. Three animals were removed during the study for unrelated reasons: bladder carcinoma, surgery for intervertebral disc disease, and foot abscess with fever. Thirty‐eight animals remained healthy and completed the study.
To evaluate the influence of age, age categories were defined as <8 (mature adults), or ≥8 years (geriatric adults) at the beginning of the study. This resulted in reasonably balanced groups at the end of the study with 18 animals in the mature adult group and 20 animals in the geriatric adult group.
Study Design and Measurements
The study design was a 3‐treatment study, whereby dogs were fed either control food or one of two test foods for 6 months.13 In brief, 3 test foods were prepared by Hill's Pet Nutrition, Inc.: a control food3 and two foods with added l‐carnitine but different concentrations of fatty acids. Both experimental foods were control base food with added l‐carnitine (300 mg/kg as fed) and fish oil (0.6 or 1.5% as fed). The test food with 1.5% added fish oil also had added medium‐chain triglycerides from coconut oil. This reduced the proportion of animal fat in the formulation. The reduced animal fat was replaced with plant oils (2% coconut oil and 7% corn oil). All foods contained similar concentrations of protein (approx. 14.0%, as fed), fat (approx. 18.1%, as fed), calcium, phosphorus, and sodium, and were isocaloric. All dogs had access to electronic feeders where fresh food was offered daily with amounts calculated to maintain body weight; water was available ad libitum.
Serum concentrations of carnitine metabolites are lower in geriatric (≥8 years) versus mature adult (<8 years) dogs, and supplementation with l‐carnitine attenuates the effects of aging.13 The ratio of polyunsaturated to saturated fatty acids is greater in mature dogs at baseline. Adding 1.5% fish oil plus medium‐chain triglycerides to the food increases the ratio of polyunsaturated to saturated fatty acids in dogs, with the net effect that dogs look more like younger dogs. Serum concentration of polyunsaturated fatty acids from fish oil, including eicosapentaenoic acid and docosahexaenoic acid, increase in a dose‐dependent manner. Dogs consuming 1.5% fish oil plus medium‐chain triglycerides have increased concentrations of lauric and myristic fatty acids, and decreased concentrations of saturated, monounsaturated, and arachidonic fatty acids and their polyunsaturated to saturated fatty acids ratio increases. Thus, adding dietary l‐carnitine, fish oil, and medium‐chain triglycerides counterbalances the effects of aging on circulating concentrations of these compounds.13
For each dog, data were collected initially and again after consuming foods for 1, 3, and 6 months. Blood was collected to measure serum biochemistries, serum fatty acid concentrations, and serum metabolomic profiles. These results were previously reported.13 In addition, blood was collected to measure serum biomarkers of renal function (SDMA, sCr, and SUN concentrations) at baseline, and 1, 3, and 6 months. The sCr and SUN concentrations were determined immediately from freshly isolated serum by enzymatic colorimetry.4 Reference ranges for sCr (0.42–1.03 mg/dL) and SUN (7.1–25.6 mg/dL) in adult dogs were previously established by the in‐house laboratory.5
SDMA concentrations were determined from banked serum frozen at −70°C, using liquid chromatography‐mass spectroscopy (LC‐MS). In brief, 50 μL of serum from dogs, or 50 μL of standard, were transferred to centrifuge tubes and diluted with 50 μL of internal standard solution6 in water. Next, 300 μL of high performance liquid chromatography (HPLC)‐grade acetonitrile7 was added to extract the SDMA. The samples were centrifuged and the supernatant was decanted and tested by LC‐MS for SDMA concentration.
The LC‐MS procedure was performed using an API 4000 coupled with Shimadzu Nexera HPLC system.8 Ten μL of serum extract was injected into the HPLC equipped with a C18 column9 (5 μm, 4.6 × 30 mm). The SDMA was eluted using 0.1% formic acid7 and 0.5 mM perfloroheptanoic acid10 in water (Mobile Phase A) and acetonitrile with 0.1% formic acid (Mobile Phase B) with a flow rate of 1 mL/min and column temperature of 25°C. Under these conditions the retention times for SDMA and internal standard D‐7‐ADMA are both 1.72 min. The effluent of HPLC was directed to the electrospray ionization (ESI) source of the mass spectrometer, which produced single charged adduct ions [M+H]+. The [M+H]+ ions of SDMA and D‐7‐ADMA were analyzed in the multiple reaction monitoring (MRM) mode of the mass spectrometer. Fragmentation was accomplished using collision energy of 20 volts. The observed MRM transitions for SDMA and D‐7‐ADMA were 203.1 to 172.1 and 210.2 to 46.1 m/z respectively.
A standard curve for SDMA quantitation was prepared using calibrator solutions. First, a solution of SDMA stock standard was prepared (1 mg/mL) in water. The stock standard was diluted 50‐fold in water to obtain working standard solutions (20 μg/mL). Next, 100 μL of working standard was spiked into 1,900 μL of charcoal stripped canine serum to obtain 100 μg/dL SDMA. Serial dilutions of SDMA were similarly prepared in charcoal stripped canine serum ranging from 100 to 1.56 μg/dL of SDMA. The calibrator samples were analyzed using the same protocol described for samples. The standard curve, prepared following the LC‐MS protocol for SDMA detection, was linear with a correlation coefficient greater than 0.999.
The intra‐assay (n = 5) and interassay (n = 25) CVs for SDMA concentrations were 2.2 and 2.5% respectively. The reference interval for SDMA in healthy dogs was <14 μg/dL.11
Changes in body mass and composition were assessed by dual‐energy x‐ray absorptiometry12 scan analysis after consuming foods for 1, 3, and 6 months. Data were analyzed by the software supplied by the manufacturer. Total‐, fat‐, and lean‐body mass were previously reported.13
Statistical Analyses
Statistical analyses were performed using Statistical Analysis Software.13 A multiple linear regression analyses was performed for each response variable (SDMA, sCr, and SUN concentrations) to evaluate the effect of various explanatory variables (sex, formula, time on food, age, and lean body mass) as well as their interactions (formula*time on food, sex*lean body mass). Because a strong correlation might conceal the influence of other explanatory variables, the following individual variables were tested separately: the relationships between lean body mass and sCr concentration, age and sCr concentration, lean body mass and SDMA concentration, lean body mass and sex, lean body mass and age, and between serum biomarker concentrations. Data from baseline, 1, 3, and 6 months were averaged for each individual animal. Pearson's correlation coefficients were determined using PROC GLM for individual variables. To evaluate the influence of age on lean body mass, mature adult and geriatric dog group means were compared by t‐test. Results are given as mean ± SD unless otherwise indicated. Statistical significance was declared at P ≤ .05.
Results
Serum creatinine (0.65 ± 0.14 mg/dL) was positively correlated with lean body mass (8.14 ± 1.91 kg; r = 0.54; P = .0003; Fig 1), and sCr concentration was lower in older dogs (9.9 ± 2.5 years; r = −0.34; P = .03; Fig 2). The multiple linear regression model also showed that lean body mass (P < .001) and age (P = .006) were significant explanatory variables for sCr concentration (R 2 = 0.38; Table 1). There was no effect of sex (females 0.65 ± 0.13 mg/dL; males 0.65 ± 0.16 mg/dL), formula, time on test, formula*time on test, or sex*lean body mass on sCr concentration.
Figure 1.
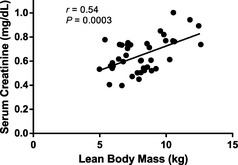
Relationship between lean body mass and sCr concentration in healthy dogs (9.9 ± 2.5 years; mean age ± SD). Serum creatinine was positively correlated with lean body mass (r = 0.54; P = .0003).
Figure 2.
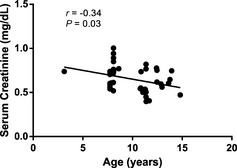
Relationship between age (9.9 ± 2.5 years; mean age ± SD) and sCr concentration in healthy dogs. Serum creatinine was negatively correlated with age (r = −0.34; P = .03).
Table 1.
P‐values after multiple linear regression for the influence of various explanatory variables on three different response variables
| Explanatory variables (type) | Response variables | ||
|---|---|---|---|
| SDMA | sCr | SUN | |
| Sex (binary variable) | NS | NS | NS |
| Formula (three class variables) | NS | NS | NS |
| Time on test (four class variables) | <0.001a | 0.066b | <0.001a |
| Age (continuous variable) | NS | 0.006a | NS |
| Lean body mass (continuous variable) | NS | <0.001b | 0.016b |
| Formula * time on test | NS | NS | NS |
| Sex * lean body mass | NS | NS | NS |
| R 2 (reduced model) | 0.49 | 0.38 | 0.25 |
The coefficients of determination (R 2) are listed in the last row.
SDMA, symmetric dimethylarginine; sCr, serum creatinine; SUN, serum urea nitrogen; NS, not significant.
Inverse association.
Direct association.
The correlation between serum SDMA concentration (10.2 ± 1.86 μg/dL) and lean body mass was not significant (P = .45; Fig 3). The multiple linear regression model showed that time on test was the only significant explanatory variable for SDMA concentration (R 2 = 0.49; Table 1) in that SDMA concentration decreased with time on test (P < .001). Mean ± SD SDMA concentrations at baseline were 13.3x ± 5.2, at 1 month 12.6x ± 2.7, at 3 months 8.1y ± 2.1, and at 6 months 6.5z ± 1.7 μg/dL. (x,y,z Means with different superscripts are different; P < .05.) There was no effect of sex (females 10.43 ± 2.13 μg/dL; males 9.95 ± 1.51 μg/dL), formula, age, lean body mass, formula*time on test, or sex*lean body mass on serum SDMA concentration.
Figure 3.
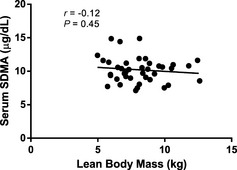
Relationship between lean body mass and SDMA concentration in healthy dogs (9.9 ± 2.5 years; mean age ± SD). Symmetric dimethylarginine is not correlated with lean body mass (P = .45).
The multiple linear regression model showed that variation in SUN concentration (9.0 ± 1.67 mg/dL) was explained by time on test (P < .001) and lean body mass (P = .016; R 2 = 0.25; Table 1). The effect of time on test on SUN concentration was previously reported.13 There was no effect of sex (females 9.32 ± 1.68 mg/dL; males 8.54 ± 1.60 mg/dL), formula, age, formula*time on test, or sex*lean body mass on SUN concentration.
Serum creatinine concentration was correlated with SDMA (r = 0.32; P = .04) and SUN (r = 0.52; P = .0005) concentrations. Serum SDMA concentration was also correlated with SUN (r = 0.38; P = .01) concentration.
The study was designed to maintain lean body mass. Among dog groups, there was no change in lean body mass based on time or dietary treatment.13 Lean body mass was significantly affected by sex (females 7.52 ± 1.64 kg; males 8.86 ± 1.99 kg; P = .02). Mature adult dogs had significantly greater lean body mass (8.82 ± 2.29 kg, mean ± SD) compared with geriatric adult dogs (7.55 ± 1.52 kg; P < .001). However, the simple correlation between lean body mass and animal age was not statistically significant (r = −0.25; P = .12).
Discussion
In a prospective study, we were able to show that serum SDMA is a better renal biomarker than sCr because it is less affected by extrarenal factors. Both sCr and SUN concentrations, but not SDMA concentrations, were positively correlated with lean body mass (Fig 4). Lean body mass was significantly affected by age and sex, with older dogs and females having significantly less lean body mass. A review of published studies shows that increased SDMA is caused by reduced renal function, and by itself does not contribute to progression of renal disease.
Figure 4.
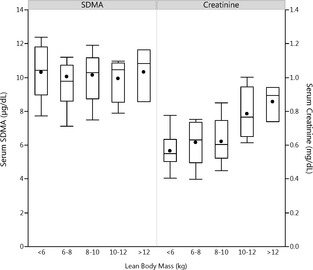
Effect of lean body mass in healthy adult dogs (9.9 ± 2.5 years; mean age ± SD) on SDMA and sCr concentrations. Shown are renal biomarker concentrations for each 2 kg weight increment in lean body mass. Each box represents the middle 50% of the data, with the median indicated by a horizontal line in the box, and the mean indicated by a filled circle in the box. The whiskers extend 1.5 times the interquartile range above and below the 75th and 25th percentiles. Only sCr concentration was correlated with lean body mass (r = 0.54; P = .0003).
Serum creatinine concentrations decreased with increasing age. Because sCr concentration is influenced by lean body mass and age, both physiologic and pathologic conditions that affect lean body mass will influence sCr concentrations. Reductions in lean body mass can lower sCr concentrations and overestimate GFR. Serum creatinine concentrations correlated significantly with lean mass in 170 healthy individuals (92 women, 78 men; r = 0.734; P = .0001).14 In dogs, lean body mass did not change in some breeds as they aged, although it increased in other breeds.15 However, different statistical analyses (log transformation of data, sex bias, and correlation analysis only), different breeds, and younger populations of animals could explain these findings. For example, in our study if we looked only at the simple correlation between lean body mass and animal age (P = .12), this did not reach statistical significance.
Serum SDMA concentrations were not correlated with lean body mass, suggesting SDMA is a better renal biomarker than sCr because it is less affected by extrarenal factors. Serum SDMA is significantly correlated with GFR in cats5, 16 and in dogs.14 In this study, SDMA concentrations were not affected by age, sex, or food formula. Others have also shown that plasma SDMA concentrations are not affected by age, sex, or breed of dog.17 In one study,18 adjusted body weight (a measure of lean body weight) was significantly associated with SDMA concentrations when sCr was excluded as an explanatory variable. However, lean body mass was not measured using the more rigorous DEXA measurements. Rather, palpation and visual inspection were used to correct body weight for the percentage of under‐ or overweight, a method noted by the authors to be a study limitation.18 Visual and palpation‐based descriptors are inaccurate compared with the more rigorous DEXA measurements for assessing lean body mass.19
Methylarginines are produced by posttranslational methylation of arginine residues in proteins. Free methylarginines are released into the cytosol following proteolysis, and then enter the plasma. ADMA is a major endogenous nitric oxide synthase (NOS) inhibitor and a competitive inhibitor of cellular l‐arginine uptake. Increased plasma ADMA concentrations are consistently associated with cardiovascular disease.20 SDMA does not inhibit NOS.20 It is speculated that SDMA might compete with arginine for cellular uptake, although this effect is only observed at very high (mM) concentrations of SDMA.21 Both ADMA and SDMA are excreted by glomerular filtration and accumulate in patients with renal failure. However, most of the ADMA is converted to l‐citrulline by dimethylarginine dimethylaminohydrolases. Because SDMA is not metabolized by this route it correlates better with renal function than ADMA.7 A meta‐analysis of 18 studies in humans shows that SDMA concentration correlates highly with the glomerular filtration rate.7
SDMA has long been regarded as an inert, functionally inactive molecule. Increased SDMA reflects reduced renal function. Not surprisingly, increased SDMA concentrations are found in human patients with multiple disorders compounded by reduced renal function. For example, investigators have looked at the association of SDMA concentrations in patients with cardiovascular risk,20, 22, 23, 24, 25 with stroke,26 during the acute inflammatory response,27 with microvascular dysfunction caused by critical illness and sepsis,28 in alcoholic liver disease,29 in hepatorenal syndrome (HRS),30 in essential hypertension,31 in type 2 diabetes with albuminuria,32 and in patients with inflammatory bowel disease.33 SDMA is increased in most patient groups compared with appropriate control groups. However, statistical associations do not imply a cause and effect relationship. Observational data do not demonstrate that increased SDMA contributes to disease progression.
Chronic SDMA infusion in otherwise healthy mice is reported to have no effect on renal function, renal histology, blood pressure, or cardiac function even though SDMA concentrations are increased an order of magnitude and comparable to those in patients with CKD.34 In theory, SDMA could interfere with renal function by inhibiting l‐arginine uptake, yet using the gold standard GFR measurement for mice (FITC‐inulin clearance) researchers could not detect even minor changes. These data strengthen the role of SDMA as a marker of renal impairment that plays no pathophysiological role in of itself.
In stroke patients,26 SDMA concentrations are significantly correlated with markers of renal function, such that the association of SDMA with outcome becomes insignificant in models including eGFR. The association of SDMA and outcome is highly related to renal function, supporting the important role of renal function in patients suffering from ischemic stroke and the evidence of SDMA being a valuable marker for renal function. It is speculated that various other potential molecular mechanisms might explain the association of SDMA and cardiovascular events beyond renal function, but these need further experimental verification.20, 22, 26 The largest clinical study to date measuring SDMA in human patients who underwent coronary angiography (N = 3,229 patients) confirms that SDMA correlates with parameters of renal function.22 In patients with cardiovascular risk, it is concluded that the SDMA mortality association reflects the association of renal function and mortality.22
In myocardial infarction patients, increased SDMA concentrations are associated with CKD and worse long‐term prognosis.25 Researchers conclude that SDMA accumulation from reduced renal clearance reflects renal dysfunction. CKD represents a potent and independent risk factor for adverse outcome. There is good correlation (R = 0.7, P < .001) between SDMA and eGFR. SDMA is a stronger predictor of cardiac events than CKD, defined according to GFR estimated by sCr, because SDMA more accurately reflects GFR than sCr, and SDMA better identifies CKD patients with a worse prognosis.25
In a human model of acute inflammatory response (patients undergoing surgical knee joint replacement), there were no significant changes in SDMA.27 The aim of the study was to examine SDMA response to inflammation free of the confounding effects of multiple organ failure, which is typically present in critical illness. Thus, elevated SDMA concentrations in sepsis and critical illness more likely reflect loss of renal function.
Hepatorenal syndrome is a major complication of end‐stage cirrhosis, and is characterized by functional renal failure. SDMA concentrations were higher in HRS patients compared with patients who had cirrhosis without renal failure. There was a positive correlation between sCr and SDMA (r 2 = 0.765, P < .001) suggesting that renal dysfunction is a main determinant of increased SDMA concentration in HRS. In patients with alcoholic cirrhosis, increased ADMA concentrations correlate strongly with disease severity, however, plasma levels of SDMA are within the reference range.35 SDMA levels do not correlate with the clinical score and remain within the reference range with normal renal function. This strongly suggests that the increased SDMA concentrations observed in HRS patients are caused by impairment of renal function. Thus, SDMA is a marker of renal dysfunction in cirrhosis. The significance of high plasma levels of SDMA in HRS, or other systemic disorders, is uncertain because there is no evidence that it inhibits NOS.
The majority of clinical studies utilize high‐performance liquid chromatography, or a competitive ELISA assay for ADMA and SDMA measurements. The gold standard of mass spectrometry, as used in our study, provides better selectivity and sensitivity for more accurate quantification of ADMA and SDMA.20
In our study, SDMA concentrations, but not sCr concentrations were influenced by time on food. SDMA concentrations decreased significantly from baseline to 3 months, and continued to decrease at 6 months on test. It is interesting to speculate that this represents a dietary effect on renal function, and that SDMA could have clinical advantages over sCr in monitoring response to nutritional interventions. Further studies are needed. It has been shown in women with preeclampsia that prolonged dietary supplementation with l‐arginine does not influence plasma SDMA concentrations even though it significantly decreases blood pressure through increased synthesis of nitric oxide, bioavailability of nitric oxide, or both.12
The correlation of serum urea nitrogen with lean body mass in this study indicates that both physiologic and pathologic conditions that affect lean body mass will influence SUN concentrations. It is also influenced by extrarenal factors (for example, exogenous and endogenous protein metabolism, hepatic function, catabolism, and nutritional adequacy) making it less specific as a marker of renal function.
In summary, a significant part of the variance for sCr concentration, but not SDMA concentration, is explained by lean body mass and age, which limits the utility of sCr as a biomarker for monitoring renal function in dogs with decreased lean body mass. Additionally, SDMA concentrations, but not sCr concentrations were influenced by time on food. Thus, SDMA could have clinical advantages over sCr in monitoring response to nutritional interventions.
Acknowledgments
This work was supported by Pet Nutrition Center, Hill's Pet Nutrition, Inc.
Conflict of Interest Declaration: Jean A. Hall has received research grant support from Hill's Pet Nutrition, Inc. in the past. Lynda D. Melendez and Dennis E. Jewell have an affiliation to the commercial funders of this research, as employees of Hill's Pet Nutrition, Inc. The work presented in this study was funded by and performed at the Pet Nutrition Center, Hill's Pet Nutrition, Inc., Topeka, KS. The funding decision makers had no role in study design, data collection and analysis, or preparation of the manuscript.
Murthy Yerramilli, Edward Obare and Maha Yerramilli have an affiliation to a commercial company, as employees of IDEXX Laboratories, Inc., that holds a patent on the ELISA methodology for measuring SDMA concentration. This does not alter adherence to Journal of Veterinary Internal Medicine policies on sharing data and materials. Data is freely available upon request.
Off‐label Antimicrobial Declaration: Authors declare no off‐label use of antimicrobials.
This work was done at Pet Nutrition Center, Hill's Pet Nutrition, Inc.
This paper was presented at 2013 ACVIM Forum in Seattle, WA.
Footnotes
Dixon JJ, Lane K, Dalton RN, et al. Symmetrical dimethylarginine is a more sensitive biomarker of renal dysfunction than creatinine. Critical Care 2013;17:P423
Payto D, El‐Khoury JM, Bunch D, et al. SDMA outperforms serum creatinine‐based equations in estimating kidney function compared with measured GFR. Clin Chem 2014;60:S26
Hill's Prescription Diet® k/d®, Hill's Pet Nutrition, Inc, Topeka, KS
Roche Diagnostics, Cobas 6000 series, c501 module, Indianapolis, IN
Pet Nutrition Center, Hill's Pet Nutrition, Inc., Topeka, KS
Calbiochem, Darmstadt, Germany
Fisher Scientific, Pittsburgh, PA
Shimadzu, Marlborough, MA
Waters XBridge, Milford, MA
Sigma‐Aldrich, St. Louis, MO
Rentko V, Nabity M, Yerramilli M, et al. Determination of serum symmetric dimethylarginine reference limit in clinically healthy dogs. J Vet Intern Med 2013;27:750
DXA‐QDR‐4500, Hologic, Inc., Waltham, MA
SAS Institute, Cary, NC, version 9.2
Yerramilli M, Yerramilli M, Obare E, et al. Symmetric demethylarginine (SDMA) increases earlier than serum creatinine in dogs with chronic kidney disease (CKD). J Vet Intern Med 2014;28:1084‐1085
References
- 1. International Renal Interest Society . IRIS 2009 Staging of CKD. Available at: http://www.iris-kidney.com. Accessed July 8, 2013.
- 2. Von Hendy‐Willson VE, Pressler BM. An overview of glomerular filtration rate testing in dogs and cats. Vet J 2011;188:156–165. [DOI] [PMC free article] [PubMed] [Google Scholar]
- 3. Finco DR, Brown SA, Vaden SL, et al. Relationship between plasma creatinine concentration and glomerular filtration rate in dogs. J Vet Pharmacol Ther 1995;18:418–421. [DOI] [PubMed] [Google Scholar]
- 4. Braun JP, Lefebvre HP. Kidney function and damage In: Kaneko JJH, Harvey JW, Bruss ML, eds. Clinical Biochemistry of Domestic Animals, 6th ed London: Elsevier; 2008:485–528. [Google Scholar]
- 5. Hall JA, Yerramilli M, Obare E, et al. Comparison of serum concentrations of symmetric dimethylarginine and creatinine as kidney function biomarkers in cats with chronic kidney disease. J Vet Intern Med 2014;28:1676–1683. [DOI] [PMC free article] [PubMed] [Google Scholar]
- 6. Bode‐Boger SM, Scalera F, Kielstein JT, et al. Symmetrical dimethylarginine: A new combined parameter for renal function and extent of coronary artery disease. J Am Soc Nephrol 2006;17:1128–1134. [DOI] [PubMed] [Google Scholar]
- 7. Kielstein JT, Salpeter SR, Bode‐Boeger SM, et al. Symmetric dimethylarginine (SDMA) as endogenous marker of renal function–a meta‐analysis. Nephrol Dial Transplant 2006;21:2446–2451. [DOI] [PubMed] [Google Scholar]
- 8. Fliser D, Kronenberg F, Kielstein JT, et al. Asymmetric dimethylarginine and progression of chronic kidney disease: The mild to moderate kidney disease study. J Am Soc Nephrol 2005;16:2456–2461. [DOI] [PubMed] [Google Scholar]
- 9. Bedford MT, Richard S. Arginine methylation an emerging regulator of protein function. Mol Cell 2005;18:263–272. [DOI] [PubMed] [Google Scholar]
- 10. Schwedhelm E, Boger RH. The role of asymmetric and symmetric dimethylarginines in renal disease. Nat Rev Nephrol 2011;7:275–285. [DOI] [PubMed] [Google Scholar]
- 11. Kielstein JT, Boger RH, Bode‐Boger SM, et al. Marked increase of asymmetric dimethylarginine in patients with incipient primary chronic renal disease. J Am Soc Nephrol 2002;13:170–176. [DOI] [PubMed] [Google Scholar]
- 12. Rytlewski K, Olszanecki R, Korbut R, et al. Effects of prolonged oral supplementation with L‐arginine on blood pressure and nitric oxide synthesis in preeclampsia. Eur J Clin Invest 2005;35:32–37. [DOI] [PubMed] [Google Scholar]
- 13. Hall JA, Jewell DE. Feeding healthy beagles medium‐chain triglycerides, fish oil, and carnitine offsets age‐related changes in serum fatty acids and carnitine metabolites. PLoS ONE 2012;7:e49510. [DOI] [PMC free article] [PubMed] [Google Scholar]
- 14. Baxmann AC, Ahmed MS, Marques NC, et al. Influence of muscle mass and physical activity on serum and urinary creatinine and serum cystatin C. Clin J Am Soc Nephrol 2008;3:348–354. [DOI] [PMC free article] [PubMed] [Google Scholar]
- 15. Speakman JR, van Acker A, Harper EJ. Age‐related changes in the metabolism and body composition of three dog breeds and their relationship to life expectancy. Aging Cell 2003;2:265–275. [DOI] [PubMed] [Google Scholar]
- 16. Hall JA, Yerramilli M, Obare E, et al. Comparison of serum concentrations of symmetric dimethylarginine and creatinine as kidney function biomarkers in healthy geriatric cats fed reduced protein foods enriched with fish oil, L‐carnitine, and medium‐chain triglycerides. Vet J 2014;202:588–596. [DOI] [PubMed] [Google Scholar]
- 17. Moesgaard SG, Holte AV, Mogensen T, et al. Effects of breed, gender, exercise and white‐coat effect on markers of endothelial function in dogs. Res Vet Sci 2007;82:409–415. [DOI] [PubMed] [Google Scholar]
- 18. Pedersen LG, Tarnow I, Olsen LH, et al. Body size, but neither age nor asymptomatic mitral regurgitation, influences plasma concentrations of dimethylarginines in dogs. Res Vet Sci 2006;80:336–342. [DOI] [PubMed] [Google Scholar]
- 19. Witzel AL, Kirk CA, Henry GA, et al. Use of a novel morphometric method and body fat index system for estimation of body composition in overweight and obese dogs. J Am Vet Med Assoc 2014;244:1279–1284. [DOI] [PubMed] [Google Scholar]
- 20. Kiechl S, Lee T, Santer P, et al. Asymmetric and symmetric dimethylarginines are of similar predictive value for cardiovascular risk in the general population. Atherosclerosis 2009;205:261–265. [DOI] [PubMed] [Google Scholar]
- 21. Closs EI, Basha FZ, Habermeier A, et al. Interference of L‐arginine analogues with L‐arginine transport mediated by the y+ carrier hCAT‐2B. Nitric Oxide 1997;1:65–73. [DOI] [PubMed] [Google Scholar]
- 22. Meinitzer A, Kielstein JT, Pilz S, et al. Symmetrical and asymmetrical dimethylarginine as predictors for mortality in patients referred for coronary angiography: The Ludwigshafen Risk and Cardiovascular Health study. Clin Chem 2011;57:112–121. [DOI] [PubMed] [Google Scholar]
- 23. Pilz S, Edelmann F, Meinitzer A, et al. Associations of methylarginines and homoarginine with diastolic dysfunction and cardiovascular risk factors in patients with preserved left ventricular ejection fraction. J Card Fail 2014;20:923–930. [DOI] [PubMed] [Google Scholar]
- 24. Dimitrow PP, Undas A, Bober M, et al. Plasma biomarkers of endothelial dysfunction in patients with hypertrophic cardiomyopathy. Pharmacol Rep 2007;59:715–720. [PubMed] [Google Scholar]
- 25. Cavalca V, Veglia F, Squellerio I, et al. Circulating levels of dimethylarginines, chronic kidney disease and long‐term clinical outcome in non‐ST‐elevation myocardial infarction. PLoS ONE 2012;7:e48499. [DOI] [PMC free article] [PubMed] [Google Scholar]
- 26. Luneburg N, von Holten RA, Topper RF, et al. Symmetric dimethylarginine is a marker of detrimental outcome in the acute phase after ischaemic stroke: Role of renal function. Clin Sci (Lond) 2012;122:105–111. [DOI] [PubMed] [Google Scholar]
- 27. Blackwell S, O'Reilly DS, Reid D, et al. Plasma dimethylarginines during the acute inflammatory response. Eur J Clin Invest 2011;41:635–641. [DOI] [PubMed] [Google Scholar]
- 28. Koch A, Weiskirchen R, Bruensing J, et al. Regulation and prognostic relevance of symmetric dimethylarginine serum concentrations in critical illness and sepsis. Mediators Inflamm 2013;2013:413826. [DOI] [PMC free article] [PubMed] [Google Scholar]
- 29. Mookerjee RP, Malaki M, Davies NA, et al. Increasing dimethylarginine levels are associated with adverse clinical outcome in severe alcoholic hepatitis. Hepatology 2007;45:62–71. [DOI] [PubMed] [Google Scholar]
- 30. Lluch P, Mauricio MD, Vila JM, et al. Accumulation of symmetric dimethylarginine in hepatorenal syndrome. Exp Biol Med (Maywood) 2006;231:70–75. [DOI] [PubMed] [Google Scholar]
- 31. Wang D, Strandgaard S, Iversen J, et al. Asymmetric dimethylarginine, oxidative stress, and vascular nitric oxide synthase in essential hypertension. Am J Physiol Regul Integr Comp Physiol 2009;296:R195–200. [DOI] [PMC free article] [PubMed] [Google Scholar]
- 32. Krzyzanowska K, Mittermayer F, Shnawa N, et al. Asymmetrical dimethylarginine is related to renal function, chronic inflammation and macroangiopathy in patients with Type 2 diabetes and albuminuria. Diabet Med 2007;24:81–86. [DOI] [PubMed] [Google Scholar]
- 33. Owczarek D, Cibor D, Mach T. Asymmetric dimethylarginine (ADMA), symmetric dimethylarginine (SDMA), arginine, and 8‐iso‐prostaglandin F2alpha (8‐iso‐PGF2alpha) level in patients with inflammatory bowel diseases. Inflamm Bowel Dis 2010;16:52–57. [DOI] [PubMed] [Google Scholar]
- 34. Veldink H, Faulhaber‐Walter R, Park JK, et al. Effects of chronic SDMA infusion on glomerular filtration rate, blood pressure, myocardial function and renal histology in C57BL6/J mice. Nephrol Dial Transplant 2013;28:1434–1439. [DOI] [PubMed] [Google Scholar]
- 35. Lluch P, Torondel B, Medina P, et al. Plasma concentrations of nitric oxide and asymmetric dimethylarginine in human alcoholic cirrhosis. J Hepatol 2004;41:55–59. [DOI] [PubMed] [Google Scholar]