

Abstract
Background
Diagnosis of familial amyloidosis (FA) in Abyssinian cats usually is made on postmortem examination.
Hypothesis/Objectives
Sequential analysis of serum SAA (sSAA), urinary SAA (uSAA), urinary protein:creatinine (UPC) ratio, or sodium‐dodecylsulfate agarose gel electrophoresis (SDS‐AGE) may facilitate early identification of cats with FA.
Animals
Twenty‐three Abyssinian cats belonging to cattery A or B (low and high prevalence of FA, respectively).
Methods
Prospective longitudinal study using 109 blood and 100 urine samples collected over 4‐year period every 4 months, if possible, or more frequently in case of illness. Cats that died during study were necropsied. Health status of live cats was checked 5 years after enrollment. Serum amyloid A (sSAA) and urinary SAA (uSAA) were measured using ELISA kit. The UPC ratio and SDS‐AGE also was performed.
Results
Familial amyloidosis was not identified in cattery A, whereas 7/14 cats from cattery B had FA. Serum amyloid A concentrations were not significantly different between cats in catteries A and B or between cats with or without FA, despite frequent peaks in cats from cattery B. Conversely, uSAA was significantly higher in cattery B, especially in the terminal phases of FA. Proteinuria occasionally was found in cats from both catteries, especially in those with FA. Urine protein electrophoresis identified mixed proteinuria only in cats with FA.
Conclusions and Clinical Importance
Serum amyloid A and UPC ratio are not helpful for early identification of Abyssinian cats with FA. Conversely, increases in uSAA with or without mixed proteinuria may be found before onset of clinical signs in cats with FA.
Keywords: Prognosis, Serum amyloid A, Sodium‐dodecylsulphate agarose gel electrophoresis, Urinary protein:creatinine ratio
Abbreviations
- CKD
chronic kidney disease
- FA
familial amyloidosis
- SAA
serum amyloid A
- SDS‐AGE
sodium‐dodecylsulfate agarose gel electrophoresis
- sSAA
concentration of SAA in serum
- UPC
urinary protein:creatinine
- uSAA
concentration of SAA in urine
Familial amyloidosis (FA) is an inherited disease affecting Abyssinian cats.1, 2 Although amyloid may be found in several tissues, the kidney is the main target organ. Typical renal lesions are medullary and glomerular amyloidosis, papillary necrosis and secondary interstitial inflammation and fibrosis that induce chronic kidney disease (CKD).3 Despite the high frequency of this condition, no tests to predict CKD in cats at risk of developing FA have been identified. Renal biopsy is too invasive to be an useful screening or monitoring test, therefore blood or urine tests that may facilitate the early identification of Abyssinian cats at risk for progression of CKD are needed.
Staining properties indicated that amyloid in cats with FA is composed by amyloid A (AA).3, 4 Serum amyloid A is an acute phase protein produced mostly, but not exclusively, in the liver. In blood, most of the SAA is bound to high density lipoproteins. Serum amyloid A works as scavenger of potentially dangerous oxidized cholesterol and has immunomodulatory activities.5, 6 Serum amyloid A is the major feline acute phase protein, because it increases in several inflammatory conditions.7, 8 Hence, SAA traditionally is used to diagnose inflammation in cats,5, 6 although mild‐to‐moderate increases also can be found in systemic diseases such as renal failure, tumors, and diabetes mellitus.9 Amyloidogenic sequences similar to amyloid proteins of other species have been found in the SAA genes of Abyssinian cats.10, 11, 12 These sequences, however, are different from those of Siamese cats,13 that mostly have hepatic amyloidosis.14, 15 Despite information on the genome variability in cats, including the Abyssinian,16, 17 previous studies failed to clearly identify amyloidogenic mutations, thus no genetic tests have been developed to identify affected animals and the only way to prevent the disease is the exclusion of cats with a familial history of FA from mating.
The course of FA is variable in terms of appearance, severity and progression.2 Amyloid deposition and azotemia may develop within 1 year, or, conversely, amyloidosis may occur slowly and renal function may remain adequate for years. A higher serum concentration of SAA was found in Abyssinian cats compared with other breeds and in Abyssinian cats with FA compared with clinically healthy Abyssinian cats.18 However, a threshold to differentiate cats with FA or a temporal relationship between the increase in SAA and progression of CKD have not been identified. Similarly, proteinuria has been described in Abyssinian cats with FA,3, 19 but information on qualitative analysis of proteinuria, recommended by recent guidelines,20 is lacking.
Therefore, in conjunction with the Italian Association of Abyssinian feline breeders, we designed a study to identify genetic markers for FA and markers of progression of CKD. The part of the project dealing with genetic profiles of Abyssinian cats still is ongoing at our institution. In this study, we report the results of identification of clinicopathological markers supporting an early diagnosis of FA. Specifically, the aim of this study was to assess whether sequential measurements of serum and urinary SAA and of the urinary protein:creatinine (UPC) ratio or sodium‐dodecylsulfate agarose gel electrophoresis (SDS‐AGE) may facilitate the early identification of Abyssinian cats developing FA.
Material and Methods
Animals and Study Design
This study was done on 109 blood and 100 urine samples collected from October 2009 to February 2013 from 23 Abyssinian cats belonging to 2 privately owned catteries (approximately, 15 adult cats each at enrollment in the study). Cattery A never had cases of amyloidosis whereas cattery B had a high prevalence of amyloidosis (13 suspected cases, 10 of which were confirmed at necropsy in the past 5 years). Four cats from cattery A (A3, A4, A5, and A6) were related to cats of cattery B because they had a common ancestor.
Cats entered the study at different times and each cat was sampled every 4 months except for cases of pregnancy and lactation or if an animal's aggressiveness and stress prevented safe sampling. Cats from cattery A were sampled only in the first year of the study whereas cats from cattery B were sampled throughout the study period. Additional samples were taken outside of the scheduled sampling times from cats showing signs of illness. Therefore, the number of samples collected from each cat was variable (Table S1). A final evaluation of the health status of all of the cats included in the study was done in February 2014.
Cats were sampled under informed consent of the owners for diagnostic or monitoring purposes. Hence, according to our regulations, the approval from the Institutional Ethical Committee was not required.
Routine Blood Testing and Urinalysis
Cats underwent complete physical examination. Blood was collected from the cephalic vein and placed in tubes containing K3‐EDTA and in tubes without anticoagulant. Routine CBC was performed on anticoagulated blood, using an automated laser counter1 followed by microscopic evaluation to determine the differential leukocyte count. On serum obtained by centrifugation (1,100 × g × 8 min), albumin, total protein, glucose, urea, creatinine, cholesterol, triglycerides, total calcium and phosphorous concentrations and ALT and ALP activities were measured on an automated biochemistry analyzer2 to assess the health status of cats. Electrolytes (Na+ K+ Cl−) were measured using a flame photometer.3 Serum then was aliquoted and frozen at −20°C for a maximum of 6 months to measure SAA. In the case of high SAA, the acute phase protein α1‐acid glycoprotein (AGP) was measured on stored sera using a radial immunodiffusion method4 as previously described.21
Urine were collected by ultrasound‐guided cystocentesis and placed into tubes without anticoagulant. Five microliter urine was used for sediment analysis as previously described.22 Sediments containing >5 RBCs or WBCs/hpf or bacteriuria were classified as active. A drop of supernatant was used to estimate the specific gravity using a hand‐held refractometer.5 Aliquots of supernatant were frozen and stored at −20°C until SDS‐AGE and uSAA analysis was performed.
Measurement of Serum Amyloid A (SAA) in Serum and Urine
The concentration of SAA in serum (sSAA) and urine (uSAA) was measured using a commercially available ELISA kit6 following the manufacturer's instructions. Coefficient of variations for intra‐ and interassay imprecision determined in our laboratory were respectively 7.8 and 10.3% for a pool of feline sera (n = 3) with very low SAA concentrations (0.34 μg/mL), 1.3 and 6.6% for a pool of feline sera (n = 3) with normal SAA concentrations (18.32 μg/mL), and 2.9 and 3.1% for a pool of feline sera (n = 10) with high SAA concentrations (79.45 μg/mL).
To normalize uSAA by urine dilution, the uSAA/uCr ratio was calculated as follows:
Quantitative and Qualitative Analysis of Proteinuria
Quantitative analysis of proteinuria was performed on fresh samples by measuring supernatants with the automated spectrophotometer described above. Both the concentrations of protein on undiluted urine using the pyrogallol red method7 and creatinine on urine prediluted 1:20 with distilled water22 using the modified Jaffè method8 were measured. The UPC ratio was calculated as follows:
Qualitative analysis of proteinuria was performed on thawed samples using SDS‐AGE with a specific kit9 on automated equipment10 as described in a previous study on canine urine.23 Gels were visually analyzed by 2 observers to identify bands corresponding to proteins of different molecular weight (MW). Samples were classified as follows (Fig 1): negative (n) = samples with no bands; negative‐albuminuric (n[alb]) = barely visible bands or visible bands of MW equal to that of albumin; glomerular (g) = samples with bands with MW >albumin; tubular (t) = samples with bands with MW < albumin; mixed (m) = samples with both bands with MW higher and lower than that of albumin.
Figure 1.
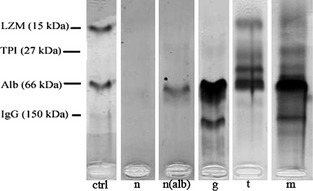
Examples of classification of SDS‐AGE found in cats included in this study: ctrl = molecular weight ladder; n = negative; n(alb) = negative (albuminuric); g = glomerular proteinuria; t = tubular proteinuria; m = mixed proteinuria.
Postmortem Examinations
Necropsy was performed on all cats that died or were euthanized because of worsening health status during the study period (2 cats from cattery A, 7 cats from cattery B). Samples of kidney and of organs potentially affected by amyloidosis were collected, fixed in 10% buffered formalin for ≤1 week, routinely processed and embedded in paraffin. Five micrometer sections were stained with hematoxylin and eosin and Congo Red with and without treatment with potassium permanganate.24 Congo red‐stained sections were observed both in bright field and under polarized light.
Statistical Analysis
Statistical analysis was performed in an Excel11 spreadsheet using the Analyse‐it software.12
Differences regarding sSAA, uSAA/uCr ratio, serum creatinine concentration and UPC ratio at first sampling between cats of cattery A and B or between cats that were alive at the end of the study period and cats that had FA (independently on the cattery of origin) were assessed using a Mann–Whitney U‐test.
Results from sequential samplings were too heterogeneous in terms of number, frequency and sequence of sampling to allow a statistical comparison of paired data. Therefore, results were not statistically compared. Rather, a visual analysis of the trends recorded in each cat was done. For sSAA and the UPC ratio, the number of cats exceeding the upper limits of the reference interval at the different sampling points was calculated. The reference interval for sSAA (0–26.7 μg/mL) was determined in our laboratory on 45 samples from clinically healthy cats enrolled in previous studies8, 25 using the Robust method as recommended by the guidelines of the American Society for Veterinary Clinical Pathology (ASVCP) for small sets of data.26 Conversely, the upper limit of normality for the UPC ratio was set at 0.40, as recommended by the guidelines for assessment and management of proteinuria in dogs and cats published by the American College of Veterinary Internal Medicine (ACVIM).20
Results
Study Population and Clinical Records
Patient signalments are reported as supporting information (Table S1).
Cats from cattery A were <3.5 years at enrollment (median age, 3.5 years; age range, 6 months–3.5 years). Females constituted 55.5% of the population. During the sampling period, no severe systemic or life‐threatening clinical signs were observed. Therefore, samples were collected only at the scheduled time intervals. No severe illnesses were documented in the next 4 years, except for 1 cat that died from congestive heart failure secondary to cardiomyopathy (cat A4) and another cat that died from nephrosclerosis and diffuse suppurative and adhesive peritonitis (cat A6). Routine histology and Congo red stains on tissues did not identify amyloid deposits in these cats, confirming that the diseases diagnosed in these 2 cats were not associated with FA.
Conversely, FA was diagnosed on postmortem examination in 7/14 cats from cattery B. Most of the cats from this cattery were <3 years of age at enrollment (median age, 1.5 years; age range, 8 months–8 years). Females constituted 57.2% of the population. Familial amyloidosis occurred by 5 years of age, except for 1 cat that developed FA at the age of 12 years. Signs of illness were recorded frequently (Table S1). Therefore, samples were also collected at months 6, 14, and 34. All of the cats from this cattery that died during the study period had FA. Specifically, moderate to severe medullary interstitial amyloidosis and minimal to focal mesangiocapillary deposits of amyloid were found in all of these cats. In addition, amyloid deposits also were found in spleen and lymph node germinal centers (5 cases), lamina propria of the gastrointestinal tract (4 cases), liver (3 cases), pancreas (3 cases), adrenal gland (3 cases), thyroid gland (3 cases) and parathyroid gland (5 cases).
Serum and Urine AA
Detailed information about the concentrations of sSAA and the uSAA/UCr ratio are reported as supporting information (Tables S2 and S3) and can be summarized as follows:
In cattery A, sSAA concentrations ranged from 0.00 to 17.71 μg/mL and therefore were constantly within the reference interval of our laboratory despite modest fluctuations over time. Conversely, sSAA concentration in cats from cattery B ranged from 0.00 to 128.41. High concentrations of sSAA were frequent in cattery B (14/80 samples) and in some cats sSAA was higher than the reference intervals in several samples, although not consecutively. Increases in sSAA in cats B6 (months 12 and 14), B7 (month 14), and B8 (month 4) were associated with other diseases (Table S1) and with increases of AGP. In all of the other cats, high sSAA concentrations were not associated with clinical signs. Occasional increases of sSAA were found both in cats that did not develop CKD and in cats that died of FA. Among these, only 3 cats had increased sSAA in the terminal stages of disease. Severely increased serum creatinine concentrations were found in cats with FA but in most cases these increases occurred shortly before death. This finding is shown in Figure 2, in which results are ordered sequentially, regardless of the actual timing of sampling, to show the trends recorded over time despite the lack of some periodic sampling.
Figure 2.
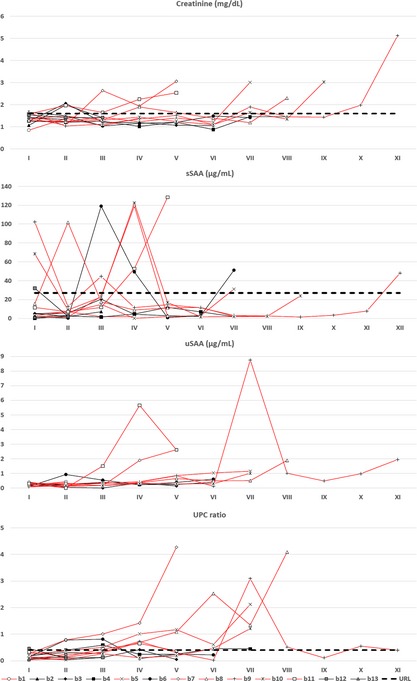
Concentration of serum creatinine, sSAA, uSAA/UCr and urinary protein:creatinine (UPC) ratio recorded over time in cats from cattery B. Results recorded in each cat are presented sequentially (samplings I to XII), independently on the actual timing of sampling. For each cat Roman number correspond to the monts of sampling reported in the second columns of Tables S2 (creatinine), S3 (sSAA), S4 (uSAA/UCr), and in the first row of Table S5 (UPC ratio). Red lines indicate cats dead for familial amyloidosis (URL = upper reference limit).
No reference intervals are available for uSAA/UCr ratio. However, uSAA is virtually absent in clinically healthy cats or in cats without FA (the highest uSAA/uCr value was 0.50). Conversely, uSAA was notably high in cats with FA (uSAA concentrations ranged from 0.00 to 8.76 μg/mL), especially in the terminal stages, independently of the concentration of sSAA. Cat B1 was the only cat with FA that constantly had low uSAA/UCr values, but samplings in the late stage of disease are lacking in this cat. Among cats without FA, only cat B6 had concentrations slightly >0.50 μg/mL in 3 samples in which sSAA also was high.
Statistical analysis (Fig 3) did not identify significant differences in serum creatinine and sSAA concentrations at first sampling, either between cattery A and B or between cats with or without FA. However, cats with FA had higher median concentrations. Conversely, the uSAA/UCr ratio was significantly higher in cattery B than in cattery A (P < .01). No significant differences were found between cats with or without FA.
Figure 3.
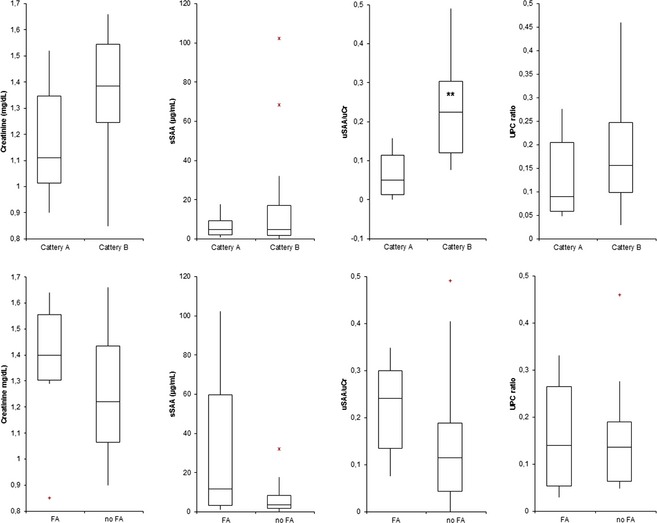
Comparison of concentration of serum creatinine, sSAA, uSAA/UCr and urinary protein:creatinine ratio, recorded at enrollment in cats from cattery A (n = 9) and B (n = 14) and between cats with (n = 7) and without familial amyloidosis (n = 16), independently on the cattery of origin. The boxes indicate the I–III interquartile range (IQR), the horizontal line indicates median values, whiskers extend to further observation within I quartile minus 1.5×IQR or within the III quartile plus 1.5×IQR. The symbol “+” and the red asterisks outside boxes indicates respectively near outliers (values exceeding I quartile minus 1.5×IQR or the III quartile plus 1.5×IQR) and far outliers (values exceeding the III quartile plus 3.0×IQR). Black bolded asterisks within boxes indicate significant differences between groups (P < .01).
Quali‐quantitative Analysis of Proteinuria
Detailed information about the UPC ratio and interpretation of SDS‐AGE are reported as supporting information (Tables S4 and S5) and can be summarized as follows:
Cats with proteinuria, defined as UPC >0.40,15 were found in both catteries (4/29 samples from cattery A, 31/71 samples from cattery B). In cattery B, proteinuria was frequent especially in cats with FA, often persistent over time and rarely (4/31 samples) associated with active sediment. Nonetheless, no association between time of appearance of proteinuria and FA was found (Fig 2). Moreover, no significant differences were observed between catteries A and B or between cats with or without FA (Fig 3).
Glomerular bands were found by SDS‐AGE in both catteries (4/28 samples in cattery A, 17/72 samples in cattery B), whereas tubular bands were exclusively found in cattery B (35/72 samples, 34 of which with a mixed pattern and 1 with a pure tubular pattern): 5/7 cats with FA had mixed proteinuria even in the absence of severe increases in the UPC ratio. Mixed proteinuria frequently was found in early stages of FA (eg, cats B7, B8, B10). Two cats with FA did not have mixed proteinuria, but 1 of these (cat B1) was not sampled in the terminal stage of the disease. Mixed proteinuria was rarely found in cats without FA, except for 2 samples from cat B4 in which tubular bands were weak and active sediment was present.
Discussion
The Abyssinian is an ancient feline breed and very popular worldwide.27 Inbreeding contributed to an increased expression of unhealthy traits, including FA, which induces CKD by the progressive deposition of amyloid. This deposition leads to death usually within 5 year of life. Breeders from Western countries report repeated severe outbreaks of the disease M. Longeri, (personal communication). Tests to identify carriers or predisposed cats are not available. Prevention is based on selection of breeding cats, but FA can only be suspected when CKD is clinically evident. Hence, the identification of affected cats occurs very late, the definitive diagnosis being based on postmortem examination, and a novel strategy to identify predisposed or affected cats by blood testing is needed.
Our data confirm the high prevalence of FA in cats genetically related to each other. Amyloidogenic sequences have not been investigated in this study but the absence of FA in the 4 cats from cattery A genetically related to cats of cattery B, suggest that factors other than genetic factor may be involved in the development of FA, as previously suggested,12 Alternatively, the higher prevalence of FA in cattery B may be associated with the higher prevalence of nonspecific diseases in this cattery. However, sSAA may increase substantially even in diseases that are not primarily inflammatory.9 The possibility that increases in inflammatory cytokines induce the disease is debated. For example, amyloidosis in the Chinese Shar‐Pei dog seems to depend on a prolonged production of SAA, triggered by persistent increases of IL‐628 in turn because of an overproduction of hyaluronic acid.29 In our study, sSAA was not persistently increased in Abyssinian cats. However, peaks of sSAA were frequent in cattery B. This may indicate a peculiar hyper‐reactivity toward weak inflammatory stimuli in these cats. Therefore, stimuli that do not induce obvious clinical signs also may be sufficient to influence the concentrations of sSAA and AGP. Surprisingly, the increases of sSAA were mild (4‐ to 5‐fold compared with the upper reference limit) compared with the magnitude reported in literature (10‐ to 50‐fold).5, 6, 7 Moreover, although sSAA concentration tended to be higher in cats from cattery B or in cats with FA, no significant increases were found before the onset of clinical signs. Lastly, cats without FA also had occasional sSAA peaks. This observation hampers the possibility of identifying a cut‐off to predict disease. Therefore, sSAA as well as serum creatinine concentration, seem not to be good markers for predicting FA.
Conversely, the uSAA/UCr ratio was significantly higher in cats from cattery B and most of the cats with FA had increased values over time, even in the absence of peaks of sSAA. This observation is interesting because the urinary concentration of an analyte may reflect its excretion and, indirectly, its serum concentration over time.20 Therefore, the high concentration of uSAA suggests that independently of the concentration recorded in randomly collected blood samples, the filtration rate of sSAA may increase. In cats with FA, this may depend on a higher daily concentration of sSAA or on peculiar physicochemical properties of sSAA that may facilitate its passage through the glomerular barrier (eg, structural changes, decreased affinity with carrier molecules such as lipoproteins). Other hypotheses to explain the high uSAA/UCr ratio include tubular secretion, decreased tubular resorbption, or a local production, because amyloid deposits have been found in the wall of the urinary bladder,3 and leakage of SAA in body fluids from local production sites (eg, joints or mammary gland) has been reported in other species.30, 31 All of these hypotheses could not be investigated in this study because the study design was focused on the collection of data from field cases to assess the potential prognostic utility of the different markers and not on the mechanism responsible for the presence of SAA in urine.
Independently of its pathogenic mechanism, the high uSAA/UCr ratio may be diagnostically relevant. A cut‐off to interpret the uSAA/UCr ratio is not available and cannot be determined by this study. However, the establishment of such a cut‐off may be the objective of future studies, because uSAA in healthy cats is virtually absent and therefore minimal increases in its concentration may identify cats with FA earlier than serum creatinine or sSAA conccentrations.
Similarly, qualitative and quantitative analyses of proteinuria should be further investigated. This study confirms that cats with FA are proteinuric, as previously reported.3, 4, 19 However, a single measurement of the UPC ratio may be of limited values because cats without FA may be proteinuric and, conversely, cats with FA were sometimes nonproteinuric. Rather, serial quantification of proteinuria seems to be valuable. Recurrent episodes of moderate to severe proteinuria were found only in cats with FA. However, the cut‐off of 0.40 for the UPC ratio, recommended by the ACVIM guidelines, may be too low, especially in intact males.20 Data reported in Table S4 indicate that in our study population intact males did not have higher UPC ratio values than castrated males or than females in samples not associated with FA. Also, the qualitative analysis of proteinuria may provide relevant information. Studies on the interpretation of SDS‐AGE and urine proteome are mostly focused on canine urine.23, 32, 33 Little information on SDS‐AGE in cats has been published, and the interpretation of SDS‐AGE in cats is hampered by the presence of cauxin, a pheromone precursor.34 To our knowledge, the banding pattern of feline urine in SDS‐AGE has not been defined. Moreover, the intensity of the bands depends on the actual amount of proteins in each sample, which in turn is affected by urine dilution. Hence, relative intensities of the different bands can be compared within each single sample but not among different samples. Therefore, we did not classify each single band in the gels and we did not grade the magnitude of the different types of proteinuria in the different cats. Rather, proteinuria was defined only as glomerular or tubular based on the presence of bands of MW higher or lower than that of albumin, respectively, and as mixed when both tubular and glomerular bands were present. Interestingly a few cats were albuminuric and in some cases albuminuric cats had high UPC ratios. Contrarily to what has been demonstrated in people, in whom microalbuminuria may appear earlier than changes in the UPC ratio, the potential role of microalbuminuria in cats still is debated.20 In our study population, albumin may be found by SDS‐AGE quite frequently and this finding seems not to be associated with FA or other renal diseases. However, as described above, SDS‐AGE cannot provide information on the actual amount of each protein, and therefore investigations on the possible role of microalbuminuria in cats should be addressed in future studies using quantitative techniques. Based on our results, the mixed proteinuria found in cats with FA is consistent with the pattern of amyloid deposition (glomerular, interstitial, and medullary) recorded at necropsy.4 Therefore, the simple detection of albuminuria or of glomerular proteins may be consistent with diseases other than FA, but mixed proteinuria may be suggestive of ongoing FA. Additional studies on CKD in cats unrelated with FA should be designed to investigate whether these changes also may be found in other forms of CKD. From a practical perspective, however, FA should be considered as the most likely pathologic condition in Abyssinian cats in which the changes described in this study support a diagnosis of CKD.
The main limitations of this study are the low number of cats, which reflects the common structure of breeding catteries, and the sequence of samplings that often was incomplete, as may occur in field studies. This last problem was largely because of the need to avoid pain, stress or discomfort to cats that had particular pathophysiological or behavioral conditions. Similarly, although it was not possible to extend samplings from cattery A for the whole study period, the breeder continued to provide information about the health status of cats submitted cats that died for necropsy. However, sequential samplings extending to the final stage of disease were available for most of the cats that finally died of FA. This allowed us to depict a dynamic profile of changes occurring in blood and urine. Last, we were unable to investigate ultrasonographic changes suggestive of amyloidosis, because clipping of the hair essential for this approach was not allowed by the owners. Therefore, we can only correlate our results with the appearance of clinical signs. In the future, the possible association between serum or urine analytes and the ultrasonographic appearance of parenchymal renal lesions should be assessed. This would allow us to determine whether the combination of laboratory testing and diagnostic imaging may further improve the possibility of early diagnose for FA.
In conclusion, this study confirmed the high frequency of FA in Abyssinian cats and also demonstrated that the disease is more common in cats with frequent peaks of acute phase proteins, including SAA, even in the absence of overt clinical signs. This suggests a possible hyper‐reactivity of Abyssinian cats to mild inflammatory stimuli or delayed clearance of SAA. However, increases in sSAA were not specific, being recorded also in cats without FA. Moreover, although sensitivity was not calculated in this study, increases in sSAA appear to be poorly sensitive because only a few cats with FA had increased sSAA before the occurrence of CKD. The concentration of sSAA frequently increased only in terminal phases when serum creatinine concentration also increased. Conversely, urinalysis may be useful because increases of the uSAA/UCr ratio, mixed proteinuria or both may be found before the occurrence of clinical signs. Despite some limitation, this study showed that serial assessment of blood and urine, with particular emphasis on uSAA or proteinuria, may be helpful in identifying cats at risk to develop FA.
Supporting information
Table S1. Signalment of the cats included in the study, number of samples and age at death.
Table S2. Concentration of SAA in serum.
Table S3. Concentration of SAA in urine, expressed as uSAA/uCr ratio.
Table S4. Urinary protein to creatinine (UPC) ratio.
Table S5. Classification of proteinuria by SDS‐AGE.
Acknowledgments
The authors thank Dr Cristina Franzoni and Claudia Zanaboni for technical support and the Italian Association of Abyssinian cats breeders (CiGas).
Conflict of Interest Declaration: Authors disclose no conflict of interest.
Off‐label Antimicrobial Declaration: Authors declare no off‐label use of antimicrobials.
This work was done at the Department of Veterinary Sciences and Public Health, University of Milan, Italy. The study was not supported by any specific grant. The paper was not presented to any scientific meeting.
Footnotes
Sysmex XT‐2000iV, Kobe, Japan
Cobas Mira, Roche Diagnostic, Basel, Switzerland
FP20, SEAC, Calenzano, Florence, Italy
Feline AGP assay, Tridelta Development Ltd, Maynooth, Kildare, Ireland
Clinical Refractometer Mod. 105, Sper Scientific, Scottsdale, Arizona
Phase SAA Assay, Tridelta Development Ltd, Maynooth, Kildare, Ireland
Fluitest USP, Analyticon Biotechnologies, Lichtenfels, Germany
Creatinina, Real Time Diagnostic, Viterbo, Italy
Hydragel 5 Proteinuria, Sebia Italia S.r.l., Bagno a Ripoli, Firenze, Italy
Hydrasis, Sebia Italia S.r.l.
Microsoft Corp, Redmond, WA
Analyse‐it Software Ltd, Leeds, UK
References
- 1. Chew DJ, DiBartola SP, Boyce JT, Gasper PW. Renal amyloidosis in related Abyssinian cats. J Am Vet Med Assoc 1982;181:139–142. [PubMed] [Google Scholar]
- 2. DiBartola SP, Hill RL, Fechheimer NS, Powers JD. Pedigree analysis of Abyssinian cats with familial amyloidosis. Am J Vet Res 1986;47:2666–2668. [PubMed] [Google Scholar]
- 3. DiBartola SP, Tarr MJ, Benson MD. Tissue distribution of amyloid deposits in Abyssinian cats with familial amyloidosis. J Comp Pathol 1986;96:387–398. [DOI] [PubMed] [Google Scholar]
- 4. Boyce JT, DiBartola SP, Chew DJ, Gasper PW. Familial renal amyloidosis in Abyssinian cats. Vet Pathol 1984;21:33–38. [DOI] [PubMed] [Google Scholar]
- 5. Paltrinieri S. The feline acute phase reaction. Vet J 2008;177:26–35. [DOI] [PMC free article] [PubMed] [Google Scholar]
- 6. Ceron JJ, Eckersall PD, Martinez‐Subiela S. Acute phase protein in dogs and cats: Current knowledge and future perspectives. Vet Clin Pathol 2005;34:85–99. [DOI] [PubMed] [Google Scholar]
- 7. Kajikawa T, Furuta A, Onishi T, et al. Changes in concentrations of serum amyloid A protein, alpha 1‐acid glycoprotein, haptoglobin, and C‐reactive protein in feline sera due to induced inflammation and surgery. Vet Immunol Immunopathol 1999;68:91–98. [DOI] [PubMed] [Google Scholar]
- 8. Giordano A, Spagnolo V, Colombo A, Paltrinieri S. Changes in some acute phase proteins and in imunnoglobulin concentrations in cats with FIP or exposed to FCoV. Vet J 2004;167:38–44. [DOI] [PMC free article] [PubMed] [Google Scholar]
- 9. Sasaki K, Ma Z, Khatlani TS, et al. Evaluation of feline serum amyloid A (SAA) as an inflammatory marker. J Vet Med Sci 2003;65:545–548. [DOI] [PubMed] [Google Scholar]
- 10. DiBartola SP, Benson MD, Dwulet FE, Cornacoff JB. Isolation and characterization of amyloid protein AA in the Abyssinian cat. Lab Invest 1985;52:485–489. [PubMed] [Google Scholar]
- 11. Johnson KH, Sletten K, Werdin RE, et al. Amino acid sequence variations in protein AA of cats with high and low incidences of AA amyloidosis. Comp Biochem Physiol B 1989;94:765–768. [DOI] [PubMed] [Google Scholar]
- 12. van Rossum M, van Asten FJ, Rofina J, et al. Analysis of cDNA sequences of feline SAAs. Amyloid 2004;11:38–43. [DOI] [PubMed] [Google Scholar]
- 13. Niewold TA, van der Linde‐Sipman JS, Murphy C, et al. Familial amyloidosis in cats: Siamese and Abyssinian AA proteins differ in primary sequence and pattern of deposition. Amyloid 1999;6:205–209. [DOI] [PubMed] [Google Scholar]
- 14. van der Linde‐Sipman JS, Niewold TA, Tooten PC, et al. Generalized AA‐amyloidosis in Siamese and Oriental cats. Vet Immunol Immunopathol 1997;56:1–10. [DOI] [PubMed] [Google Scholar]
- 15. Beatty JA, Barrs VR, Martin PA, et al. Spontaneous hepatic rupture in six cats with systemic amyloidosis. J Small Anim Pract 2002;43:355–363. [DOI] [PubMed] [Google Scholar]
- 16. O'Brien SJ, Johnson W, Driscoll C, et al. State of cat genomics. Trends Genet 2008;24:268–279. [DOI] [PMC free article] [PubMed] [Google Scholar]
- 17. Alhaddad H, Khan R, Grahn RA, et al. Extent of linkage disequilibrium in the domestic cat, Felis silvestris catus, and its breeds. PLoS ONE 2013;8:1–11. [DOI] [PMC free article] [PubMed] [Google Scholar]
- 18. DiBartola SP, Reiter JA, Cornacoff JB, et al. Serum amyloid A protein concentration measured by radial immunodiffusion in Abyssinian and non‐Abyssinian cats. Am J Vet Res 1989;50:1414–1417. [PubMed] [Google Scholar]
- 19. White JD, Norris JM, Bosward KL, et al. Persistent haematuria and proteinuria due to glomerular disease in related Abyssinian cats. J Feline Med Surg 2008;10:219–229. [DOI] [PMC free article] [PubMed] [Google Scholar]
- 20. Lees GE, Brown SA, Elliott J, et al. Assessment and management of proteinuria in dogs and cats: 2005 ACVIM forum consensus statement (small animal). J Vet Intern Med 2005;19:377–385. [DOI] [PubMed] [Google Scholar]
- 21. Rossi G, Capitani L, Ceciliani F, et al. Hyposialylated alpha‐1‐ acid glycoprotein depress phagocytosis of feline neutrophils. Res Vet Sci 2013;95:471. [DOI] [PMC free article] [PubMed] [Google Scholar]
- 22. Rossi G, Giori L, Campagnola S, et al. Evaluation of factors that affect analytic variability of urine protein‐to‐creatinine ratio determination in dogs. Am J Vet Res 2012;73:779–788. [DOI] [PubMed] [Google Scholar]
- 23. Giori L, Tricomi F, Zatelli A, et al. High‐resolution gel electrophoresis and sodium dodecyl sulphate–agarose gel electrophoresis on urine samples for qualitative analysis of proteinuria in dogs. J Vet Diagn Invest 2011;23:682–690. [DOI] [PubMed] [Google Scholar]
- 24. Wright JR, Calkins E, Humphrey RL. Potassium permanganate reaction in amyloidosis: A histologic method to assist in differentiating forms of this disease. Lab Invest 1977;36:274–281. [PubMed] [Google Scholar]
- 25. Paltrinieri S, Ibba F, Rossi G. Hematological and biochemical reference intervals of four feline breeds. J Feline Med Surg 2014;16:125–136. [DOI] [PMC free article] [PubMed] [Google Scholar]
- 26. Friedrichs KR, Harr KE, Freeman KP, et al. ASVCP reference interval guidelines: Determination of de novo reference intervals in veterinary species and other related topics. Vet Clin Pathol 2012;41:441–453. [DOI] [PubMed] [Google Scholar]
- 27. Clutton‐Brock J. Cats in modern time: Abyssinian In: Clutton‐Brock J., ed. Cats, Ancient and Modern. Cambridge, MA: Harvard University Press; 1993:67. [Google Scholar]
- 28. Rivas AL, Tintle L, Kimball ES, et al. A canine febrile disorder associated with elevated interleukin‐6. Clin Immunol Immunopathol 1992;64:36–45. [DOI] [PubMed] [Google Scholar]
- 29. Olsson M, Meadows JR, Truvè K, et al. A novel unstable duplication upstream of HAS2 predisposes to a breed‐defining skin phenotype and a periodic fever syndrome in Chinese Shar‐Pei dogs. PLoS Genet 2011;7:e1001332. [DOI] [PMC free article] [PubMed] [Google Scholar]
- 30. McDonald TL, Larson MA, Mack DR, Weber A. Elevated extrahepatic expression and secretion of mammary‐associated serum amyloid A 3 (M‐SAA3) into colostrum. Vet Immunol Immunopathol 2001;83:203–211. [DOI] [PubMed] [Google Scholar]
- 31. Jacobsen S, Niewold TA, Halling‐Thomsen M, et al. Serum amyloid A isoforms in serum and synovial fluid in horses with lipopolysaccharide‐induced arthritis. Vet Immunol Immunopathol 2006;110:325–330. [DOI] [PubMed] [Google Scholar]
- 32. Zini E, Bonfanti U, Zatelli A. Diagnostic relevance of qualitative proteinuria evaluated by use of sodium dodecyl sulfate‐agarose gel electrophoresis and comparison with renal histologic findings in dogs. Am J Vet Res 2004;65:964–971. [DOI] [PubMed] [Google Scholar]
- 33. Nabity MB, Lees GE, Dangott LJ, et al. Proteomic analysis of urine from male dogs during early stages of tubulointerstitial injury in a canine model of progressive glomerular disease. Vet Clin Pathol 2011;40:222–236. [DOI] [PubMed] [Google Scholar]
- 34. Miyazaki M, Fujiwara K, Suzuta Y, et al. Screening for proteinuria in cats using a conventional dipstick test after removal of cauxin from urine with a Lens culinaris agglutinin lectin tip. Vet J 2011;189:321–327. [DOI] [PubMed] [Google Scholar]
Associated Data
This section collects any data citations, data availability statements, or supplementary materials included in this article.
Supplementary Materials
Table S1. Signalment of the cats included in the study, number of samples and age at death.
Table S2. Concentration of SAA in serum.
Table S3. Concentration of SAA in urine, expressed as uSAA/uCr ratio.
Table S4. Urinary protein to creatinine (UPC) ratio.
Table S5. Classification of proteinuria by SDS‐AGE.