Abstract
Background
The acute phase proteins (APP) serum amyloid A (SAA), haptoglobin, and fibrinogen are valuable blood biomarkers in equine inflammatory diseases, but knowledge of factors influencing their concentrations in blood and peritoneal fluid (PF) of horses with colic is needed.
Objectives
The objective of this study was to investigate the influence of demographics (age, sex, breed), disease process (simple obstruction, strangulating obstruction, inflammatory), disease location, disease duration, hypovolemia, and admission hospital on concentrations of APP, lactate and white blood cell counts (WBC) in horses with colic admitted to 2 referral hospitals.
Animals
The study included 367 horses with colic admitted at 2 referral hospitals.
Methods
Prospective multicenter observational study of clinical data, as well as blood and PF biomarkers. Associations between biomarker concentrations and clinical variables were analyzed using multivariate linear regression analysis.
Results
Increasing pre‐admission duration of colic was associated with increased concentrations of APP in blood and PF. Blood concentrations of SAA and fibrinogen were associated with disease process (inflammatory, strangulations, simple obstructions) in more colic duration groups (5–12 and >24 hours) than any of the other biomarkers. No relevant associations between demographic factors, hospital, or hydration status and the measured biomarkers were found.
Conclusions and Clinical Importance
In horses with colic, concentrations of APP are associated mainly with disease process and duration of colic and may thus be used for assessment of disease independently of demographic or geographic factors. Serum amyloid A may be a diagnostic marker for use in colic differential diagnosis, but further evaluation is needed.
Keywords: Fibrinogen, Haptoglobin, Peritoneal fluid, Serum amyloid A
Abbreviations
- APP
acute phase proteins
- Hp
haptoglobin
- PF
peritoneal fluid
- SAA
serum amyloid A
Colic can be caused by a variety of disease processes in horses, and leads to different degrees of inflammation in the gastrointestinal tract. The most severe forms of colic, such as strangulating obstructions and acute enterocolitis, result in severe tissue damage, and inflammation. To manage and treat horses with abdominal disease optimally and avoid unnecessary surgical intervention, strangulations, and enterocolitis must be differentiated. The ability to differentiate between these 2 disease processes early in the clinical course thus is important, but can be challenging1, 2 because severe inflammation and strangulation may have a similar clinical presentation with severe colic and cardiovascular compromise.
Concentrations of acute phase proteins (APP) such as serum amyloid A (SAA), haptoglobin (Hp), and fibrinogen increase in serum of horses in response to inflammatory stimuli.3, 4, 5 In horses with inflammatory gastrointestinal diseases such as enterocolitis and peritonitis, SAA6, 7, and fibrinogen8, 9 concentrations are increased above those observed in healthy horses. Increased Hp10 and fibrinogen11 concentrations have been observed in peritoneal fluid (PF) from horses with colic. The changes in PF occurred earlier and were more pronounced than those in serum,10, 11, 12 suggesting that APP measurement in PF could provide a tool for early diagnosis of intra‐abdominal disease and prompt treatment resulting in a better prognosis.
An often overlooked aspect in the evaluation of diagnostic biomarkers is their kinetics, because such analysis requires large datasets. Knowing the time span from initiation of disease to sampling is needed to correctly interpret the results of a measured concentration.
The objective of this study was to determine how disease factors (disease process, anatomical location, disease duration, hypovolemia), horse demographics (age, sex, breed), and admission hospital influence the concentrations of APP in blood and PF in horses with colic. A second objective was to compare the APP with 2 routine blood biomarkers of inflammation and ischemia, white blood cell count (WBC), and plasma L‐lactate concentration. By establishing a multicenter study, it was possible to include more horses in the study during a shorter period of time and to generate results valid for more than 1 hospital.13
Materials and Methods
Study Population
All horses presented with colic to the University Hospital for Large Animals at the University of Copenhagen (Hospital 1) from September 2008 to May 2011 and to the Equine Clinic at the University of Pretoria (Hospital 2) from August 2009 to December 2010 were included in the study. Horses were excluded if blood samples were not collected at admission, if they were <1 year old, if they were pregnant with <1 month to term, or if a concomitant inflammatory disease unrelated to the abdomen was identified during the clinical examination (eg, respiratory infections, hoof abscesses, wounds) because these factors potentially could influence APP concentrations. Horses admitted with independent but repeated episodes of colic during the study period were included as separate study cases. As part of the routine diagnostic evaluation all horses underwent clinical examination, rectal examination, nasogastric intubation, abdominocentesis, venous blood gas analysis, fecal analysis for the presence of sand, or parasite eggs, as well as hematology and serum biochemistry. A final diagnosis was established based on repeated clinical examination and clinicopathologic data evaluation and, when available, surgical, and necropsy findings. Demographic and clinical data were recorded. Breeds were grouped into “warm blooded horses” (Warmbloods, Thoroughbreds, Standardbreds, Arabians and Western breeds) and “cold‐blooded horses” (Icelandic horses, ponies, and draught horses). The pre‐admission duration of colic (<5 hours, 5–12 hours, 13–24 hours, >24 hours, unknown), disease process (simple obstruction, strangulating obstruction, inflammatory disease, rupture, other, and unknown) and anatomical location of the disease process (stomach, small intestine, cecum, large intestine, peritoneum, and unknown) were recorded. When >1 disease process was present, the horse was allocated to the disease with greatest impact on the treatment and outcome. Diagnosis of strangulating obstructions was confirmed either at surgery or necropsy examination. Inflammatory diseases consisted of duodenitis‐proximal jejunitis (DPJ), acute typhlocolitis, and peritonitis. Duodenitis‐proximal jejunitis was diagnosed in horses with excessive gastric reflux (>20 L) over >24 hours that responded to medical treatment or in which no concomitant mechanical obstruction was identified at surgery or necropsy.14, 15 Acute colitis was diagnosed at necropsy examination or in horses that had severe cardiovascular compromise and diarrhea. Horses presented with diarrhea but without abdominal pain were not included in the study. Peritonitis was diagnosed as the primary disease in horses with PF WBC >10 × 109cells/L that responded to medical treatment or that had no apparent cause identified at surgery or necropsy. Horses with peritonitis without acute colic were excluded from the study. The study was approved by the ethical boards of both hospitals. All data and samples were collected with the owners' permission as part of the routine diagnostic evaluation.
Collection and Management of Samples
Blood and PF samples were collected from each horse at presentation. Blood samples were collected in glass tubes without anticoagulant (SST II Advance1 ) for analyses of serum SAA and Hp and in tubes with EDTA (K2E 18.0 mg1) and citrate (9NC 0.129M1) for CBC and fibrinogen concentrations, respectively. L‐lactate concentration was measured using heparinized blood. Peritoneal fluid samples were collected by abdominocentesis16 in EDTA‐stabilized tubes1 Samples for SAA, Hp, and fibrinogen analyses were centrifuged within 4 hours at 2000 × g for 10 min at room temperature, and serum, and PF supernatants were stored at −80°C until analyzed. Samples for serumbiochemistry and hematology were refrigerated at 4°C and analyzed within 60 hours at the individual hospital. For measurement of SAA, Hp, and fibrinogen, samples from Hospital 2 were shipped to Hospital 1 by a professional cold chain operator. The maximal storage time was 2 years, which has been shown not to affect SAA, Hp and fibrinogen concentrations.17, 18, 19, 20
Laboratory Analyses
Packed cell volume (PCV, %) and total plasma protein concentration (TPP, g/L) were assessed using a Hawkley's microhematocrit reader and by refractometry, respectively. White blood cell counts were performed using 2 automated assays shown previously to be highly correlated: the ADVIA 1202 in Hospital 1 and ADVIA 21203 in Hospital 221. Plasma lactate concentration (mmol/L) was assessed within 10 minutes of collection using a blood gas analyzer in Hospital 14 and using a hand‐held lactate analyzer in Hospital 25. The hand‐held lactate analyzer had an acceptable correlation (r = 0.75) with a spectrophotometric enzymatic kit at lactate concentrations <10 mmol/L.22 The SAA, Hp and fibrinogen analyses were performed at the same time in the laboratory of Hospital 1. Serum amyloid A was measured using the LZ SAA immunoturbidometric assay6 using an ADVIA 18007 as described by Jacobsen et al.23 Haptoglobin (mg/L) was measured with the Phase Range Haptoglobin assay8 using an ADVIA 18007 as described by Pihl et al.24 Fibrinogen (g/L) was measured by the Clauss method using an automated coagulometric analyser, the ACL 9000.9
Statistical Analysis
Data were entered into a database10 at each hospital. The data were registered with predetermined categorical values for the duration of colic, disease process, and anatomical location of disease process.
All measurements of SAA below the detection limit of the assay (0.48 mg/L) were assigned the concentration of the detection limit for use in the statistical calculations. Initial analyses showed that the concentrations of fibrinogen, SAA, Hp, WBC and lactate required loge‐transformation to achieve normal distributions, and thus log‐transformed data were used for all outcome variables.
The independent variables (including hospital) were included in multivariate linear regression analysis with stepwise backward elimination of the least significant variables. Interactions between hospitals and disease processes and durations were investigated to test for systematic differences between the hospitals. The interaction between disease processes and durations was investigated to determine whether all of the disease processes were accompanied by similar patterns of change in biomarker concentrations. Where continuous independent variables showed a significant association with a dependent variable (ie, a biomarker), interactions with disease process and duration were likewise tested. The linear models were tested by the evaluation of residual plots before and after the analyses were performed. Distributions of categorical variables were tested with chi‐square tests. Categories with <5 horses were combined into categories or excluded from further analysis. Tukey's adjustment for multiple comparisons was used to test for pairwise differences. A significance level of P < .05 was used in all statistical analyses. Data analysis was performed using SAS 9.2.11 Graphs were made in R.12
Results
Study Population
Four‐hundred‐and‐forty‐three horses met the inclusion criteria (see Table S1). Seventy‐six horses were excluded from the multivariate linear regression analysis because they fell into disease groups with too few individuals to allow statistical analyses to be performed (gastrointestinal ruptures, gastric ulcerations) or because of unknown or non‐specific diagnosis. Horses diagnosed with 1 of 3 different disease processes remained in the study (n = 367): simple obstructions (n = 216), strangulating obstructions (n = 88) and inflammatory diseases (n = 63).
No significant differences were identified between the 2 hospitals in distribution of horses within the categories of preadmission duration of colic (P = .122), disease processes (P = .5) or anatomical location of disease (P = .27). However, breed distribution varied significantly between the 2 hospitals (P < .0001; See Table S1). Cold‐blooded horses were more prevalent at Hospital 1 than Hospital 2.
Breeds also were not equally distributed between diseases and durations. Cold‐blooded horses were more prevalent in the inflammatory disease group compared to the other disease groups and less prevalent in the duration interval <5 hours compared to the other duration intervals. This precluded investigating the effect of breed on the APP concentration, because duration of disease was expected to have substantial influence on APP concentrations and would be an important confounder.
Duration of Colic
All biomarkers were associated with increasing preadmission duration of colic (Table 1; Figs 1, 2, 3, 4, 5, 6, 7). Serum SAA (Fig 1), PF Hp (Fig 3) and plasma lactate concentration (Fig 7) had the most rapid increases in concentration with significantly higher concentrations in horses in duration category 13–24 hours compared to horses in duration category <5 hours. There was a significant interaction between disease process and duration for SAA in PF, Hp in serum and PF, and WBC in blood. Concentrations of these biomarkers had different patterns of response for each type of disease process. Serum amyloid A and Hp in PF increased more rapidly in horses with strangulations than in the other diseases. Haptoglobin in serum (Fig 3) and WBC (Fig 6) decreased initially followed by an increase in horses with inflammatory diseases.
Table 1.
Effects of the independent variables and the relevant interaction terms on the biomarkers
| n | R 2 | Duration | Disease | Disease*Duration | Hospital | Hospital*Duration | Hospital*Disease | Sex | Age | TPP | PCV | |
|---|---|---|---|---|---|---|---|---|---|---|---|---|
| Fibrinogen | 305 | 0.36 | <0.001 | <0.001 | NS | NS | NS | NS | NS | NS | <0.001 | <0.001 |
| SAA serum | 330 | 0.33 | <0.001 | <0.001 | NS | NS | NS | NS | NS | NS | NS | 0.001 |
| SAA PF | 235 | 0.30 | <0.001 | 0.003 | 0.001 | NS | NS | NS | NS | NS | NS | NS |
| Hp serum | 326 | 0.26 | <0.001 | 0.049 | 0.03 | <0.001 | NS | NS | NS | 0.002 | <0.001 | <0.001 |
| Hp PF | 236 | 0.26 | 0.001 | <0.001 | 0.01 | NS | NS | NS | NS | NS | NS | NS |
| WBC | 306 | 0.21 | NS | 0.02 | 0.01 | 0.03 | NS | NS | NS | NS | <0.001 | NS |
| Lactate | 302 | 0.26 | <0.001 | <0.001 | NS | <0.001 | NS | NS | NS | NS | NS | <0.001 |
n, number of horses included in the multivariate logistic regression analyses for the individual biomarker; R 2, regression coefficient indicating the Goodness of Fit for the model. The closer to 1, the better fit; PF, peritoneal fluid; TPP, total plasma protein; PCV, packed cell volume; WBC, white blood cell count in the blood.
Figure 1.
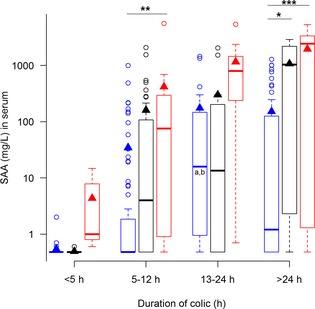
Concentrations of serum amyloid A (SAA) in serum, from horses with simple obstructions (blue), strangulating obstructions (black), and inflammatory diseases (red) grouped according to duration of colic at admission. Significant differences between disease processes within each duration interval are marked with stars *P ≤ .05; **P ≤ .01; ***P ≤ .001. Significant differences between duration intervals within each disease process are marked with letters; significant difference from <4 hours (a), 5–12 hours (b), 13–24 hours (c).
Figure 2.
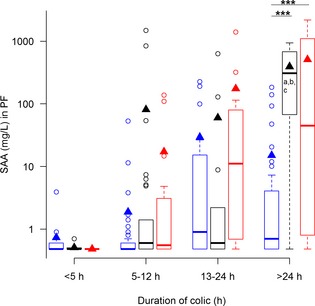
Concentrations of serum amyloid A (SAA) in peritoneal fluid (PF), from horses with simple obstructions (blue), strangulating obstructions (black), and inflammatory diseases (red) grouped according to duration of colic at admission. Significant differences between disease processes within each duration interval are marked with stars (***P ≤ .001). Significant differences between duration intervals within each disease process are marked with letters; significant difference from <4 hours (a), 5–12 hours (b), 13–24 hours (c).
Figure 3.
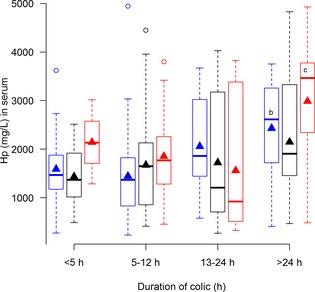
Concentrations of haptoglobin (Hp) in serum from horses with simple obstructions (blue), strangulating obstructions (black), and inflammatory diseases (red) grouped according to duration of colic at admission. No significant differences between disease processes within each duration interval are seen. Significant differences between duration intervals within each disease process are marked with letters; significant difference from <4 hours (a), 5–12 hours (b), 13–24 hours (c).
Figure 4.
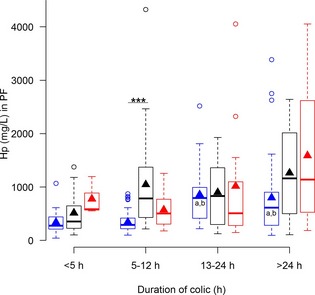
Concentrations of haptoglobin (Hp) in peritoneal fluid (PF) from horses with simple obstructions (blue), strangulating obstructions (black), and inflammatory diseases (red) grouped according to duration of colic at admission. Significant differences between disease processes within each duration interval are marked with stars (***P ≤ .001). Significant differences between duration intervals within each disease process are marked with letters; significant difference from <4 hours (a), 5–12 hours (b), 13–24 hours (c).
Figure 5.
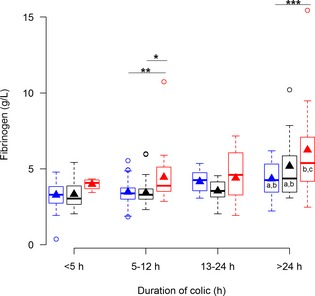
Concentrations of fibrinogen in plasma from horses with simple obstructions (blue), strangulating obstructions (black), and inflammatory diseases (red) grouped according to duration of colic at admission. Significant differences between disease processes within each duration interval are marked with stars *P ≤ .05; **P ≤ .01; ***P ≤ .001. Significant differences between duration intervals within each disease process are marked with letters; significant difference from <4 hours (a), 5–12 hours (b), 13–24 hours (c).
Figure 6.
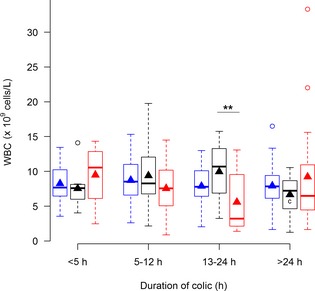
Concentrations of white blood cells (WBC) in blood from horses with simple obstructions (blue), strangulating obstructions (black), and inflammatory diseases (red) grouped according to duration of colic at admission. Significant differences between disease processes within each duration interval are marked with stars (**P ≤ .01). Significant differences between duration intervals within each disease process are marked with letters; significant difference from <4 hours (a), 5–12 hours (b), 13–24 hours (c).
Figure 7.
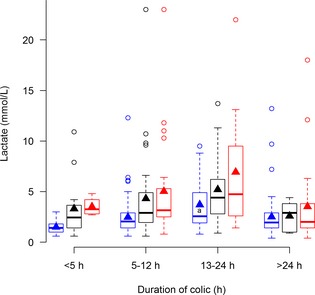
Concentrations of lactate in plasma from horses with simple obstructions (blue), strangulating obstructions (black), and inflammatory diseases (red) grouped according to duration of colic at admission. No significant differences between diseases within each duration interval are seen. Significant differences between duration intervals within each disease process are marked with letters; significant difference from <4 hours (a), 5–12 hours (b), 13–24 hours (c).
Disease Process
The various disease processes were associated with significantly different serum and PF concentrations of all of the biomarkers (Table 1). Overall, biomarker concentrations were highest in horses with inflammatory diseases, followed by those with strangulating obstructions, and were lowest in horses with simple obstructions (Figs 1, 2, 3, 4, 5, 6, 7).
Plasma fibrinogen (Fig 5) and serum SAA (Fig 1) were the only biomarkers that showed association with disease process within several duration categories, whereas serum Hp (Fig 3) and plasma lactate concentrations (Fig 7) did not show association with disease process within any of the duration categories.
Anatomical Location of Disease
The disease processes were not equally distributed among the 6 anatomical locations (P < .001). Only inflammatory conditions affected the peritoneum (23/23) and the large intestine had a predominance of simple obstructions (74%, 189/254). The effect of anatomical location on APP concentrations was confounded and could not be assessed.
Total Plasma Protein and Packed Cell Volume
None of the biomarkers in PF were associated with TPP or PCV, and all of the biomarkers in blood were very weakly correlated with TPP, PCV, or both (Table 1) with correlation coefficients <0.06. Total plasma protein concentration and PCV did not show any significant interactions with disease process or duration. They followed the same pattern for all disease processes and durations.
Demographic Factors
Sex was not associated with any of the biomarkers. Age was very weakly associated with serum Hp (r = −0.02, −0.03 to −0.007; r 2 = 0.0004, P = .002) where a decrease in concentration was seen with increasing age, whereas concentrations of the other biomarkers were unaffected by age (Table 1).
Hospital of Admission
Serum Hp, plasma lactate, and WBC differed between the hospitals (Table 1). Serum Hp concentrations were higher (r = 0.24, 0.10–0.37; r 2 = 0.06, P < .001) and lactate (r = −0.22, −0.37 to −0.07; r 2 = 0.05, P = .004) and WBC (r = −0.13, −0.24 to −0.015; r 2 = 0.02, P = .026) lower in Hospital 1 than in Hospital 2. There were no interactions between hospital and disease process or duration for any of the biomarkers.
Discussion
To the authors' knowledge, ours is the first study to measure SAA and Hp in PF in a large group of horses with colic. Likewise, it is the first study to investigate how APP concentrations are associated with disease process and preadmission duration of disease, as well as variables related to the horse (eg, age, sex, hypovolemia) and the hospital to which the horse was admitted. Disease process and duration were significantly associated with the concentrations of all of the biomarkers tested, and it is therefore important to take this factor into consideration when interpreting concentrations of biomarkers. On the other hand, no clinically relevant association was seen between demographic factors, admission hospital or presence of hypovolemia, and any of the biomarkers measured in blood and PF. Surprisingly, we found that concentrations of SAA were not higher in PF than in serum for any duration of disease, whereas Hp concentrations in PF showed a more dramatic response than concentrations in serum.
Duration of Colic
All biomarkers with the exception of WBC were markedly associated with the preadmission duration of colic. The results of this study thus expand and corroborate previous findings regarding the kinetics of equine APP,25, 26 lactate27, and WBC28, and emphasize the importance of establishing the duration of disease when evaluating biomarkers of inflammation and hypoxia.29 Serial measurements can improve the diagnostic performance of biomarkers30 especially when large individual differences, bidirectional changes or both are present, which is seen for WBC and serum Hp, both of which have wide reference intervals in healthy horses24, 31, 32 and may experience initial decreases before inflammation‐induced increases manifest themselves. Determination of the duration of colic in the horses included in this study was an estimate based on information from the owners. The intervals are large because owners often did not monitor the horses during the night, and it was therefore not possible to give exact durations of colic.
Disease Process
The 3 categories of disease processes (simple obstructions, strangulating obstructions, inflammatory diseases) responsible for colic in horses all elicited inflammatory responses to varying extents. However, inflammatory diseases, comprising cases with DPJ, acute typhocolitis and peritonitis, had the most marked APP responses as described previously for serum SAA6 and fibrinogen in plasma8 and PF.11 Bacterial infections or toxins are accepted as part of the etiology for these diseases,1, 33, 34 and pronounced inflammation generally is seen as a response to bacterial growth, bacterial invasion, or both as well as to cell injury caused by bacterial infections.35 This finding also is consistent with other studies of APP in horses that suggest that bacterial infections elicit a larger APP response than do other inflammatory diseases.36, 37
The magnitude of the APP response is positively associated with the amount of tissue affected and the severity of tissue damage.3 This may explain the greater APP response seen in horses with enterocolitis and peritonitis, because tissue damage often is widespread in contrast to the more localized lesions seen in horses with strangulations. In addition, strangulating lesions cause severe pain that result in shorter duration of disease at the time of admission. Horses with enterocolitis and peritonitis develop pain gradually, and thus may be presented later in the course of their disease, at which time they have developed more extensive tissue damage with higher APP concentrations.
Concentrations of SAA in PF were expected to differ more among the disease processes than SAA concentrations in serum, but unexpectedly this was not the case. In contrast, PF Hp concentrations differed more than serum Hp. This substantiates previously reported findings10 that the PF Hp response is greater than the serum response in horses with colic.
Disease Process and Duration of Colic
Because both duration of colic and disease process influence the APP response, it is useful for the clinician to know the interaction between these 2 factors. When biomarker concentrations were evaluated within each of the duration categories, SAA in serum and plasma fibrinogen concentrations were significantly different between diseases in 2 duration categories, whereas SAA in PF, Hp in PF, and WBC were significantly different in 1 duration category. Lactate in plasma and Hp in PF did not have any significant differences among diseases in any of the investigated duration categories. This observation means that if a horse has had colic for <5 hours, none of the biomarkers are expected to be significantly different among disease processes. After 5–12 hours of colic, plasma fibrinogen, and serum SAA concentrations are significantly higher in inflammatory diseases and Hp in PF is significantly higher in strangulating obstructions. After 13–24 hours of colic, WBC is the only biomarker with significant differences among diseases. After 24 hours however significant differences were seen between plasma fibrinogen as well as serum and PF SAA.
The large magnitude of concentration change in SAA in serum seen in this and other studies29 favors its use and merits further investigation of its performance as a diagnostic and prognostic marker in horses with colic.
Total Plasma Protein and Packed Cell Volume
Increased PCV and TPP, were only very weakly correlated with the concentrations of all of the biomarkers measured in blood, and not with the biomarkers measured in PF. A similar finding was reported previously for lactate.38 The influence of increased PCV and TPP on APP concentrations hence is clinically extremely limited because the coefficients are very small and not relevant when compared to the increases in concentration elicited by inflammatory stimuli.3
Demographic Factors
Sex had no association with serum and PF concentrations for any of the measured biomarkers. This observation is consistent with previous studies on SAA,23 whereas serum Hp has been shown to be higher in thoroughbred mares in training when compared with stallions.39 Age was weakly negatively associated with serum Hp, as seen previously in healthy horses.4 Serum Hp however has a very wide reference interval in healthy horses,24 and compared with disease‐induced changes in concentrations, the very small fluctuations caused by age seem clinically irrelevant.
Hospital of Admission
Although the 2 hospitals are located in very different climates, receive different breeds and have slightly different examination protocols for horses with colic, the distributions of disease processes, preadmission duration of colic and anatomical locations of disease were comparable.
Differences in serum Hp, WBC, and plasma lactate were observed between the 2 hospitals. The differences were equivalent for all disease processes and durations, however, because no interactions between them and the hospital were seen. Therefore, the interpretation of changes in these biomarkers was the same at the 2 hospitals although individual concentrations were not identical.
The differences in lactate and WBC could have been caused by the different assays and the different handling of samples or differences in duration as well as severity of disease within the duration and disease categories.
Despite the large number of horses included in this multicenter study, considerable overlap was evident in the concentrations of the APP, WBC, and lactate among disease processes. As expected, none of the biomarkers appeared to be able to unequivocally distinguish between inflammatory diseases and strangulating obstructions. Similar findings have been reported previously for SAA in serum6 and plasma fibrinogen concentrations.8 The diagnostic potential of the APP in combination with 1 another and other blood biochemical and hematological variables as well as with clinical variables therefore should be evaluated in future studies.
In conclusion, SAA in serum and PF, Hp in serum and PF, and plasma fibrinogen, and lactate increased with increased duration of colic preadmission, and APP showed significant differences among disease groups, with inflammatory abdominal resulting in the highest APP concentrations. Serum amyloid A in serum seemed to be the most promising biomarker. Owing to the considerable overlap in APP concentrations among disease processes, further evaluation of their diagnostic potential must be performed before their potential relevance in management of horses with abdominal disease can be established.
Supporting information
Table S1. Demographics, disease processes, and duration of colic for the horses from Hospitals 1 and 2.
Acknowledgments
The authors are grateful to the veterinarians and technical staff at the University Hospital for Large Animals, University of Copenhagen for assistance with collection of samples. We also thank Assistant Professor Gaby van Galen, DVM, PhD, Dipl. ECEIM, for her constructive help with reading and commenting on the manuscript.
The study was funded by a Danish Government PhD grant (Tina Holberg Pihl) and by the University of Pretoria from the Department of Companion Animal Clinical Studies Research Fund and the Faculty of Veterinary Science Research Fund. Additional funding was generously provided by The Danish Horse Levy Fund (Hesteafgiftsfonden), The Carlsberg Fund and the Jubilee Fund of The Royal Danish Horse Insurance Company.
Conflict of Interest Declaration: Authors disclose no conflict of interest.
Off‐label Antimicrobial Declaration: Authors declare no off‐label use of antimicrobials.
Collection of data was performed at University of Copenhagen and University of Pretoria. Laboratory and statistical analyzes were performed at University of Copenhagen.
Footnotes
BD Vacutainer; Belliver Industrial Estate, Plymouth, UK
Bayer A/S, Lyngby, Denmark
Siemens Health Care Diagnostics Inc, Tarrytown, NY
Radiometer ABL725; Radiometer Medical ApS, Brønshøj, Denmark
Accusport Blood Lactate Analyzer; Roche Diagnostics, Basel, Switzerland
EIKEN Chemical Co Ltd, Tokyo, Japan
ADVIA 1800 Chemistry System; Siemens Health Care Diagnostics Inc, Tarrydown, NY
Tridelta Development Ltd, Kildare, Ireland
Instrumentation Laboratory, Barcelona, Spain
Microsoft Office Access 2007; Microsoft Corporation, Redmond, WA
SAS Institute Inc, Cary, NC
R:A language and Environment for Statistical Computing; R Development Core Team, Vienna, Austria
References
- 1. Feary DJ, Hassel DM. Enteritis and colitis in horses. Vet Clin N Am‐Equine 2006;22:437–479. [DOI] [PubMed] [Google Scholar]
- 2. Southwood LL. Acute abdomen. Clin Tech Equine P 2006;5:112–126. [Google Scholar]
- 3. Jacobsen S, Andersen PH. The acute phase protein serum amyloid A (SAA) as a marker of inflammation in horses. Equine Vet Educ 2007;19:38–46. [Google Scholar]
- 4. Taira T, Fujinaga T, Okumura M, et al. Equine haptoglobin: Isolation, characterization, and the effects of ageing, delivery and inflammation on its serum concentration. J Vet Med Sci 1992;54:435–442. [DOI] [PubMed] [Google Scholar]
- 5. Borges AS, Divers TJ, Stokol T, Mohammed OH. Serum iron and plasma fibrinogen concentrations as indicators of systemic inflammatory diseases in horses. J Vet Intern Med 2007;21:489–494. [DOI] [PubMed] [Google Scholar]
- 6. Vandenplas ML, Moore JN, Barton MH, et al. Concentrations of serum amyloid A and lipopolysaccharide‐binding protein in horses with colic. Am J Vet Res 2005;66:1509–1516. [DOI] [PubMed] [Google Scholar]
- 7. Forbes G, Sorich E, Nath LC, et al. Activin A as a novel biomarker of equine inflammatory abdominal disease: Preliminary findings. Vet J 2011;190:154–156. [DOI] [PubMed] [Google Scholar]
- 8. Prasse KW, Topper MJ, Moore JN, Welles EG. Analysis of hemostasis in horses with colic. J Am Vet Med Assoc 1993;203:685–693. [PubMed] [Google Scholar]
- 9. Topper MJ, Prasse KW. Analysis of coagulation proteins as acute‐phase reactants in horses with colic. Am J Vet Res 1998;59:542–545. [PubMed] [Google Scholar]
- 10. Eurell TE, Wilson DA, Baker GJ. The effect of exploratory laparotomy on the serum and peritoneal haptoglobin concentrations of the pony. Can J Vet Res 1993;57:42–44. [PMC free article] [PubMed] [Google Scholar]
- 11. Collatos C, Barton MH, Prasse KW, Moore JN. Intravascular and peritoneal coagulation and fibrinolysis in horses with acute gastrointestinal‐tract diseases. J Am Vet Med Assoc 1995;207:465–470. [PubMed] [Google Scholar]
- 12. Peiro JR, Barnabe PA, Cadioli FA, et al. Effects of lidocaine infusion during experimental endotoxemia in horses. J Vet Intern Med 2010;24:940–948. [DOI] [PubMed] [Google Scholar]
- 13. Pocock SJ. The size of a clinical trial. In: Pocock SJ, ed. Clinical Trials: A Practical Approach, Chichester: John Wiley; 1983;1:123–141. [Google Scholar]
- 14. Underwood C, Southwood LL, McKeown KP, Knight D. Complications and survival associated with surgical compared with medical management of horses with duodenitis‐proximal jejunitis. Equine Vet J 2008;40:373–378. [DOI] [PubMed] [Google Scholar]
- 15. Cohen ND, Toby E, Roussel AJ, et al. Are feeding practices associated with duodenitis‐proximal jejunitis? Equine Vet J 2006;38:526–531. [DOI] [PubMed] [Google Scholar]
- 16. Coffman JR. Technic and interpretation of abdominal paracentesis. Mod Vet Pract 1973;54:79–81. [PubMed] [Google Scholar]
- 17. Satoh M, Fujinaga T, Okumura M, Hagio M. Sandwich enzyme‐linked‐immunosorbent‐assay for quantitative measurement of serum amyloid‐a protein in horses. Am J Vet Res 1995;56:1286–1291. [PubMed] [Google Scholar]
- 18. Gutiérrez AM, Martínez‐Subiela S, Cerón JJ. Evaluation of changes in haptoglobin and C‐reactive protein concentrations caused by freezing of saliva and meat juice samples collected from healthy and diseased pigs. Am J Vet Res 2011;72:11–17. [DOI] [PubMed] [Google Scholar]
- 19. Brindle E, Fujita M, Shofer J, O'Connor KA. Serum, plasma, and dried blood spot high‐sensitivity C‐reactive protein enzyme immunoassay for population research. J Immunol Methods 2010;362:112–120. [DOI] [PMC free article] [PubMed] [Google Scholar]
- 20. Lewis MR, Callas PW, Jenny NS, Tracy RP. Longitudinal stability of coagulation, fibrinolysis, and inflammation factors in stored plasma samples. Thromb Haemost 2001;86:1495–1500. [PubMed] [Google Scholar]
- 21. Harris N, Jou JM, Devoto G, et al. Performance evaluation of the ADVIA 2120 hematology analyzer: An international multicenter clinical trial. Lab Hematol 2005;11:62–70. [PubMed] [Google Scholar]
- 22. Schulman ML, Nurton JP, Guthrie AJ. Use of the Accusport semi‐automated analyser to determine blood lactate as an aid in the clinical assessment of horses with colic. J S Afr Vet Assoc 2001;72:12–17. [DOI] [PubMed] [Google Scholar]
- 23. Jacobsen S, Kjelgaard‐Hansen M, Petersen HH, Jensen AL. Evaluation of a commercially available human serum amyloid A (SAA) turbidometric immunoassay for determination of equine SAA concentrations. Vet J 2006;172:315–319. [DOI] [PubMed] [Google Scholar]
- 24. Pihl TH, Andersen PH, Kjelgaard‐Hansen M, et al. Serum amyloid A and haptoglobin concentrations in serum and peritoneal fluid of healthy horses and horses with acute abdominal pain. Vet Clin Pathol 2013;42:177–183. [DOI] [PubMed] [Google Scholar]
- 25. Nunokawa Y, Fujinaga T, Taira T, et al. Evaluation of serum amyloid‐a protein as an acute‐phase reactive protein in horses. J Vet Med Sci 1993;55:1011–1016. [DOI] [PubMed] [Google Scholar]
- 26. Hulten C, Gronlund U, Hirvonen J, et al. Dynamics in serum of the inflammatory markers serum amyloid A (SAA), haptoglobin, fibrinogen and alpha(2)‐globulins during induced noninfectious arthritis in the horse. Equine Vet J 2002;34:699–704. [DOI] [PubMed] [Google Scholar]
- 27. Liao XP, She YX, Shi CR, Li M. Changes in body‐fluid markers in intestinal ischemia. J Pediatr Surg 1995;30:1412–1415. [DOI] [PubMed] [Google Scholar]
- 28. Ewert KM, Fessler JF, Templeton CB, et al. Endotoxin‐induced hematologic and blood chemical changes in ponies: Effects of flunixin meglumine, dexamethasone, and prednisolone. Am J Vet Res 1985;46:24–30. [PubMed] [Google Scholar]
- 29. Kjelgaard‐Hansen M, Jacobsen S. Assay validation and diagnostic applications of major acute‐phase protein testing in companion animals. Clin Lab Med 2011;31:51–70. [DOI] [PubMed] [Google Scholar]
- 30. Peloso JG, Cohen ND. Use of serial measurements of peritoneal fluid lactate concentration to identify strangulating intestinal lesions in referred horses with signs of colic. J Am Vet Med Assoc 2012;240:1208–1217. [DOI] [PubMed] [Google Scholar]
- 31. Pollock PJ, Prendergast M, Schumacher J, Bellenger CR. Effects of surgery on the acute phase response in clinically normal and diseased horses. Vet Rec 2005;156:538–542. [DOI] [PubMed] [Google Scholar]
- 32. Jacobsen S, Nielsen JV, Kjelgaard‐Hansen M, et al. Acute phase response to surgery of varying intensity in horses: A preliminary study. Vet Surg 2009;38:762–769. [DOI] [PubMed] [Google Scholar]
- 33. Arroyo LG, Stampfli HR, Weese JS. Potential role of Clostridium difficile as a cause of duodenitis‐proximal jejunitis in horses. J Med Microbiol 2006;55:605–608. [DOI] [PubMed] [Google Scholar]
- 34. Southwood LL, Russell G. The use of clinical findings in the identification of equine peritonitis cases that respond favorably to medical therapy. J Vet Emerg Crit Care 2007;17:382–390. [Google Scholar]
- 35. Lewis DH, Chan DL, Pinheiro D, et al. The immunopathology of sepsis: Pathogen recognition, systemic inflammation, the compensatory anti‐inflammatory response, and regulatory T cells. J Vet Intern Med 2012;26:457–482. [DOI] [PMC free article] [PubMed] [Google Scholar]
- 36. Stoneham SJ, Palmer L, Cash R, Rossdale PD. Measurement of serum amyloid A in the neonatal foal using a latex agglutination immunoturbidimetric assay: Determination of the normal range, variation with age and response to disease. Equine Vet J 2001;33:599–603. [DOI] [PubMed] [Google Scholar]
- 37. Jacobsen S, Thomsen MH, Nanni S. Concentrations of serum amyloid A in serum and synovial fluid from healthy horses and horses with joint disease. Am J Vet Res 2006;67:1738–1742. [DOI] [PubMed] [Google Scholar]
- 38. Latson KM, Nieto JE, Beldomenico PM, Snyder JR. Evaluation of peritoneal fluid lactate as a marker of intestinal ischaemia in equine colic. Equine Vet J 2005;37:342–346. [DOI] [PubMed] [Google Scholar]
- 39. Cywinska A, Szarska E, Kowalska A, et al. Gender differences in exercise‐induced intravascular haemolysis during race training in thoroughbred horses. Res Vet Sci 2011;90:133–137. [DOI] [PubMed] [Google Scholar]
Associated Data
This section collects any data citations, data availability statements, or supplementary materials included in this article.
Supplementary Materials
Table S1. Demographics, disease processes, and duration of colic for the horses from Hospitals 1 and 2.


