Abstract
Background
Blastomycosis is a potentially fatal fungal disease that most commonly affects humans and dogs. The organism causes systemic inflammation and has a predilection for the lungs. The inflammation might lead to a hypercoagulable state with microemboli in the pulmonary circulation which could contribute to inadequate oxygen exchange in infected dogs.
Hypothesis/Objectives
Dogs with blastomycosis will be hypercoagulable compared with healthy case‐matched controls.
Animals
Client‐owned dogs with a diagnosis of blastomycosis (n = 23) and healthy case‐matched controls (n = 23).
Methods
Prospective case‐controlled study of client‐owned dogs presented to a veterinary teaching hospital with clinical signs compatible with blastomycosis. Complete blood counts, fibrinogen, PT, aPTT, thromboelastometry (TE), thrombin antithrombin complexes (TAT), and thrombin generation were evaluated.
Results
Cases had a leukocytosis compared with controls [mean (SD) 16.6 (7.6) × 103/μL versus 8.2 (1.8) × 103/μL, P < .001], hyperfibrinogenemia [median 784 mg/dL, range 329–1,443 versus median 178 mg/dL, range 82–257, P < .001], and increased TAT concentrations [mean (SD) 9.0 (5.7) μg/L versus 2.0 (2.8) μg/L, P < .001]. As compared to controls, cases were also hypercoagulable as evaluated by thromboelastometry and had increased in vitro thrombin generation on calibrated automated thrombography.
Conclusions and Clinical Importance
Hypercoagulability occurs in dogs with systemic blastomycosis. Additional studies are needed to explore a possible contribution of thrombogenicity to the clinical manifestations of systemic blastomycosis.
Keywords: Canine, Thromboelastography, Thromboelastometry, Thrombosis
Abbreviations
- α
alpha angle
- aPTT
activated partial thromboplastin time
- ARDS
acute respiratory distress syndrome
- CBC
complete blood count
- CFT
clot formation time
- CT
hematocrit, coagulation time
- ETP
endogenous thrombin potential
- MCF
maximum clot firmness
- PT
thromboelastometry, prothrombin time
- TAT
thrombin antithrombin complex
Blastomycosis is a potentially fatal fungal disease that is contracted by inhalation of infectious spores produced by the mycelial form of the organism Blastomyces dermatiditis. Pulmonary blastomycosis has a broad range of clinical presentations from mild respiratory distress to acute respiratory failure. Infection rapidly progresses to acute respiratory distress syndrome and shock in 8–12% of human patients affected,1, 2 with a case fatality rate of 50–89%.1, 2, 3, 4, 5 Infection results in a marked inflammatory reaction characterized by a pyogranulomatous response. An excessive inflammatory response might be contributory to the poor prognosis, and to the clinical deterioration associated with institution of antifungal treatment.6 Excessive inflammation in infected patients might be leading to secondary hypercoagulability. Development of microemboli in the pulmonary circulation as a consequence of hypercoagulability could contribute to inadequate oxygen exchange in infected dogs.
Systemic hypercoagulability has not been previously described in association with blastomycosis, although pulmonary thromboembolism7 and arterial thromboembolism (with atrial wall erosion by an infected lymph node)8 occur in infected dogs and a single report describes deep venous thrombosis with pulmonary embolism in a horse with systemic blastomycosis.9 The purpose of this study was to determine whether dogs with naturally occurring, untreated blastomycosis were hypercoagulable as compared to healthy control animals from a similar environment.
Materials and Methods
Animals
Client‐owned dogs presented to the Veterinary Teaching Hospital with clinical signs consistent with blastomycosis were eligible for enrollment. All clients signed an informed consent form that was approved by the Institutional Animal Care and Use Committee at the University of Illinois. Animals were excluded if they were <5 kg body weight, had evidence of a concurrent disease known to be associated with hypercoagulability such as nephrotic syndrome, immune‐mediated disease, cardiac disease, protein losing enteropathy, neoplasia, heartworm infection, or hyperadrenocorticism or had received antifungal treatment before presentation. Blastomycosis was confirmed on cytologic or histopathologic examination of tissues, aspirates, or exudates by a board certified pathologist, or by a positive blastomyces quantitative antigen enzyme immunoassay1 test performed on urine.
Matched case‐controls were selected from a population of 157 apparently healthy client‐owned dogs living in the same local environment. All control animals were without clinical complaint and had no abnormalities identified on complete blood count or serum biochemical panel. Cases were matched with controls by age (±1 year) and sex. Cases were also matched with controls by breed when an exact match was available from the healthy population. If no breed match was available, then a closely related breed from within the same class was selected. If no closely related breed was available, or if the case was of mixed genetic origin, then a mixed breed of similar body weight (±3 kg) was selected.
Blood Collection and Handling for Analysis
Blood was collected upon presentation via venipuncture of a jugular vein using an 18 or 20 g needle attached to a syringe, and was immediately transferred into plain, K2EDTA, and citrate tubes, the latter at a ratio of 9 : 1 for blood: 3.2% citrate (buffered sodium citrate silicon‐coated glass, 2.7 mL tube)2 then mixed thoroughly by gentle repeated inversion. All samples were collected before initiation of antifungal treatment. Serum and EDTA blood were submitted to the clinical diagnostic laboratory. Complete blood counts were performed on a Cell‐dyn 3700 hematology analyzer.3 An aliquot of the citrated whole blood was immediately used for thromboelastometry, as described below. The remaining citrated whole blood was centrifuged at 2,500 × g for 10 minutes at room temperature for collection of platelet‐poor plasma. Plasma was aliquoted into Eppendorf tubes and frozen at −80°C for later batch analysis.
Whole Blood Thromboelastometry
Whole blood thromboelastometry was performed on a ROTEM system4 according to the manufacturer's instructions, by methods validated for canine whole blood.10 Samples were evaluated at 37°C within 30 minutes of collection. Citrated whole blood samples (300 μL) were added to manufacturer supplied reagents using the supplied electronic pipette. All clotting reactions contained 20 μL of the manufacturer supplied concentrated calcium chloride reagent (startem). Reactions additionally contained either 20 μL of supplied tissue factor reagent (extem) or 20 μL of supplied ellagic acid reagent for contact activation (intem). Evaluations were performed in duplicate. Clot development was observed for 1 hour.
Variables collected from the manufacturer's modeling software included coagulation time (CT), which is lag period from initiation of the reaction until an amplitude of 2 mm is recorded; clot formation time (CFT), which is the duration necessary for amplitude to increase from 2 to 20 mm; alpha angle (α), which is the angle of change of the amplitude over the course of the CFT; and maximum clot firmness (MCF), which is the greatest amplitude achieved. Expected MCF values for extem assays were predicted from calculations based on the previously described11 dependence of MCF on hematocrit, fibrinogen concentration, and platelet concentration.
Additional Assays of Coagulation
Prothrombin time (Neoplastine Cl+),5 activated partial thromboplastin time (STA‐aPTT, Diagnostica Stago), and fibrinogen (Fibritest‐automate) 5 assays were performed on a manual fibrometer (STart4).5 Thrombin‐antithrombin complex (TAT) concentrations were measured by ELISA (Enzygnost TAT micro)6 in duplicate, the use of which was previously validated for canine plasma.12
Thrombography was performed on a calibrated automated thrombograph (Thrombinoscope)5 with the Hemker method13 according to the manufacturer's instructions. This assay evaluates the time course of thrombin generation and inhibition in real time, interrogating the continuing generation of thrombin that occurs after formation of the fibrin clot.14 Samples were evaluated in triplicate with coagulation triggered using manufacturer‐supplied tissue factor (PPP‐Low reagent) and CaCl2/fluorogenic substrate (FluCa reagent) reagents. Thrombin generation was evaluated for 30 minutes. Data collected from the thrombinoscope software included lag time, time to peak thrombin activity, peak thrombin activity, and endogenous thrombin potential (ETP).
Statistical Analysis
Shapiro‐Wilk tests were used to evaluate normality of both case and control datasets. Parametric datasets were compared using t‐tests, whereas nonparametric sets were compared using Mann‐Whitney Rank Sum tests. Statistical comparisons were performed using commercial software.7 Significance was defined at a P < .05.
Results
Whole blood thromboelastometry was performed at presentation on 28 dogs with clinical signs consistent with blastomycosis. Five dogs were later excluded from further analysis either because of identification of concomitant disease, or lack of confirmation of infection with Blastomyces. For the 23 cases with confirmed blastomycosis, the median age was 4.1 years (range 1.5–11.8 years) and sex distribution was 14 males (3 intact) and 9 females (2 intact). Each case was matched with 1 control, resulting in a total of 23 controls.
Ocular (n = 11; 48%), respiratory (n = 8; 35%), and skin (n = 6; 26%) lesions predominated. Thoracic radiographs obtained at the time of diagnosis were abnormal in 19 (90%) of those in which radiographs were available (n = 21). Abnormal Roentgen signs included a diffuse military pattern (n = 7, 37%), nodular interstitial pattern (n = 3, 16%), thoracic lymphadenopathy (n = 4, 21%), lung mass (n = 5, 26%), and consolidated lung/lobar sign (n = 3, 16%).
The diagnosis of blastomycosis was obtained from a single test method in 17 animals (74%). Four (17%) dogs were diagnosed solely through lymph node cytologic examination, 4 (17%) dogs were diagnosed solely by impression smear cytology from a skin lesion, 4 dogs were diagnosed solely from ocular aspiration or histopathology, 3 (13%) dogs were diagnosed solely by positive cytologic examination of lung aspirates, and 2 (9%) dogs were diagnosed solely from a positive urine antigen result. Other means of diagnosis included fine needle aspiration of bone, and necropsy. The remainder (n = 6, 26%) tested positive for blastomycosis on more than 1 test method.
Complete blood counts indicated that dogs with blastomycosis had slightly lower indicators of circulating red cell mass than did apparently healthy dogs, although the erythrocyte concentrations (Fig 1A) and hematocrits (Supplemental Figure) for cases were all within reference interval. Cases had a significant leukocytosis characterized by a mature neutrophilia and monocytosis. Mean (SD) leukocyte concentrations were significantly higher for cases [16.6 (7.6) × 103/μL] as compared to controls [8.2 (1.8) × 103/μL; P < .001] (Fig 1B). Similarly, mean (SD) segmented neutrophil concentrations were significantly higher for cases [13.2 (6.8) × 103/μL] as compared to controls [5.1 (1.7) × 103/μL; P < .001] (Fig 1C). Mean (SD) monocyte concentrations were also significantly higher for cases [1.1 (0.9) × 103/μL] versus controls [0.5 (0.3) × 103/μL; P = .011] (Fig 1D). Platelet concentrations were more variable in the case cohort than in the control cohort, but the median was significantly higher for cases [3.18 × 10⁵/μL] as compared to controls [2.47 × 10⁵/μL; P = .016] (Fig 1E).
Figure 1.
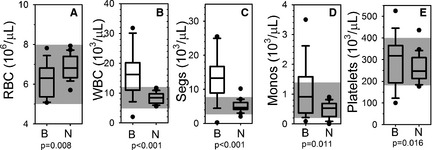
Blood cells. Box and whisker plots describing results of complete blood counts for the blastomycosis cohort (“B”) and the normal control cohort (“N”). Boxes represent the 25–75th percentile, central lines represent median values, whiskers indicate the 5–95th percentile, and outliers are described by filled circles. The gray region indicates reference interval. (A) Red blood cell concentration (RBC), (B) total white blood cell concentration (WBC), (C) segmented neutrophil concentration (Segs), (D) monocyte concentration (Monos), and (E) platelet concentration (platelets).
The results of routine screening plasma coagulation assays (PT and aPTT) were unremarkable, with results for cases falling primarily within reference interval, and not statistically different from controls (Fig 2A,B). Hyperfibrinogenemia (Fig 2C) was identified in 100% of cases, and plasma fibrinogen concentration was significantly different between cases (median 784 mg/dL, range 329–1,443) and controls (median 178 mg/dL, range 82–257; P < .001). Mean (SD) TAT concentration was also significantly higher in cases [9.0 (5.7) μg/L] than in controls [2.0 (2.8) μg/L; P < .001].
Figure 2.
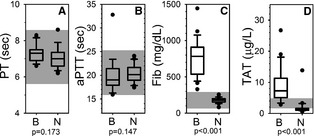
Coagulation assays. Box and whisker plots describing results of routine plasma coagulation assays for the blastomycosis cohort (“B”) and the normal control cohort (“N”). Boxes represent the 25–75th percentile, central lines represent median values, whiskers indicate the 5–95th percentile, and outliers are described by filled circles. The gray region indicates reference interval. (A) Prothrombin time (PT), (B) activated partial thromboplastin time (aPTT), (C) fibrinogen concentration (Fib), and (D) thrombin‐antithrombin complex concentration (TAT).
Whole blood samples from cases appeared hypercoagulable on thromboelastometry regardless of whether the trigger was tissue factor (extem, Fig 3) or ellagic acid (intem, Fig 4). Although no cases had an abnormal extem CT, and only 5 cases (22%) had an abnormal intem CT, there was a statistically significant difference between cases and controls. Variables describing the kinetics of clot formation (CFT and α) were hypercoagulable on either extem or intem for 100% of cases. MCF values were above reference interval for 22 samples, with the remaining sample having an MCF at the upper limit of reference interval on 1 of the 2 assays. When datasets for each of the 4 variables were compared between cases and controls, all comparisons indicated statistically significant differences between the 2 populations. Bland‐Altman analysis comparing predicted MCF to the actual measured MCF indicated that effects of the slightly low hematocrit, high fibrinogen, and generally higher platelet concentrations in the samples from cases did not account for the abnormally high MCF values (Fig 4E).
Figure 3.
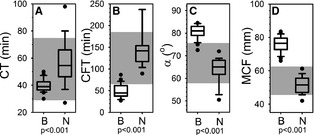
Extem thromboelastometry. Box and whisker plots describing results of extem thromboelastometry assays for the blastomycosis cohort (“B”) and the normal control cohort (“N”). Boxes represent the 25–75th percentile, central lines represent median values, whiskers indicate the 5–95th percentile, and outliers are described by filled circles. The gray region indicates reference interval. (A) Coagulation time (CT), (B) clot formation time (CFT), (C) alpha angle (α), and (D) maximum clot firmness (MCF). (E) Bland‐Altman plot comparing predicted maximum clot firmness (MCF) to measured MCF. Predicted MCF was calculated using the described11 dependence of MCF on hematocrit, fibrinogen concentration, and platelet concentration. MCF values for the control cohort are denoted by □. MCF values for the blastomycosis case cohort are denoted by ▼.
Figure 4.
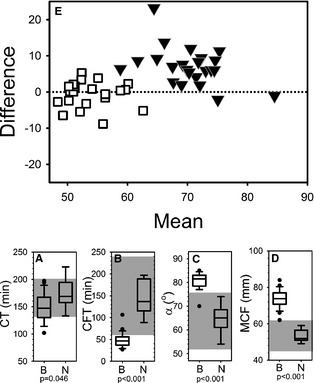
Intem thromboelastometry. Box and whisker plots (A–D) describing results of intem thromboelastometry assays for the blastomycosis cohort (“B”) and the normal control cohort (“N”). Boxes represent the 25–75th percentile, central lines represent median values, whiskers indicate the 5–95th percentile, and outliers are described by filled circles. The gray region indicates reference interval. (A) Coagulation time (CT), (B) clot formation time (CFT), (C) alpha angle (α), and (D) maximum clot firmness (MCF).
Calibrated automated thrombography indicated that thrombin generation was excessive in cases as compared to controls, with all 4 measured variables [lag time (minutes), P = .018; time to peak (minutes), P = .023; peak (nM), P < .001; endogenous thrombin potential (nM), P < .001] statistically different between cases and controls (Fig 5).
Figure 5.
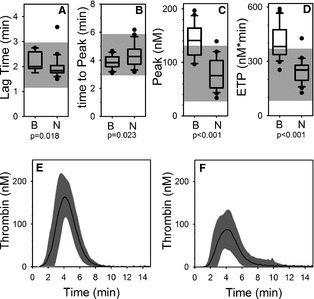
Calibrated automated thrombography. Box and whisker plots (A–D) of describing results of calibrated automated thrombography for the blastomycosis cohort (“B”) and the normal control cohort (“N”). Boxes represent the 25–75th percentile, central lines represent median values, whiskers indicate the 5–95th percentile, and outliers are described by filled circles. The gray region indicates reference interval. (A) Lag time (CT), (B) time to peak thrombin (time to peak), (C) peak thrombin (peak), (D) endogenous thrombin potential (ETP), (E) Mean (solid line) ±1 standard deviation (gray area) curves describing the time course of thrombin generation for cases. (F) Mean (solid line) ±1 standard deviation (gray area) curves describing the time course of thrombin generation for controls.
Discussion
This study documents significant hypercoagulability in systemic blastomycosis in dogs including elevations in plasma fibrinogen concentration, hypercoagulable thromboelastometry tracings, and excessive in vitro and in vivo thrombin generation.
Hypercoagulability has not been recognized in this population, because abnormalities are not detected on routine plasma coagulation assays in humans and dogs with blastomycosis. Results of PT and aPTT were not abnormal, although these routine coagulation assays are designed for evaluating plasma for evidence of hypocoagulability rather than hypercoagulability, and are insensitive to changes that increase the rate of thrombin generation.
Plasma fibrinogen concentration was markedly increased for cases as compared to controls; not unsurprising as systemic fungal infection is associated with inflammation. The neutrophilic leukocytosis in these infected dogs supports an ongoing systemic inflammatory response.15, 16 Concomitant hyperfibrinogenemia occurs in disease states associated with thrombosis in dogs, including neoplasia,17 protein losing nephropathy,18 and babesiosis.19 Hyperfibrinogenemia in humans is associated with increased risk of cardiovascular disease and arterial and venous thrombosis, with higher risk of death or thrombosis in subjects with the highest plasma fibrinogen concentration.20, 21, 22, 23, 24, 25, 26, 27, 28 There is a direct causal relationship between hyperfibrinogenemia and thrombosis in mice, where increased fibrinogen concentration increases thrombus fibrin content, promotes faster fibrin formation, and increases fibrin network density, strength, and stability.29
Results of thromboelastometry assays also indicated evidence of marked hypercoagulability in the blood from these dogs. Use of thromboelastometry has become increasingly popular to evaluate for hypercoagulability, owing to the insensitivity of standard plasma assays. This approach is subject to some limitations. Depending on the methodology used, results might be influenced by ex vivo changes. We avoided this issue by using an approach documented to be insensitive to variability in sample handling.10 Whole blood thromboelastometry is sensitive to increased plasma fibrinogen concentration,30, 31 so we would expect that the hyperfibrinogenemia contributed to the evidence of abnormal clot formation on thromboelastometry, particularly the abnormal MCF values.
Mild decreases in hematocrit can artifactually impact the results obtained with whole blood thromboelastometry, causing apparent hypercoagulability.11, 32 Although the animals in our case cohort had hematocrits mostly with reference interval, there was a statistically significant difference between cases and controls. Even such minor differences in red cell mass might contribute to apparent but artifactual hypercoagulability on thromboelastometry.11, 32
To determine whether or not the lower hematocrit could have been primarily responsible for the apparent hypercoagulability we observed on thromboelastometry, we used the previously described mathematical relationship between hematocrit, fibrinogen concentration, platelet concentration, and thromboelastometry to predict MCF values11 for these samples. These calculations indicated that the slightly low hematocrit and high fibrinogen could not have accounted for all of the apparent hypercoagulability indicated via the thromboelastometry results, suggesting another component was contributory.
We further evaluated plasma from the case cohort using thrombography, which is not influenced by either fibrinogen concentration or hematocrit as it evaluates real time thrombin generation in vitro in the plasma sample.13 Thrombin generation was abnormal in the case cohort, with evidence of both more rapid thrombin generation (shortened lag time and time to peak) and greater amount of thrombin generated (higher peak, higher area under the curve or ETP).
Lastly, the finding of elevations in plasma TAT concentration provides strong support for the presence of in vivo hypercoagulability in dogs with blastomycosis, as formation of TAT complexes is a specific marker of ongoing in vivo thrombin generation.
The hypercoagulability documented in cases in this report indicates that these dogs are prothrombotic, and could develop thrombi that adversely impact the perfusion component of gaseous exchange. Additional studies are needed to further explore a possible contribution of thrombogenicity to the clinical manifestations of systemic blastomycosis. Thromboprophylaxis might potentially have a role in improving outcome in this population.
Supporting information
Fig S1. Hematocrit (HCT). Box and whisker plots describing results of HCT for blastomycosis cohort (“B”) and the normal control cohort (“N”). Boxes represent the 25‐75th percentile, central lines represent median values, whiskers indicate the 5‐95th percentile. The gray region indicates reference interval.
Acknowledgments
This work was supported by the James R. Harkness fund and the Wayne D. & Josephine H. Spangler Endowment Funds, College of Veterinary Medicine, University of Illinois.
Conflict of Interest Declaration: Stephanie Smith is an associate editor for the Journal of Veterinary Internal Medicine.
Off‐label Antimicrobial Declaration: The authors declare no off‐label use of antimicrobials.
All work was completed at the University of Illinois.
Footnotes
Mira Vista Laboratory, Indianapolis, IN
BD, Franklin Lakes, NJ
Abbott Diagnostics, Abbott Park, IL
Tem International GmbH, Munich, Germany
Diagnostica Stago, Assiernes, France
Siemens Healthcare Diagnostics Products GmbH, Marburg, Germany
Sigma Stat 2.03, SPSS Inc, Chicago, IL
References
- 1. Lemos LB, Baliga M, Guo M. Acute respiratory distress syndrome and blastomycosis: Presentation of nine cases and review of the literature. Ann Diagn Pathol 2001;5:1–9. [DOI] [PubMed] [Google Scholar]
- 2. Vasquez JE, Mehta JB, Agrawal R, et al. Blastomycosis in northeast Tennessee. Chest 1998;114:436–443. [DOI] [PubMed] [Google Scholar]
- 3. Chapman SW, Dismukes WE, Proia LA, et al. Clinical practice guidelines for the management of blastomycosis: 2008 update by the Infectious Diseases Society of America. Clin Infect Dis 2008;46:1801–1812. [DOI] [PubMed] [Google Scholar]
- 4. Meyer KC, McManus EJ, Maki DG. Overwhelming pulmonary blastomycosis associated with the adult respiratory distress syndrome. N Engl J Med 1993;329:1231–1236. [DOI] [PubMed] [Google Scholar]
- 5. Gauthier GM, Safdar N, Klein BS, et al. Blastomycosis in solid organ transplant recipients. Transpl Infect Dis 2007;9:310–317. [DOI] [PubMed] [Google Scholar]
- 6. Lahm T, Neese S, Thornburg AT, et al. Corticosteroids for blastomycosis‐induced ARDS: A report of two patients and review of the literature. Chest 2008;133:1478–1480. [DOI] [PubMed] [Google Scholar]
- 7. McGuire NC, Vitsky A, Daly CM, et al. Pulmonary thromboembolism associated with Blastomyces dermatitidis in a dog. J Am Anim Hosp Assoc 2002;38:425–430. [DOI] [PubMed] [Google Scholar]
- 8. Ware WA, Fenner WR. Arterial thromboembolic disease in a dog with blastomycosis localized in a hilar lymph node. J Am Vet Med Assoc 1988;193:847–849. [PubMed] [Google Scholar]
- 9. Wilson JH, Olson EJ, Haugen EW, et al. Systemic blastomycosis in a horse. J Vet Diagn Invest 2006;18:615–619. [DOI] [PubMed] [Google Scholar]
- 10. Smith SA, McMichael M, Galligan A, et al. Clot formation in canine whole blood as measured by rotational thromboelastometry is influenced by sample handling and coagulation activator. Blood Coagul Fibrinolysis 2010;21:692–702. [DOI] [PubMed] [Google Scholar]
- 11. Smith SA, McMichael MA, Gilor S, et al. Correlation of hematocrit, platelet concentration, and plasma coagulation factors with results of thromboelastometry in canine whole blood samples. Am J Vet Res 2012;73:789–798. [DOI] [PubMed] [Google Scholar]
- 12. Tarnow I, Falk T, Tidholm A, et al. Hemostatic biomarkers in dogs with chronic congestive heart failure. J Vet Intern Med 2007;21:451–457. [DOI] [PubMed] [Google Scholar]
- 13. Hemker HC, Willems GM, Beguin S. A computer assisted method to obtain the prothrombin activation velocity in whole plasma independent of thrombin decay processes. Thromb Haemost 1986;56:9–17. [PubMed] [Google Scholar]
- 14. Hemker HC, Giesen P, Al Dieri R, et al. Calibrated automated thrombin generation measurement in clotting plasma. Pathophysiol Haemost Thromb 2003;33:4–15. [DOI] [PubMed] [Google Scholar]
- 15. Arceneaux KA, Taboada J, Hosgood G. Blastomycosis in dogs: 115 cases (1980–1995). J Am Vet Med Assoc 1998;213:658–664. [PubMed] [Google Scholar]
- 16. Garma‐Avina A. Cytologic findings in 43 cases of blastomycosis diagnosed ante‐mortem in naturally‐infected dogs. Mycopathologia 1995;131:87–91. [DOI] [PubMed] [Google Scholar]
- 17. Madewall BR, Feldman BF, O'Neill S. Coagulation abnormalities in dogs with neoplastic disease. Thromb Haemost 1980;44:35–38. [PubMed] [Google Scholar]
- 18. Donahue SM, Brooks M, Otto CM. Examination of hemostatic parameters to detect hypercoagulability in dogs with severe protein‐losing nephropathy. J Vet Emerg Crit Care (San Antonio) 2011;21:346–355. [DOI] [PubMed] [Google Scholar]
- 19. Furlanello T, Fiorio F, Caldin M, et al. Clinicopathological findings in naturally occurring cases of babesiosis caused by large form Babesia from dogs of northeastern Italy. Vet Parasitol 2005;134:77–85. [DOI] [PubMed] [Google Scholar]
- 20. Acevedo M, Pearce GL, Kottke‐Marchant K, et al. Elevated fibrinogen and homocysteine levels enhance the risk of mortality in patients from a high‐risk preventive cardiology clinic. Arterioscler Thromb Vasc Biol 2002;22:1042–1045. [DOI] [PubMed] [Google Scholar]
- 21. Yarnell JW, Baker IA, Sweetnam PM, et al. Fibrinogen, viscosity, and white blood cell count are major risk factors for ischemic heart disease. The Caerphilly and Speedwell collaborative heart disease studies. Circulation 1991;83:836–844. [DOI] [PubMed] [Google Scholar]
- 22. van Hylckama Vlieg A, Rosendaal FR. High levels of fibrinogen are associated with the risk of deep venous thrombosis mainly in the elderly. J Thromb Haemost 2003;1:2677–2678. [DOI] [PubMed] [Google Scholar]
- 23. Wilhelmsen L, Svardsudd K, Korsan‐Bengtsen K, et al. Fibrinogen as a risk factor for stroke and myocardial infarction. N Engl J Med 1984;311:501–505. [DOI] [PubMed] [Google Scholar]
- 24. Danesh J, Lewington S, Thompson SG, et al. Plasma fibrinogen level and the risk of major cardiovascular diseases and nonvascular mortality: An individual participant meta‐analysis. J Am Med Assoc 2005;294:1799–1809. [DOI] [PubMed] [Google Scholar]
- 25. Lindahl B, Toss H, Siegbahn A, et al. Markers of myocardial damage and inflammation in relation to long‐term mortality in unstable coronary artery disease. FRISC Study Group. Fragmin during Instability in Coronary Artery Disease. N Engl J Med 2000;343:1139–1147. [DOI] [PubMed] [Google Scholar]
- 26. Kannel WB, Wolf PA, Castelli WP, et al. Fibrinogen and risk of cardiovascular disease. The Framingham Study. J Am Med Assoc 1987;258:1183–1186. [PubMed] [Google Scholar]
- 27. Toss H, Lindahl B, Siegbahn A, et al. Prognostic influence of increased fibrinogen and C‐reactive protein levels in unstable coronary artery disease. FRISC Study Group. Fragmin during Instability in Coronary Artery Disease. Circulation 1997;96:4204–4210. [DOI] [PubMed] [Google Scholar]
- 28. Kamphuisen PW, Eikenboom JC, Vos HL, et al. Increased levels of factor VIII and fibrinogen in patients with venous thrombosis are not caused by acute phase reactions. Thromb Haemost 1999;81:680–683. [PubMed] [Google Scholar]
- 29. Machlus KR, Cardenas JC, Church FC, et al. Causal relationship between hyperfibrinogenemia, thrombosis, and resistance to thrombolysis in mice. Blood 2011;117:4953–4963. [DOI] [PMC free article] [PubMed] [Google Scholar]
- 30. Nielsen VG, Cohen BM, Cohen E. Effects of coagulation factor deficiency on plasma coagulation kinetics determined via thrombelastography: Critical roles of fibrinogen and factors II, VII, X and XII. Acta Anaesthesiol Scand 2005;49:222–231. [DOI] [PubMed] [Google Scholar]
- 31. Peyvandi F. Results of an international, multicentre pharmacokinetic trial in congenital fibrinogen deficiency. Thromb Res 2009;124(Suppl 2):S9–S11. [DOI] [PubMed] [Google Scholar]
- 32. McMichael MA, Smith SA, Galligan A, et al. In vitro hypercoagulability on whole blood thromboelastometry associated with in vivo reduction of circulating red cell mass in dogs. Vet Clin Pathol 2014;43:154–163. [DOI] [PubMed] [Google Scholar]
Associated Data
This section collects any data citations, data availability statements, or supplementary materials included in this article.
Supplementary Materials
Fig S1. Hematocrit (HCT). Box and whisker plots describing results of HCT for blastomycosis cohort (“B”) and the normal control cohort (“N”). Boxes represent the 25‐75th percentile, central lines represent median values, whiskers indicate the 5‐95th percentile. The gray region indicates reference interval.


