

Abstract
Background
Frequency and classification of anemia in terms of regeneration status and erythrocyte indices are not well described in cats.
Objective
To determine frequency and regenerative status of anemia in samples from adult cats, to assess the sensitivity and specificity of macrocytosis and hypochromasia for detecting regenerative anemia (RA), and to evaluate the association of anemia with increased serum creatinine concentration (SC).
Study Population
Laboratory records from 30,503 blood samples from cats (2003–2011).
Methods
Clinicopathologic data reviewed retrospectively. Anemia defined as hematocrit (Ht) ≤27%, red blood cell count (RBC) ≤5.5 × 10⁶/μL and hemoglobin (Hb) ≤9.0 g/dL. RA defined by manual absolute reticulocyte count >50 × 103/μL. Macrocytosis was defined as mean corpuscular volume (MCV) >55 fL and hypochromasia as mean corpuscular hemoglobin concentration (MCHC) <31 g/dL. Cutoff for increased serum creatinine concentration was 1.6 mg/dL.
Results
Overall, 1,098 of 30,503 blood samples (3.6%) from cats fulfilled criteria for anemia, 633 of 1,098 (57.7%) classified as nonregenerative (NRA) and 465 of 1,098 (42.3%) as regenerative. RBC, Ht, and Hb were significantly lower in the RA compared to NRA group (P < .05). Sensitivity and specificity of the combined high MCV and low MCHC to detect samples with RA were 19.5 and 90.7%. SC was increased in 572 of the 1,098 anemic samples (52.1%) and in 11,121 of 29,405 of nonanemic samples (37.8%).
Conclusions and Clinical Importance
Majority of anemic samples were classified as NRA. Anemia was more severe in cats with RA. Erythrocyte indices were not sensitive indicators of RA.
Keywords: Erythrocyte indices, Nonregenerative, Regenerative, Reticulocytes
Abbreviations
- CBC
complete blood count
- CKD
chronic kidney disease
- CV
coefficient of variation
- EDTA
ethylenediaminetetraacetic acid
- Hb
hemoglobin
- Ht
hematocrit
- MCHC
mean corpuscular hemoglobin concentration
- MCH
mean corpuscular hemoglobin
- MCV
mean corpuscular volume
- NRA
nonregenerative anemia
- RA
regenerative anemia
- RBC
red blood cell count
- SC
serum/plasma creatinine concentration
- WBC
white blood cell
Anemia is defined as a decrease in hematocrit (Ht), red blood cell count (RBC), or hemoglobin (Hb) concentration below the reference range,1, 2 and is regarded by some authors as common and one of the most frequent hematological abnormalities found in cats.1 ,[ 3, 4 ] The aggregate reticulocyte count has been used to assess the degree of regeneration in anemic cats.5
Regenerative signs are manifested 4–8 days after the onset of hemorrhage or hemolysis,6 unless earlier erythroid precursors are targeted.7 Nonregenerative anemia (NRA) is associated with chronic kidney disease,1, 8, 9 chronic disease or inflammation,10 pure red cell aplasia,7 myeloproliferative syndromes,1 infectious diseases (eg, FeLV),11 and in iron and nutritional deficiencies.1
Mean corpuscular volume (MCV) and mean corpuscular hemoglobin concentration (MCHC) are commonly used to describe erythrocyte populations.6 Some references state that these erythrocyte indices can be used to evaluate regeneration status and that usually NRA is normocytic normochromic, and regenerative anemia (RA) is macrocytic hypochromic,1, 2, 3, 6, 9 but these features often are not observed in practice.2
Published information about anemia in cats is focused on specific causes of anemia and information regarding the frequency of anemia is scarce. There is a large discrepancy among the findings of different studies, and the number of cats included in these studies has ranged from 11 to 194 individuals.2 ,[ 4, 7, 10, 11, 12, 13, 14, 15, 16 ] Only one study was the frequency of anemic cats reported (10% of cats referred to a veterinary clinic). However, no total numbers were given in that study.3 Commonly reported causes of anemia include renal disease,2 ,[ 4, 14, 15, 16 ] anemia of chronic disease or inflammation,2 ,[ 4, 13, 14 ] bleeding,2 ,[ 4, 14, 15 ] hemolysis, and bone marrow abnormalities.2 ,[ 4, 13, 15 ] These causes have been found to occur at different frequencies depending on the study population evaluated. If veterinarians were aware of the frequency of anemia in cats, clinical facilities could be adapted appropriately in terms of diagnostic equipment and therapeutic options. Additionally, to justify investments into research for the development of future therapeutic options, information about disease frequency and contributing factors is needed. Thus, the frequency of anemia and its further characterization are of interest. Although not necessarily representative of an individual cat population, data derived from many laboratory samples could provide reliable information and avoid the need to take samples from cats experimentally. The regeneration status of an anemic patient is important to understand underlying causes, treatment options, and prognosis.2, 3 Erythrocyte MCV and hypochromasia often are used for predicting RA,2, 3 but the sensitivity and specificity of theses indices are largely unknown in cats.
The first aim of this study was to determine the frequency of anemia in a large number of blood samples from cats submitted between 2003 and 2011 to a private referral laboratory and to characterize the anemia as RA or NRA. Additional objectives were to classify the anemic samples in terms of MCV and MCHC and to investigate the diagnostic utility of these indices. In addition, the proportion of blood samples with increased SC was determined in the overall study population and in nonanemic, as well as the NRA and RA samples. The correlation between degree of anemia and SC also was examined.
It was hypothesized that the majority of anemic samples would represent NRA and specific erythrocyte indices would not be indicative of regenerative status.
Material and Methods
Selection of Samples
Data were retrieved retrospectively from the laboratory information system of a private veterinary laboratory for the time period from January 2003 to May 2011. The blood samples were submitted primarily by first opinion veterinarians in and surrounding Vienna (Austria). The reasons for the submission of samples were not known. To be included in the study, samples had to be from cats >1 year of age, and a complete blood count (CBC), and SC concentration had to have been available. The CBC included Ht, RBC, Hb, MCV, MCHC, mean hemoglobin concentration (MCH), white blood cell count, and a 5‐part differential cell count. Exclusion criteria were repeat samples, samples with recorded hemolysis, lipemia or icterus. Only anemic samples with a reticulocyte count were included for further evaluation of anemia. Repeat samples were identified by searching for those records containing the same owner and patient name. Only results from the first CBC were included in the study.
Sample Analysis
Samples for CBC were submitted in tubes containing lithium–heparin or potassium–ethylenediaminetetraacetic acid (EDTA) in different volumes. The method and site of blood collection were not known. The samples were approximately 2–48 hours old.
Complete blood count was performed with an automated hematology analyzer3 using impedance technology to measure RBC count and MCV, and a spectrophotometric method to measure Hb. The Ht, MCHC, and MCH were calculated automatically by the analyzer. The aggregate reticulocyte count was determined manually by a microscopic method. Briefly, 100 μL of anticoagulated whole blood was added to 100 μL 3% brilliant cresyl blue4 and mixed for 20 minutes. A blood film was prepared and the slide was examined microscopically using a 100× immersion oil objective (total magnification 1,000×). One thousand erythrocytes were evaluated and the percentage of aggregate reticulocytes was determined. Aggregate reticulocytes were defined according to the internal laboratory standard operating procedure as having ≥1 aggregates of reticulum (aggregate defined as ≥3 small granules of reticulum) or >6 small granules of reticulum. The absolute aggregate reticulocyte count then was automatically calculated by the laboratory information system.
Samples for SC measurement were collected at the same time as samples for the CBC. Creatinine concentration was measured in serum or lithium–heparin plasma with an automated biochemistry analyzer (Dimension RxL5 ) using the picrate method (modified Jaffe′s reaction; CREA Flex Dimension5). Calibrations were performed according to the manufacturer's instructions and internal quality controls were performed daily for both analyzers.
Criteria for Classification
Laboratory internal reference intervals were used in the classification of anemia as RA or NRA. MCV, MCHC, and increased SC were comparable to previous reports.4, 14, 16, 17, 18, 19, 20, 21, 22, 23, 24 Samples were classified as anemic when Ht ≤ 27% and RBC ≤ 5.5 × 10⁶/μL and Hb ≤ 9 g/dL. Samples were further classified into RA and NRA groups based on the aggregate reticulocyte count. Samples with reticulocyte count >50 × 103/μL were defined as RA. Erythrocytes were categorized as macrocytic when MCV was >55 fL, as normocytic when MCV was 40–55 fL, and microcytic when MCV was <40 fL. Samples were classified as hyperchromic, when MCHC was >34 g/dL; normochromic, when MCHC was 31–34 g/dL; and hypochromic, when MCHC was <31 g/dL. A SC > 1.6 mg/dL was classified as increased.
Statistical Analysis
All statistical analyses were performed using SAS software package version 9.3.6 Data were assessed visually for normality. Normality tests were not used because of the large power of the data set; data are therefore reported both as mean and median. Standard descriptive summary statistics were calculated for the continuous variables Ht, RBC, Hb, MCV, MCHC, reticulocytes, and SC for all samples and for the subgroups of NRA and RA samples. The diagnostic utility of MCV and MCHC was assessed using a 2‐way table. MCV and MCHC were used to calculate the proportions of the various combinations of macrocytic, normocytic, microcytic, hyperchromic, normochromic, and hypochromic samples in the RA and NRA groups. Proportions were compared using a binomial test for equal rates (one‐sample test) and Fisher's exact test (2‐sample test). The 2‐sample t‐test and Wilcoxon rank‐sum test were used to compare means and medians, respectively. The correlation of SC with Ht, RBC, and Hb was investigated using Spearman's rank correlation coefficient. A P value of <.05 was considered significant.
Results
Overall, 44,904 feline blood samples were submitted during the time period of the study. Initially 7,261 repeat samples and 7,001 samples reported as hemolytic, lipemic, or icteric were excluded. There were 139 feline blood samples that were classified as anemic but for which no reticulocyte count was available and these were excluded from the total study population. The total study population after these exclusions consisted of results from 30,503 blood samples. The reason for sample submission and the site of blood collection could not be determined.
Concerning the total study population, 1,098 of 30,503 blood samples (3.6%) were identified as anemic. Of these, 633 of 1,098 (57.7%) were determined to be NRA and 465 of 1,098 (42.3%) were RA. Figure 1 shows the frequency of anemic samples, the distribution into NRA and RA groups and the frequency of increased SC in the various groups. There was a significantly higher proportion of NRA samples compared to RA samples (binomial test; P < .0001).
Figure 1.
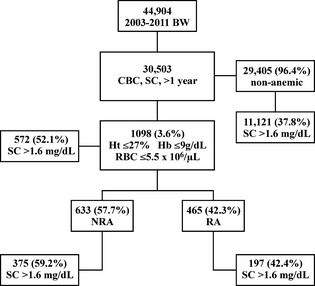
Anemia distribution combined with increased SC. BW, blood work; CBC, complete blood count; SC, serum creatinine; NRA, nonregenerative anemia; RA, regenerative anemia.
The median age of each group (total study population, nonanemic, anemic, NRA, and RA) was 11.0 years (range, 1.0–25.0, 1–25.0, 1.0–21.0, 1.0–20.0, and 1.0–21.0, respectively). There was no significant difference between the age of the nonanemic and anemic groups (P = .59) or between the NRA and RA groups (P = .94; Wilcoxon's rank‐sign test for medians).
Information about sex was missing for 1,293 of 30,503 samples. The remaining study population was composed of 15,377/29,210 (52.6%) males and 13,833/29,210 (47.4%) females. In the anemic group, data on sex were missing for 49/1,098; there were 611/1,049 (58.2%) males, and 438/1,049 (41.8%) females. There was a significantly higher proportion of males than females in the total study population and in all groups (P < .0001; for RA, P = .009; binomial test).
Results for Ht, RBC, Hb, MCV, MCHC, and SC for the anemic, NRA, and RA groups and P‐values for comparison of these analytes are presented in Table 1; results for SC in the nonanemic group also are presented. If just 1 criterion for anemia was set, results were as follows: if the Ht was used as the sole criterion (cutoff: ≤27%) 1,891/30,503 (6.2%) anemic samples were found. If RBC (≤5.5 × 10⁶/μL) was used, 1,443/30,503 (4.7%) anemic samples were detected, and if Hb (≤9 g/dL) was selected, anemia was present in 1,982/30,503 (6.5%) samples.
Table 1.
Results of the mean, SD, median (minimal and maximal ranges) for Ht, RBC, Hb, MCV, MCHC, and SC from the anemic, NRA and RA groups. The P values resulting from comparison of parameters between the RA and NRA group are shown (t‐test for means, Wilcoxon's rank‐sign test for medians).
| Mean ± SD | Median (Min–Max Range) | P Value | ||
|---|---|---|---|---|
| Mean | Median | |||
| Hematocrit (%) | ||||
| Anemic group (n = 1,098) | 19.9 ± 4.6 | 20.7 (5.7–27.0) | ||
| NRA (n = 633) | 20.1 ± 4.8 | 21.4 (5.7–27.0) | .006 | .0001 |
| RA (n = 465) | 19.5 ± 4.3 | 19.8 (7.1–27.0) | ||
| RBC (×106/μL) | ||||
| Anemic group (n = 1,098) | 4.1 ± 1.1 | 4.4 (0.9–5.5) | ||
| NRA (n = 633) | 4.2 ± 1.2 | 4.6 (0.9–5.5) | <.0001 | <.0001 |
| RA (n = 465) | 3.9 ± 1.0 | 4.2 (1.0–5.5) | ||
| Hemoglobin (g/dL) | ||||
| Anemic group (n = 1,098) | 6.5 ± 1.6 | 6.8 (1.4–9.0) | ||
| NRA (n = 633) | 6.7 ± 1.7 | 7.1 (1.8–9.0) | <.0001 | <.0001 |
| RA (n = 465) | 6.1 ± 1.5 | 6.3 (1.4–9.0) | ||
| MCV (fL) | ||||
| Anemic group (n = 1,098) | 50.3 ± 9.3 | 49.0 (31.0–110.0) | ||
| NRA (n = 633) | 49.8 ± 8.9 | 48.0 (31.0–103.0) | .029 | .003 |
| RA (n = 465) | 51.0 ± 9.7 | 49.0 (31.0–110.0) | ||
| MCHC (g/dL) | ||||
| Anemic group (n = 1,098) | 32.4 ± 3.3 | 32.5 (10.8–53.3) | ||
| NRA (n = 633) | 33.2 ± 3.1 | 33.3 (20.5–53.3) | <.0001 | <.0001 |
| RA (n = 465) | 31.4 ± 3.3 | 31.4 (10.8–44.4) | ||
| Creatinine (mg/dL) | ||||
| Nonanemic group (n = 29,405) | 1.88 ± 1.95 | 1.50 (0.1–106.00) | <.0001 | <.0001 |
| Anemic group (n = 1,098) | 3.24 ± 3.27 | 1.70 (0.30–23.53) | ||
| NRA (n = 633) | 3.62 ± 3.42 | 2.10 (0.30–20.20) | <.0001 | <.0001 |
| RA (n = 465) | 2.72 ± 2.99 | 1.50 (0.40–23.53) | ||
Ht, hematocrit; RBC, red blood cell count; Hb, hemoglobin; SC, serum/plasma creatinine concentration; SD, standard deviation; NRA, nonregenerative anemia; RA, regenerative anemia; MCV, mean corpuscular volume; MCHC, mean corpuscular hemoglobin concentration.
P < .05 significant.
Classification of the samples with anemia based on MCV and MCHC is presented in Table 2.
Table 2.
Anemic sample distribution based on MCV and MCHC classification in the NRA, RA, and anemic group.
| Classification | NRA (n = 633) | RA (n = 465) | Anemic (n = 1,098) |
|---|---|---|---|
| Macrocytic hypochromic | 47 (7.4%) | 54 (11.6%) | 101 (9.2%) |
| Macrocytic normochromic | 37 (5.9%) | 31 (6.7%) | 68 (6.2%) |
| Macrocytic hyperchromic | 13 (2.1%) | 7 (1.5%) | 20 (1.8%) |
| Normocytic normochromic | 234 (37.0%) | 127 (27.3%) | 361 (32.8%) |
| Normocytic hypochromic | 73 (11.5%) | 138 (29.7%) | 211 (19.2%) |
| Normocytic hyperchromic | 200 (31.6%) | 83 (17.9%) | 283 (25.8%) |
| Microcytic hypochromic | 4 (0.6%) | 12 (2.6%) | 16 (1.5%) |
| Microcytic normochromic | 8 (1.2%) | 9 (1.9%) | 17 (1.6%) |
| Microcytic hyperchromic | 17 (2.7%) | 4 (0.8%) | 21 (1.9%) |
MCV, mean corpuscular volume; MCHC, mean corpuscular hemoglobin concentration; NRA, nonregenerative anemia; RA, regenerative anemia.
Calculation of sensitivity and specificity of high MCV and low MCHC to detect RA disclosed a sensitivity of 19.5% (95% CI, 15.0–24.7%) and specificity of 90.7% (95% CI, 87.8–93.1%). The sensitivity of normocytic normochromic samples to detect NRA was 36.9% (95% CI, 33.2–40.8%) and specificity was 72.7% (95% CI, 68.4–76.7%).
When the frequency of increased SC was investigated, 11,693/30,503 (38.4%) of the total study population were determined as having SC > 1.6 mg/dL. The nonanemic group had an increase in SC in 11,121/29,405 (37.8%) samples. In the anemic group 572/1,098 (52.1%) of samples, in the NRA group 375/633 (59.2%) of samples, and in the RA group 197/465 (42.4%) of samples had SC > 1.6 mg/dL (Fig 1). The proportion of samples with increased SC was higher in the anemic compared to the nonanemic group and in the NRA compared to the RA group (Fisher's exact test, P < .0001 for both). There was no linear correlation between SC and Ht, RBC or Hb. Spearman's rank correlation coefficients for SC and Ht in the anemic, NRA, and RA groups were 0.16, 0.12, and 0.16, respectively. For SC and RBC, correlation coefficients for the anemic, NRA, and RA groups were 0.26, 0.20, and 0.27, respectively. Correlation coefficients for SC and Hb in the anemic, NRA and RA groups were 0.25, 0.21, and 0.23, respectively.
Discussion
The frequency of anemia in this large population of 30,503 blood samples from cats obtained between 2003 and 2011 was 3.6%. If the anemic samples without reticulocyte results (n = 139) were included, frequency would have been 4.0% (1,237/30,642). More than half of the anemic samples were classified as NRA. The anemia was more severe in the RA than in the NRA group. Normocytic normochromic anemia was seen most frequently in NRA and normocytic hypochromic anemia most often in RA samples. The erythrocyte indices MCV and MCHC were insensitive for the diagnosis of RA. An increased SC was seen more frequently in the anemic and NRA groups.
To the authors' knowledge, there are no similar studies examining the frequency of anemia in such a large study population. A previous report investigating the prevalence of anemia at a referral clinic found that 10% of cats were anemic with Hb < 10 g/dL, and 7% of these had a Hb < 8 g/dL and were classified as profoundly anemic.3 This figure is almost twice as high as that found in this study but there is no information about the number of cats included in the previous study nor was their regeneration status described.
Regarding the methodology of this study and previous reports, different reference intervals, cutoffs and parameters for defining anemia have been used so that the results are not entirely comparable. For example, other studies have defined anemia in cats using Ht values of <25–30%.4, 10, 11, 13, 14, 17, 18, 19, 20, 22, 25
According to the veterinary literature, Ht is the parameter most commonly used for establishing anemia. However, Hb seems to be the analyte most resistant to preanalytical variability.3, 26 Some authors therefore consider Hb as a better indicator for diagnosing anemia than Ht,3, 26 and Hb is used most frequently in studies of humans, followed by Ht.26 To minimize the effects of preanalytical factors, all 3 variables (Ht, RBC and Hb) were combined to define anemia in this study. The combination of all 3 variables is more conservative than using 1 parameter alone so that the number of anemic cats detected in this study is lower than when just using 1 parameter.
In our study, more than half (57%) of the anemic samples were classified as NRA. In a recent study including 180 anemic cats, 31/88 (35.2%) cats had NRA when using an upper reference limit of 15 × 103/μL for the reticulocyte count and 17/88 (19.3%) were weakly regenerative (reticulocytes, 16–50 × 103/μL).4 This limit of 15 × 103/μL is low and inconsistent with published ranges21, 22 and based on our cutoff of 50 × 103/μL, 54.5% of cats in that study would have had NRA, similar to our findings.
The discrimination between NRA and RA was based on a manual reticulocyte count. In our study, an aggregate reticulocyte was defined as described in the Material and Methods section. According to the older literature, an aggregate reticulocyte is defined as an RBC containing ≥1 aggregates of reticulum5, 27 whereas in a recent publication aggregate reticulocytes are defined as having more than 15 “dots” or as RBC having ≥1 aggregates of “dots.”28 The authors could not find a precise description or definition of an aggregate of reticulum and our definition was based on the fact that <3 granules cannot form an aggregate. Punctate reticulocyte is defined as having 2–6 small granules of reticulum,5, 27 and therefore an RBC containing >6 granules was defined as an aggregate reticulocyte. It can be difficult to accurately discriminate punctate from aggregate reticulocytes by manual methods in cats.5, 27 The interlaboratory coefficient of variation (CV) of manually determined reticulocyte counts in humans has been reported to be 25.1–48.0% in samples with mean reticulocyte counts ranging from 7.0 to 43.3%.5 Similar results have been obtained for dogs with a CV range from 8.0 to 23.0%, with mean reticulocyte counts from 1.1 to 23.2%.29 No reports for cats were found in the literature, but results for people and dogs are in accordance with our laboratory CV for manual counting of feline aggregate reticulocytes, which is 40.3% for a reticulocyte count of 1.5 and 12.5% for a reticulocyte count of 7.0% (unpublished data). This high imprecision and lack of a standard definition of an aggregate reticulocyte must be kept in mind when interpreting data from different studies.
In this study, more severe anemia was found in the RA than in the NRA group. Because of the retrospective nature of this study, limited clinical information and incomplete laboratory results, no attempt to further determine the cause of anemia was made.
Our study clearly demonstrated that erythrocyte morphology based on indices cannot be used to predict the degree of regeneration because there was a large discrepancy between expected regeneration status based on erythrocyte indices and the reticulocyte count.
Nonregenerative anemia usually is described as being normocytic normochromic.1, 6, 22 The normocytic normochromic morphology was the predominant classification in the NRA group (Table 2), but the poor sensitivity and specificity confirmed the unreliability of erythrocyte indices to detect NRA. Interestingly, there were even a small proportion of samples with macrocytic hypochromic morphology in the NRA group, although this morphology typically is associated with RA.
The same discrepancy between erythrocyte indices and regeneration status also applied to the RA group. A macrocytic hypochromic morphology which is commonly associated with regeneration1, 2, 3, 6, 9 was present in only 11.6% of samples in the RA group. Macrocytic normochromic morphology is also sometimes observed in RA.30 Adding these samples to the macrocytic hypochromic samples in the anemic group (together 18.3%), does not result in much improvement.
The sensitivity of a high MCV and low MCHC for the diagnosis of RA in feline blood samples in this study was poor, but specificity was good. Comparable results were obtained in a previous study of dogs (sensitivity 11%, specificity 98%).31 In that study, 32.5% of dogs had regenerative anemia, only 11.8% of which had macrocytic hypochromic anemia.31 A morphological classification therefore is not a replacement for a reticulocyte count when establishing the regenerative state of anemia in cats.
One unexpected finding was the high proportion of anemic samples with hyperchromic erythrocytes (29.5%). Hyperchromic changes usually indicate an erroneous result that could be because of hemolysis, the presence of Heinz bodies, spectral interferences from lipemia or icterus in the Hb assay and erythrocyte shrinkage because of under‐filled tubes (most likely here).6, 30 Samples with recorded hemolysis, lipemia, or icterus were excluded from the study population, but because the change in plasma color is only visible in the centrifuged sample, a hemolytic, lipemic, or icteric whole blood sample could not be entirely ruled out. Some changes in plasma color may not have been reported. It was not possible to assess the number of samples with Heinz bodies in this retrospective study.
An increased SC was present in a higher proportion of the anemic samples compared to the total population and the nonanemic samples. SC is commonly used as a marker of kidney disease20 but also can be increased because of prerenal and postrenal causes.19, 20 Because information about hydration status, disease duration, blood urea concentration, and urinalysis including specific gravity and sediment were not available;17, 18 no conclusions regarding the specificity of an increased SC as an indicator of renal disease can be drawn here.
This study has several limitations. It was retrospective and no clinical data or patient history could be obtained, including important information about the duration of the anemia or reasons for sampling. This could have an impact on the classification of the regeneration and the differences in severity of anemia in the different groups. Blood loss and hemolytic anemias initially are nonregenerative,2, 22 and the proportion of true NRA could have been overestimated in this sample population. Because the lower reference interval was used as the cutoff for anemia, 2.5% healthy cats may have been falsely included.
Some samples with pathological hemolysis may have been excluded with the hemolytic samples. Including these samples were not possible, but could potentially have increased the frequency of anemia as well as the proportion of hyperchromic samples.
Other pre‐analytical conditions such as RBC swelling because of storage and RBC shrinkage because of anticoagulant excess may have had an influence on 1 criterion more than another. Underfilled tubes may cause erythrocyte shrinkage that can result in decreased Ht and increased MCHC when the sample is measured using a laser hematology analyzer.32 This artifact may not occur using the impedance method because the diluent suspends the erythrocytes before impedance counting. They quickly regain volume and thus the calculated Ht may be unaffected.33 Aging of the blood samples may cause RBC swelling, which results in falsely increased MCV values and consequently an increase in Ht. This has been found to significantly impact results after 48 hours of storage at room temperature and 4°C (n = 5; room temperature and 4°C; P < .005).34 In an evaluation done in the authors' laboratory in 2011, 70% of submitted blood samples were <24 hours old (unpublished data).
A further limitation of this study is that not all causes of anemia were considered and no further classification other than NRA and RA was attempted.
In conclusion, the large number of samples used in this study was submitted from different first opinion veterinary practitioners in eastern Austria. To the best of our knowledge, this is the first study that evaluates blood samples from such a large population of cats. Overall, 3.6% of feline blood samples submitted to a private laboratory exhibited anemia, and the majority of these were NRA. Regeneration status must be determined by a reticulocyte count because erythrocyte morphology and the erythrocyte indices MCV and MCHC are not reliable criteria for differentiation of RA from NRA in cats, similar to what is observed in dogs. SC was more often increased in the anemic compared to the nonanemic group and in the NRA compared to RA group, but SC was not correlated with the degree of anemia. These findings could be explored further in future studies in animal populations with clinically diagnosed renal disease.
Acknowledgment
The authors thank Prof. Ilse Schwendenwein (University of Veterinary Medicine, Vienna, Austria) for her advice and Werner Baurecht (Biometrics, acromion GmbH) for statistical analysis. The study was supported by Bayer Animal Health GmbH (Germany).
Conflict of Interest Declaration: Andreas Moritz, Ernst Leidinger, and Natali Bauer are consultants for Bayer Animal Health GmbH Germany. Gerald Beddies is employed by Bayer Animal Health GmbH Germany. The authors declare that there are no conflicts of interest with respect to the research, authorship, or publication of this article.
Footnotes
Hagiwara M. Anemia in cats: Is it Mycoplasma? Proceedings 34th WSAVA, Sao Paulo 2008;7pp. Available at: http://www.vin.com/proceedings/Proceedings.plx?CID=WSAVA2009. Accessed May 23, 2012
Merten N, Warnholz S, Weingart C, Kohn B. Differenzialdiagnosen von Anämie bei der Katze: 194 Fälle (2009–2011). Kleintierpraxis 2012;11:617 (German)
Cell‐Dyn 3500; Abbott, Austria
Brilliant cresyl blue; Merck GmbH, Germany
Siemens, Austria
SAS statistical software; version 9.3 SAS Institute, Cary, NC
References
- 1. White C, Nyssa R. Feline nonregenerative anemia: Pathophysiology and etiologies. Compend Contin Educ Pract Vet;31:E1–E7. Available at: http://www.compendiumVet.com/2009/June. Accessed December 8, 2011. [PubMed] [Google Scholar]
- 2. Ramsey I, Gould S. Feline anaemia 1. Clinical signs and investigation. In Pract 1999;21:411–415. [Google Scholar]
- 3. Evans R, Gruffydd JT. Anemia in Cats. In Pract 1984;6:168–178. [DOI] [PubMed] [Google Scholar]
- 4. Korman RM, Hetzel N, Knowles TG, et al. A retrospective study of 180 anemic cats: Features, aetiologies and survival data. J Feline Med Surg 2013;15:81–90. [DOI] [PMC free article] [PubMed] [Google Scholar]
- 5. Reagan JW, Vap LM, Weiser MG. Flow cytometric analysis of feline reticulocytes. Vet Pathol 1992;29:503–508. [DOI] [PubMed] [Google Scholar]
- 6. Tvedten H. Laboratory and clinical diagnosis of anemia In: Weiss JD, Wardrop JK, eds. Schalm′s Veterinary Hematology. Iowa: Blackwell; 2010:152–161. [Google Scholar]
- 7. Weiss DJ. Bone marrow pathology in dogs and cats with non‐regenerative immune‐mediated haemolytic anaemia and pure red cell aplasia. J Comp Pathol 2008;138:46–53. [DOI] [PubMed] [Google Scholar]
- 8. Chalhoub S, Langston C, Eatroff A. Anemia of renal disease. J Feline Med Surg 2011;13:629–640. [DOI] [PMC free article] [PubMed] [Google Scholar]
- 9. Ramsey I, Gould S. Feline anaemia 2. Differential diagnosis. In Pract 1999;21:507–517. [Google Scholar]
- 10. Ottenjan M, Weingart C, Arndt G, Kohn B. Characterization of the anemia of inflammatory disease in cats with abscesses, pyothorax, or fat necrosis. J Vet Intern Med 2006;20:1143–1150. [DOI] [PubMed] [Google Scholar]
- 11. Stützer B, Müller F, Mojzoub M, et al. Role of latent feline leukemia virus infection in nonregenerative cytopenias of cats. J Vet Intern Med 2010;24:192–197. [DOI] [PubMed] [Google Scholar]
- 12. Nibblett MD, Snead EC, Waldner C, et al. Anemia in cats with hemotropic mycoplasma infection: Retrospective evaluation of 23 cases (1996–2005). Can Vet J 2009;50:1181–1185. [PMC free article] [PubMed] [Google Scholar]
- 13. Wilson HE, Jasani S, Wagner TB, et al. Signs of left heart volume overload in severely anaemic cats. J Feline Med Surg 2010;12:904–909. [DOI] [PMC free article] [PubMed] [Google Scholar]
- 14. Castellanos I, Couto CG, Gray TL. Clinical use of blood products in cats: A retrospective study (1997–2000). J Vet Intern Med 2004;18:529–523. [DOI] [PubMed] [Google Scholar]
- 15. Klaser DA, Reine NJ, Hohenhaus AE. Red blood cell transfusion in cats: 126 cases (1999). J Am Vet Med Assoc 2005;226:920–923. [DOI] [PubMed] [Google Scholar]
- 16. Cowgill LD, James KM, Levy JK, et al. Use of recombinant human erythropoietin for management of anemia in dogs and cats with renal failure. J Am Vet Med Assoc 1998;212:521–528. [PubMed] [Google Scholar]
- 17. Lulich JP, Osborne CA, O′Brien TD, Polzin DJ. Feline renal failure: Questions, answers, questions. Compend Contin Educ Pract Vet 1992;14:127–152. [Google Scholar]
- 18. DiBartola SP, Rutgers HC, Zack PM, Tarr MJ. Clinicopathologic findings associated with chronic renal disease in cats: 74 cases (1973–1984). J Am Vet Med Assoc 1987;190:1196–1202. [PubMed] [Google Scholar]
- 19. Elliot J, Barber PJ. Feline chronic renal failure: Clinical findings in 80 cases diagnosed between 1992 and 1995. J Small Anim Pract 1998;39:78–85. [DOI] [PubMed] [Google Scholar]
- 20. Chakrabarti S, Syme S, Elliott J. Clinicopathological variables predicting progression of azotemia in cats with chronic kidney disease. J Vet Intern Med 2012;26:275–281. [DOI] [PubMed] [Google Scholar]
- 21. White C, Nyssa R. Feline nonregenerative anemia: Diagnosis and treatment. Compend Contin Educ Pract Vet;31:E1–E12. Available at: http://www.compendiumVet.com/2009/June. Accessed December 8, 2011. [PubMed] [Google Scholar]
- 22. Tasker S. Diagnostic approach to anemia in cats. In Pract 2012;34:370–381. [Google Scholar]
- 23. Plotnick A. Feline chronic renal failure: Long‐term medical management. Compend Contin Educ Pract Vet 2007;29:1–10. [PubMed] [Google Scholar]
- 24. International Renal Interest Society [Internet] . Available at: http://www.iris-kidney.com. Accessed July 9, 2012.
- 25. Boyd LM, Langston C, Thompson K, et al. Survival in cats with naturally occurring chronic kidney disease (2000–2002). J Vet Intern Med 2008;22:1111–1117. [DOI] [PubMed] [Google Scholar]
- 26. Torrance A. Overview of haematological diagnostic techniques In: Day M, Mackin A, Littewood J, eds. BSAVA Manual of Canine and Feline Haematology and Transfusion Medicine, 1st ed Gloucester: British Small Animal Veterinary Association; 2000:3–17. [Google Scholar]
- 27. Stockham SL, Scott MA. Erythrocytes In: Stockham SL, Scott MA, eds. Fundamentals of Veterinary Clinical Pathology. Iowa: Blackwell; 2008:117. [Google Scholar]
- 28. Tvedten H, Moritz A. Reticulocyte and Heinz body staining and enumeration In: Weiss JD, Wardrop JK, eds. Schalm′s Veterinary Hematology. Iowa: Blackwell; 2010:1067–1073. [Google Scholar]
- 29. Abbott DL, McGrat JP. Evaluation of flow cytometric counting procedure for canine reticulocytes by use of thiazole orange. Am J Vet Res 1991;52:723–727. [PubMed] [Google Scholar]
- 30. Stockham SL, Scott MA. Erythrocytes In: Stockham SL, Scott MA, eds. Fundamentals of Veterinary Clinical Pathology. Iowa: Blackwell; 2008:154–158. [Google Scholar]
- 31. Hodges J, Christopher MM. Diagnostic accuracy of using erythrocyte indices and polychromasia to identify regenerative anemia in dogs. J Am Vet Med Assoc 2011;238:1452–1458. [DOI] [PubMed] [Google Scholar]
- 32. Nemec A, Drobnic‐Kosorok M, Butinar J. The effect of high anticoagulant K3‐EDTA concentration on CBC and WBC differential counts in healthy beagle dogs. Slo Vet Res 2005;42:65–70. [Google Scholar]
- 33. Stockham SL, Scott MA. Erythrocytes In: Stockham SL, Scott MA, eds. Fundamentals of Veterinary Clinical Pathology. Iowa: Blackwell; 2008:130. [Google Scholar]
- 34. Neuerer FF. Evaluation des Vollautomatischem Hämatologiegerätes Cell‐Dyn 3500 im klinischem Einsatz bei Hund und Katze (Dissertation). München:Ludwig‐Maximilian‐Universität Tierärztliche Fakultät; 2005. (German) [Google Scholar]