Abstract
MicroRNAs (miRNAs) are small non-coding RNAs that are known to control mRNA translation. Most miRNAs are transcribed from specific genes with well-defined promoters located throughout the genome. The mechanisms that control miRNA expression under normal and pathological conditions are not yet understood clearly. Peroxisome proliferator activated receptor (PPAR) γ is a ligand-activated transcription factor that is extensively distributed in the CNS. PPARγ activation induces neuroprotection by modulating genes that contain peroxisome proliferator response elements (PPREs) in their promoters. We presently evaluated if PPARγ modulates miRNA expression. When adult rats were treated with PPARγ agonist rosiglitazone, expression of 28 miRNAs altered significantly (12 up- and 16 down-regulated; 3 to 119 fold) in the cerebral cortex compared to vehicle-treated controls. In silico analysis showed 1 to 5 PPREs in the putative promoter regions (within 1 Kb upstream of the transcription start site) of these miRNA genes. Cotransfection with a PPARγ constitutively expressing vector significantly induced the miR-145 and miR-329 promoter vectors (each have 4 PPREs) which was curtailed by point mutations of PPREs in their promoters. Interestingly, the PPARγ promoter has binding sites for both these miRNAs and transfection with miR-329 mimic and miR-145 mimic induced the PPARγ expression. Thus, these studies show a cyclical induction of miRNAs and PPARγ indicating that the pleiotropic beneficial effects of PPARγ agonists might be modulated in part by miRNAs and their down-stream mRNAs.
Keywords: miRNA, Non-coding RNA, PPAR, Transcription factor, Promoters, Gene induction
As they control transcription and translation, both transcription factors and microRNAs (miRNAs) are considered as the master regulators of cell metabolism. Any perturbation in their function is known to precipitate significant pathologies and hence they offer therapeutic opportunities for various disorders. However, the mechanistic implications of altering a transcription factor or a miRNA need to be considered carefully as their down-stream effects are multifold. Furthermore, their mutual interaction might be essential for the equilibrium of the cellular microenvironment. Peroxisome proliferator-activated receptor-gamma (PPARγ) is a ligand-activated transcription factor that is known to control lipid and glucose metabolism in mammals (Eldor et al. 2013). PPARγ activation was also shown to prevent inflammation and neuronal death following acute and chronic insults to CNS (Kapadia et al. 2008, Racke & Drew 2008, Zhao et al. 2015). Upon ligand binding, PPARs dimerize with retinoid-X-receptors and binds to PPAR binding sites (peroxisome proliferator response elements; PPREs) on DNA to induce or repress the transcription of target genes (Escher & Wahli 2000). While many protein-coding genes were shown to mediate the down-stream effects of PPAR, its pleiotropic beneficial effects might extend beyond them. We currently evaluated the mutual induction of PPARγ and miRNAs.
MATERIALS AND METHODS
Animals
Adult, male Sprague-Dawley rats (280-320 g; Charles River, Wilmington, MA, USA) used in this study were cared for in accordance with the Guide for the Care and Use of Laboratory Animals, US Department of Health and Human Services Publication number 86-23 (revised 1986). The Research Animal Resources and Care Committee of the University of Wisconsin-Madison approved all the surgical procedures. Rosiglitazone potassium salt (Cayman Chemicals USA) was dissolved in dimethylsulfoxide (DMSO) and then diluted with phosphate-buffered saline (pH 7.2) to obtain a final DMSO concentration of 3%. Rats were injected either rosiglitazone or vehicle (3% DMSO) at 0h and 12h (i.p.; 2 mg/Kg in 300 μl; n = 6/group) and euthanized at 24h. Total RNA was extracted from the cerebral cortex of each rat using the mirVana miRNA Isolation Kit (Ambion, Austin, TX) as per the manufacturer's protocol.
Microarrays
The miRNA profiling was conducted as described earlier (Dharap et al. 2009, Dharap & Vemuganti 2010) using microarrays from LC Sciences (Houston, TX) that contained probes (12 repeats/probe) for all known rat miRNAs from the Sanger miRBase (http://microrna.sanger.ac.uk/sequences/). The miRNA hybridization data was corrected by subtracting the background (calculated from the median of 5% to 25% of the lowest-intensity cells) and normalized to the statistical median of all detectable transcripts using the locally-weighted regression (LOWESS) method which balances the intensities of Cy5 labeled transcripts so that the differential expression ratios can be properly calculated (Bolstad et al. 2003). For subtracting, the background was defined on each array as the average signal of the BKG0 spots (chemical linkers without the probes). The hybridization intensities above exp(5) (~150) were considered as significant as described earlier (Vagin et al. 2006) and established with titration of several synthetic 20-nt RNA oligos (external controls) spiked into each sample. In addition, on each array there were 16 sets of spatially distributed internal control probes. These include PUC2PM-20B and PUC2MM-20B which are the perfect match and the single-base mismatch sequences, respectively. The stringency of the intensity ratio of the PUC2PM-20B and PUC2MM-20B is expected to be larger than 30 indicating proper hybridization in each case. For proper analysis of signal intensities on each chip, both the internal controls and the test miRNA probes were repeated 12 times. On a microarray, the hybridization signal was linearly obtained from 1 to ~66,000 units. A miRNA transcript was considered detectable if it met the following criteria. (a) Signal intensity higher than 3 times the maximal background signal, (b) spot CV <0.5 (CV was calculated as (standard deviation)/(signal intensity)) and (c) the signals from at least 50% of the 12 redundant repeating probes are above the detection level. To avoid false positives, any spot that deviated >50% from the average value of the 12 repeating spots and/or spots with CV >0.5 were eliminated. The data from different groups was normalized and analyzed statistically using ANOVA. To increase the validity of the data, we generated a cross-comparison matrix of 36 comparisons by comparing the data from 12 rats (6 vehicle and 6 rosiglitazone treated). A miRNA transcript was assumed altered if it showed a statistically significant change in at least 30 out of 36 cross-comparisons (83% positive). The standard deviation for each miRNAs profiled was <15% in both groups.
Bioinformatics
For predicting the Kyoto Encyclopedia of Genes and Genomes (KEGG) pathways of mRNAs that are targeted by PPARγ-responsive miRNAs, we used DIANA miRPath algorithm combined with DIANA microT 4.0 and TargetScan5. This strategy predicted the number of mRNA targets for each miRNA using the open-source miRanda algorithm (http://www.microrna.org/miranda.html) (Betel et al. 2008, Papadopoulos et al. 2009, Lewis et al. 2005). Putative miRNA binding sites in the PPARγ promoter were analyzed with RegRNA (http://regrna.mbc.nctu.edu.tw) algorithm with a very high stringency (an energy threshold of −20.0 kcal/mol and a score threshold of 150) by modifying the search target to scan promoter sequence instead of mRNA sequences as described earlier (Dharap et al. 2009, Place et al. 2008). For this analysis, promoter sequence (1 Kb in front of transcription start site for protein-coding genes and 1 Kb of the 5’ flanking sequence of miRNA genes) was retrieved from Ensembl database. For In silico analysis of the PPAR binding sites the promoter sequences (1 KB upstream of the transcription start site; TSS) for rat miRNAs were retrieved from the UCSC Genome Browser and analyzed using MatInspector (Genomatix Software GmbH). MatInspector utilizes a large library of matrix descriptions for transcription factor binding sites to locate matches in DNA sequences and assigns a quality rating to matches, thus allowing quality-based filtering and selection of matches. Those PPAR sites that met the “good match” score minimum cut-off (matrix similarity > 0.80; (Cartharius et al. 2005) were accepted.
Plasmids
Promoter plasmids were custom designed by Seqwright Inc USA. The miR-145, miR-329 and PPARγ promoter sequences were retrieved from the UCSC Genome Browser and the rat (rn4) genome assembly was used for sequence comparison, alignment, and primer design. The promoter sequences were amplified from the rat gDNA using specific primers and cloned into the mammalian promoter-less pGL3-Basic expression vector (Promega USA) to generate wildtype plasmids. Cloning primers used for the miR-145 were 5’-ATA TCT CGA GGG AGA GAG ATG CCT TCA GCA-3’ and 5’-ATT TAT AAG CTT GGA ATC CTT CTC AAC ACT GAA TAT CTA C-3’ and for miR-329 were 5’-ATA TCT CGA GGC CAG TGT CCC GGT CTC CCT ACT GC-3’ and 5’-ATA AAT AAG CTT CTG ACA AGA CTA CCT CGG AAC TTC CCC AAC GTG-3’. The sequence and orientation of the promoters was confirmed by restriction enzyme digestion and automated DNA sequencing. To generate mutant plasmids, site-directed mutagenesis was performed to generate point mutations in all four PPREs on the miR-145 and miR-329 promoters, and in the miR-145 and miR-329 target sites in the PPARγ promoter. Four base pairs were mutated on each PPRE to increase the robustness of the mutants. The mutations were confirmed by automated DNA sequencing.
In vitro experiments
PC12 adherent cells [American Type Culture Collection (ATCC)] were cultured as described earlier (Pandi et al. 2013). In brief, cells were maintained in high glucose DMEM medium (GIBCO USA) containing 4.5 g/L glucose, L-glutamine and 110 mg/mL sodium pyruvate supplemented with 10% inactivated horse serum. Cells were cultured at 37°C with 5% CO2. For promoter vector activation experiments, cells were plated at a density of 1×10⁵ cells/well. The cell viability was analyzed by Trypan Blue exclusion assay. To study the effect of PPARγ on miRNA promoters, PC12 cells were treated with 2.5 μM rosiglitazone or vehicle (1:3 DMSO:PBS) for 6h and then transfected with the miRNA promoter vectors and a constitutively expressing PPARγ expression vector (pExpress-1 vector; Open Biosystems, Huntville, AL, USA) together with Lipofectamine 2000 transfection agent (Invitrogen USA). Each plasmid was transfected at a concentration of 200 ng together with 100 ng Renilla luciferase plasmid (transfection control). A second dose of 2.5 μM rosiglitazone or vehicle was administered at 24h post-transfection. Two days after transfection, cells were lysed and subjected to a dual luciferase assay (Promega USA). To study the effect of miRNAs on PPARγ expression, 400 ng of PPARγ promoter vector, 20 ng of Renilla luciferase vector were cotransfected in PC12 cells together with 150 nM miR-145 mimic or miR-329 mimic or both or a control miR mimic using Lipofectamine 2000 transfection agent. Two days after the transfections, luciferase activity was determined. To understand if miRNA-mediated induction of PPARγ promoter is RISC-complex mediated, PC12 cells were treated with Ago2 siRNA (100 nM) together with miR-145 mimic or miR-329 mimic (150 nM of a mimic was transfected on day 1 and day 3) and then the endogenous PPARγ mRNA expression was estimated at 4 days by real-time PCR.
RESULTS
PPARγ activation altered cerebral miRNAome
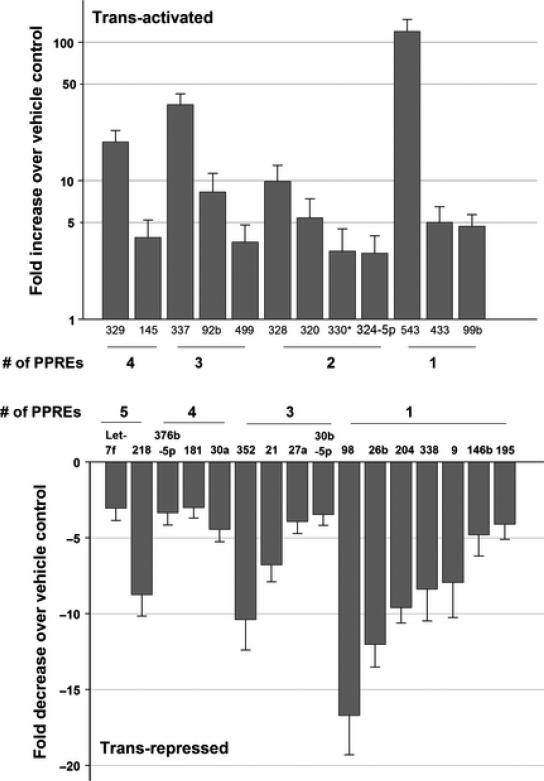
By one day after rosiglitazone administration, 32 of the 265 miRNAs analyzed were altered >3-fold (14 activated and 18 repressed) compared to vehicle control in the cerebral cortex (Fig. 1). The miR-543 showed maximal induction of 119 fold and miR-98 showed a maximal repression of 17 fold in the rosiglitazone group over vehicle group (Fig. 1).
Fig. 1.
The miRNAs induced (top) and repressed (bottom) in the cerebral cortex following PPARγ activation. The bars represent mean fold changes in rosiglitazone group over vehicle group (n = 6/group). The # of PPREs in the promoters of each miRNA was indicated in the bottom. The promoter data is not available for 2 miRNAs activated (miR-23a-5p and miR-96) and 2 miRNAs suppressed (miR-137 and miR-29b) by rosiglitazone treatment and hence these miRNAs are not shown in the figure.
PPARγ induced the expression of PPRE-containing miRNA promoters
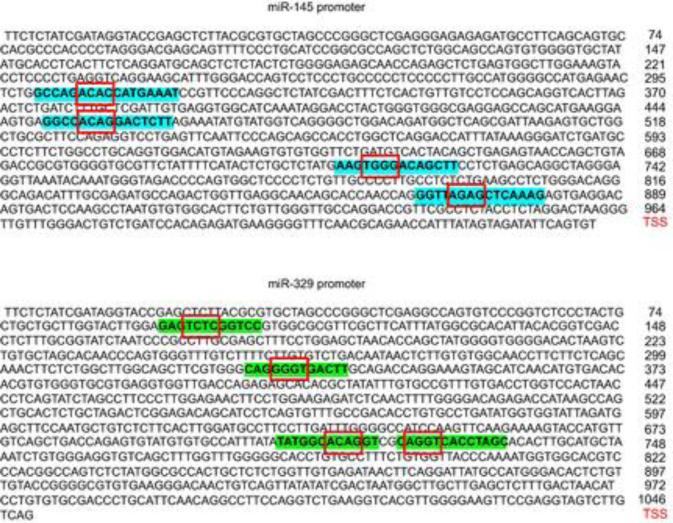
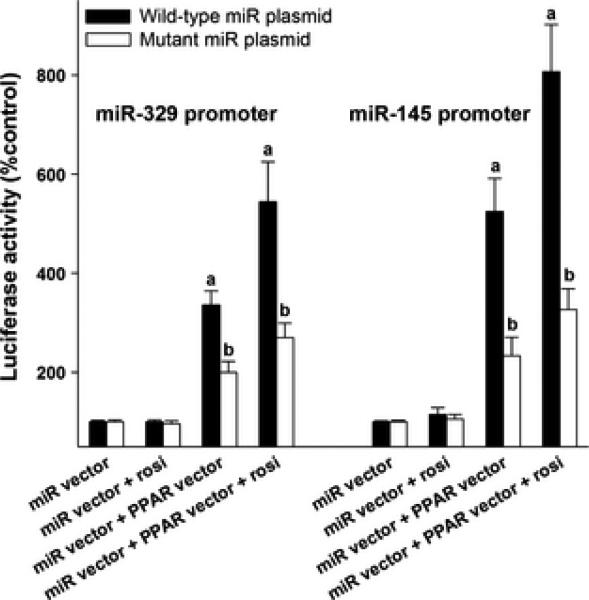
In silico analysis showed that promoters of 88% (28 of 32) miRNAs altered after rosiglitazone treatment contain 1 to 5 PPREs (PPAR binding sites) within 1 kb upstream to the respective transcription start site (Fig. 1). 50% of them (14 of 28 miRNAs) contain >3 PPREs in their promoters (Fig. 1). To identify if the PPREs in the miRNA promoters are functional, we cloned miR-145 and miR-329 promoters in an inducible reporter system upstream to firefly luciferase gene. Each of these miRNA promoters contain 4 PPREs (Fig. 2). When PC12 cells transfected with miR-145 or miR-293 promoter vectors were treated with rosiglitazone, there was no induction of either of the promoters (Fig. 3). Whereas, if co-transfected with a PPARγ expressing vector (without treatment with rosiglitazone) both miR-145 and miR-329 promoters showed significant induction over control (by 336% to 522%; p<0.05) (Fig. 3). When the miRNA promoters were cotransfected together with PPARγ expressing vector and then treated with rosiglitazone, there was a much higher induction of both miR-145 and miR-329 promoters over control (by 533% to 810%; p<0.05) (Fig. 3). The induction of miR-145 and miR-329 promoters by PPARγ alone or PPARγ + rosiglitazone was curtailed when the PPREs are mutated in the vectors (Fig. 3).
Fig. 2.
Graphical representation of PPREs in the promoters of miR-145 and miR-329. The highlighted sequences shows the PPREs and the boxes shows the sequences that were mutated in the mutant vectors. The locations of the PPREs upstream of the TSS are nucleotides −171 to −193, −319 to −341, −587 to −609 and −738 to −760 in the miR-145 promoter and nucleotides −319 to −341, −326 to −348, −710 to −732 and −945 to −967 in the miR-329 promoter.
Fig. 3.
Induction of miR-145 and miR-329 expression by PPARγ. In both cases, the PPREs are present within 1 KB from the TSS. Cells were cotransfected with a PPARγ expressing vector together with miR-145 or miR-239 promoter vectors. Mutated vectors (all 4 PPREs mutated) served as control for each miR vector. Values are mean ± SD of n =4/group. Each transfection was carried out in triplicate. *p<0.05 compared to miR vector alone group in each case by ANOVA with Tucky's multiple comparisons post-test.
Convergent functional pathways downstream of PPARγ-responsive miRNAs
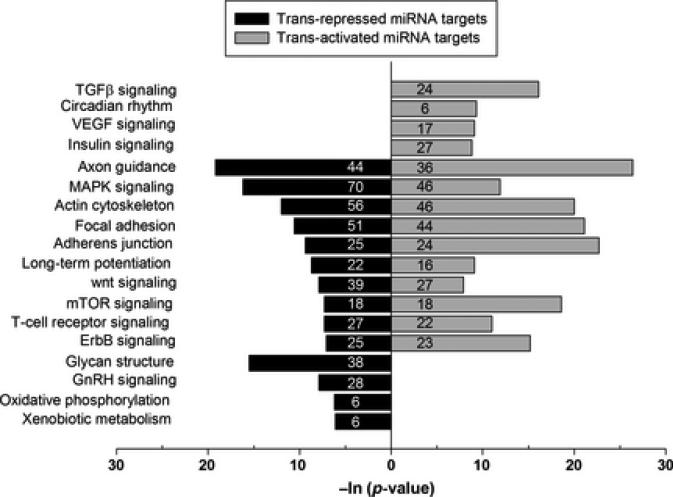
Biological pathways rather than individual genes/proteins are the major functional units that control physiological and pathological outcomes. As a miRNA can act on several targets and an mRNA can be targeted by multiple miRNAs, different genes within a pathway can be influenced by combinations of miRNAs that can be integrated into functional pathways. Since PPARγ activation is known to have many beneficial outcomes including prevention of inflammation and oxidative stress, by combining the pathways analysis algorithm mirPath with miRNA target prediction web tools (DIANA microTar 4.0 and TargetScan5), we identified pathways that are common to multiple miRNAs up- or down-regulated by rosiglitazone treatment. Targets of PPAR-responsive miRNAs are associated with many physiologically important pathways that include axon guidance, MAP-kinase signaling, actin cytoskeleton regulation, focal adhesion, adherens junction, long-term potentiation, wnt signaling, mTOR signaling, ErbB signaling, glycan structure and GnRH signaling (Fig. 4).
Fig. 4.
The top KEGG pathways of biological function of the targets of PPARγ-responsive miRNAs in rat brain. We identified the pathways only if an mRNA is a target of at least 4 of the altered miRNAs in each case. The number of mRNAs that are part of a specific KEGG pathway are shown in each bar.
PPARγ-activated miRNAs induce PPARγ
The miRNAs are known to bind to 3’UTRs of mRNAs to prevent their translation. However, recent studies showed that many gene promoters also contain miRNA target sites and binding of miRNAs are known to transactivate the promoters. By using a modified version of the miRanda algorithm that analyzes the miRNA-DNA interactions, we identified that PPARγ promoter (ENSRNOT00000012137; NM_013124) has binding sites for 4 PPARγ-responsive miRNAs (Table 1). Of those, miR-145, miR-329 and miR-328 were induced and miR-181c was suppressed by rosiglitazone-treatment (Table 1). In the PPARγ promoter, miR-145 and miR-329 binding sites are present very close (~100 base pairs upstream) to TSS and located adjacent to each other within a distance of 17 base pairs (Table 1). This indicates a strong possibility of their role in modulation of PPARγ expression.
Table 1.
Binding sites for PPARγ responsive miRNAs in the PPARγ promoter
| miRNA | Binding site | Score | Energy |
|---|---|---|---|
| mir-181 | −527 to −506 | 172 | −21.88 |
| mir-328 | −488 to −468 | 163 | −27.90 |
| mir-145 | −110 to −88 | 151 | −20.91 |
| mir-329 | −70 to −49 | 157 | −25.34 |
The ENSMBL # for PPARγ promoter is ENSRNOT00000012137. The position of the binding site are given upstream of the TSS. The miRNA binding sites were identified using a modified MIRANDA algorithm by searching the rat genomic PPARγ promoter.
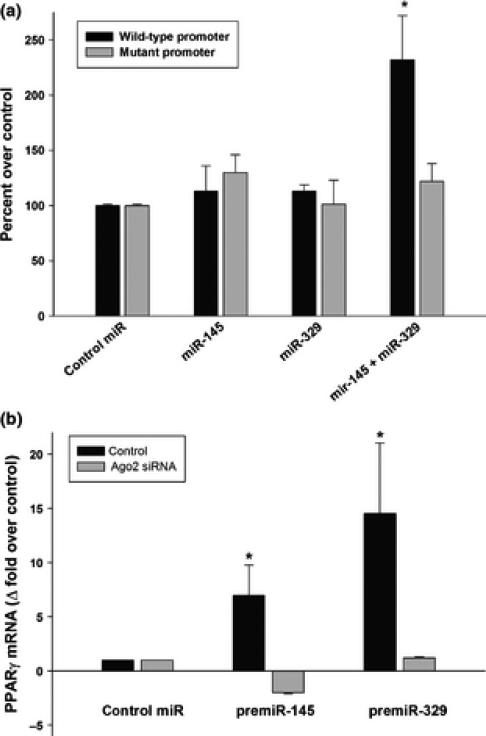
When a PPARγ promoter reporter vector was challenged with a miR-145 mimic or a miR-329 mimic individually, there was no effect on the PPARγ promoter (Fig. 5A). However, when they were used together, there was a robust induction of the PPARγ promoter (~240% compared to control miR treated group; Fig. 5A). Mutating the miRNA target sites in the PPARγ promoter curtailed this induction indicating the specificity of the action of miRNAs (Fig. 5A). To further validate this, we estimated the levels of endogenous PPARγ mRNA in cells transfected with miR-145 mimic or miR-329 mimic. Both mimics significantly increased the endogenous PPARγ mRNA levels (miR-145 mimic by 10.9 fold and miR-329 mimic by 5.5 fold) compared to control miR mimic group (Fig. 5B). The Ago2 protein is known as an essential component for the actions of miRNAs. Treatment with an Ago-2 siRNA completely abolished the induction of PPARγ mRNA by both miR-145 mimic and miR-329 indicating that these are miRNA-specific effects (Fig. 5B).
Fig. 5.
Activation of PPARγ promoter by miR-145 and miR-329. The wild-type PPARγ promoter vector transfected into PC12 cells was challenged with either miR-145 mimic or miR-329 mimic or both. A PPARγ vector in which the miR binding sites were mutated acted as a control (A). Panel B shows that miR-145 mimic and miR-329 mimic induce the mRNA expression of the endogenous PPARγ. Values are mean ± SD of n =4/group. Each transfection was carried out in triplicate. *p<0.05 compared to the control miR mimic treated group in each case by ANOVA with Tucky's multiple comparisons post-test.
DISCUSSION
In brief, present study shows that promoters of many miRNAs contain PPREs and PPARγ activation induces those miRNAs. More importantly, PPARγ gene promoter also contains binding sites for miRNAs induced by PPARγ and some of those miRNAs augment PPARγ gene expression. Furthermore, PPARγ-responsive miRNAs target many mRNAs that constitute the biological pathways that control cellular signaling.
PPARγ is one of the abundantly expressed transcription factors in mammals and its function is essential for controlling sugar and lipid metabolism in the body (Escher & Wahli 2000). The pleiotropic beneficial effects of PPARγ agonists extend beyond the insulin sensitization and many studies showed that PPARγ agonists are neuroprotective in chronic as well as acute neurological insults including Alzheimer's disease, Parkinson Disease, Amyotrophic lateral sclerosis, stroke, traumatic brain injury and spinal cord injury (Tureyen et al. 2007, Park et al. 2007, Vemuganti et al. 1998, Yi et al. 2008, Drew et al. 2006, Carta 2013, Liu et al. 2015). Controlling inflammation, oxidative stress and inducing protein chaperones are thought to mediate PPARγ-induced neuroprotection (Kapadia et al. 2008). The present studies show that PPARγ activation also alters miRNA expression profiles and this will have a much extensive physiological significance as each miRNA can influence dozens of target genes. To understand this further, we conducted pathways analysis using targets of the PPARγ responsive miRNAs as input. Interestingly, many of those target genes are constituents of the second messenger signaling and plasticity-related networks indicating that miRNAs might be responsible in part for propagating the effects of PPARγ activation.
TZDs like rosiglitazone and pioglitazone that are the ligands for PPARγ also induce its expression (Yi et al. 2008). Recent studies showed that miRNAs can induce transcription by binding to consensus sites within the promoters of many genes (Dharap et al. 2009, Place et al. 2008). This phenomenon of miRNA-induced gene expression will have significant impact on cell metabolism if some of those genes are transcription factors like PPARs. With bioinformatics and experimental validation, we show that 2 PPARγ-responsive miRNAs (miR-145 and miR-329) are potent inducers of PPARγ expression. Thus, there can be a cyclical potentiation of the down-stream actions of PPARγ as the miRNAs are induced by PPARγ and they in turn induce more PPARγ expression. This indicates a novel feed-forward and feed-back loop in which the miRNAs and PPARγ potentiate each other. Our studies thus highlight that the master controllers (transcription factors and miRNAs) influence each other mutually and hence their manipulation in various pathologies needs to be considered carefully to understand the impact on the physiological outcome.
Acknowledgments
These studies were funded by Supported by grants from NIH (NS079585) and AHA (09PPE2300220).
Abbreviations used
- DMSO
dimethylsulfoxide
- KEGG
Kyoto Encyclopedia of Genes and Genomes
- miRNA
microRNA
- PPAR
peroxisome proliferator activated receptor
- PPRE
peroxisome proliferator response element
- TSS
transcription start site
REFERENCES
- Betel D, Wilson M, Gabow A, Marks DS, Sander C. The microRNA.org resource: targets and expression. Nucleic Acids Res. 2008;36:D149–153. doi: 10.1093/nar/gkm995. [DOI] [PMC free article] [PubMed] [Google Scholar]
- Bolstad BM, Irizarry RA, Astrand M, Speed TP. A comparison of normalization methods for high density oligonucleotide array data based on variance and bias. Bioinformatics. 2003;19:185–193. doi: 10.1093/bioinformatics/19.2.185. [DOI] [PubMed] [Google Scholar]
- Carta AR. PPAR-gamma: therapeutic prospects in Parkinson's disease. Curr Drug Targets. 2013;14:743–751. doi: 10.2174/1389450111314070004. [DOI] [PubMed] [Google Scholar]
- Cartharius K, Frech K, Grote K, Klocke B, Haltmeier M, Klingenhoff A, Frisch M, Bayerlein M, Werner T. MatInspector and beyond: promoter analysis based on transcription factor binding sites. Bioinformatics. 2005;21:2933–2942. doi: 10.1093/bioinformatics/bti473. [DOI] [PubMed] [Google Scholar]
- Dharap A, Bowen K, Place R, Li LC, Vemuganti R. Transient focal ischemia induces extensive temporal changes in rat cerebral microRNAome. J Cereb Blood Flow Metab. 2009;29:675–687. doi: 10.1038/jcbfm.2008.157. [DOI] [PMC free article] [PubMed] [Google Scholar]
- Dharap A, Vemuganti R. Ischemic pre-conditioning alters cerebral microRNAs that are upstream to neuroprotective signaling pathways. J Neurochem. 2010;113:1685–1691. doi: 10.1111/j.1471-4159.2010.06735.x. [DOI] [PMC free article] [PubMed] [Google Scholar]
- Drew PD, Xu J, Storer PD, Chavis JA, Racke MK. Peroxisome proliferator-activated receptor agonist regulation of glial activation: relevance to CNS inflammatory disorders. Neurochem Int. 2006;49:183–189. doi: 10.1016/j.neuint.2006.04.003. [DOI] [PubMed] [Google Scholar]
- Eldor R, DeFronzo RA, Abdul-Ghani M. In vivo actions of peroxisome proliferator-activated receptors: glycemic control, insulin sensitivity, and insulin secretion. Diabetes Care. 2013;36(Suppl 2):S162–174. doi: 10.2337/dcS13-2003. [DOI] [PMC free article] [PubMed] [Google Scholar]
- Escher P, Wahli W. Peroxisome proliferator-activated receptors: insight into multiple cellular functions. Mutat Res. 2000;448:121–138. doi: 10.1016/s0027-5107(99)00231-6. [DOI] [PubMed] [Google Scholar]
- Kapadia R, Yi JH, Vemuganti R. Mechanisms of anti-inflammatory and neuroprotective actions of PPAR-gamma agonists. Frontiers in bioscience : a journal and virtual library. 2008;13:1813–1826. doi: 10.2741/2802. [DOI] [PMC free article] [PubMed] [Google Scholar]
- Lewis BP, Burge CB, Bartel DP. Conserved seed pairing, often flanked by adenosines, indicates that thousands of human genes are microRNA targets. Cell. 2005;120:15–20. doi: 10.1016/j.cell.2004.12.035. [DOI] [PubMed] [Google Scholar]
- Liu J, Wang LN, Jia JP. Peroxisome proliferator-activated receptor-gamma agonists for Alzheimer's disease and amnestic mild cognitive impairment: a systematic review and meta-analysis. Drugs & aging. 2015;32:57–65. doi: 10.1007/s40266-014-0228-7. [DOI] [PubMed] [Google Scholar]
- Pandi G, Nakka VP, Dharap A, Roopra A, Vemuganti R. MicroRNA miR-29c down-regulation leading to de-repression of its target DNA methyltransferase 3a promotes ischemic brain damage. PLoS One. 2013;8:e58039. doi: 10.1371/journal.pone.0058039. [DOI] [PMC free article] [PubMed] [Google Scholar]
- Papadopoulos GL, Alexiou P, Maragkakis M, Reczko M, Hatzigeorgiou AG. DIANA-mirPath: Integrating human and mouse microRNAs in pathways. Bioinformatics. 2009;25:1991–1993. doi: 10.1093/bioinformatics/btp299. [DOI] [PubMed] [Google Scholar]
- Park SW, Yi JH, Miranpuri G, Satriotomo I, Bowen K, Resnick DK, Vemuganti R. Thiazolidinedione class of peroxisome proliferator-activated receptor gamma agonists prevents neuronal damage, motor dysfunction, myelin loss, neuropathic pain, and inflammation after spinal cord injury in adult rats. The Journal of pharmacology and experimental therapeutics. 2007;320:1002–1012. doi: 10.1124/jpet.106.113472. [DOI] [PubMed] [Google Scholar]
- Place RF, Li LC, Pookot D, Noonan EJ, Dahiya R. MicroRNA-373 induces expression of genes with complementary promoter sequences. Proc Natl Acad Sci U S A. 2008;105:1608–1613. doi: 10.1073/pnas.0707594105. [DOI] [PMC free article] [PubMed] [Google Scholar]
- Racke MK, Drew PD. PPARs in Neuroinflammation. PPAR Res. 2008;2008:638356. doi: 10.1155/2008/638356. [DOI] [PMC free article] [PubMed] [Google Scholar]
- Tureyen K, Kapadia R, Bowen KK, Satriotomo I, Liang J, Feinstein DL, Vemuganti R. Peroxisome proliferator-activated receptor-gamma agonists induce neuroprotection following transient focal ischemia in normotensive, normoglycemic as well as hypertensive and type-2 diabetic rodents. J Neurochem. 2007;101:41–56. doi: 10.1111/j.1471-4159.2006.04376.x. [DOI] [PubMed] [Google Scholar]
- Vagin VV, Sigova A, Li C, Seitz H, Gvozdev V, Zamore PD. A distinct small RNA pathway silences selfish genetic elements in the germline. Science. 2006;313:320–324. doi: 10.1126/science.1129333. [DOI] [PubMed] [Google Scholar]
- Vemuganti R, Baskaya MK, Dogan A, Rothstein JD, Dempsey RJ. Traumatic brain injury down-regulates glial glutamate transporter (GLT-1 and GLAST) proteins in rat brain. J Neurochem. 1998;70:2020–2027. doi: 10.1046/j.1471-4159.1998.70052020.x. [DOI] [PubMed] [Google Scholar]
- Yi JH, Park SW, Brooks N, Lang BT, Vemuganti R. PPARgamma agonist rosiglitazone is neuroprotective after traumatic brain injury via anti-inflammatory and anti-oxidative mechanisms. Brain research. 2008;1244:164–172. doi: 10.1016/j.brainres.2008.09.074. [DOI] [PMC free article] [PubMed] [Google Scholar]
- Zhao XR, Gonzales N, Aronowski J. Pleiotropic Role of PPARgamma in Intracerebral Hemorrhage: An Intricate System Involving Nrf2, RXR, and NF-kappaB. Cns Neurosci Ther. 2015;21:357–366. doi: 10.1111/cns.12350. [DOI] [PMC free article] [PubMed] [Google Scholar]


