

Abstract
The liver X receptors (LXRs) are transcriptional regulators of cellular and systemic cholesterol homeostasis. In the setting of cholesterol excess, LXR activation induces the expression of a battery of genes involved in cholesterol efflux 1, facilities cholesterol esterification by promoting fatty acid synthesis 2, and inhibits cholesterol uptake by the low-density lipoprotein receptor (LDLR)3. The fact that sterol content is maintained in a narrow range in most cell types and in the organism as a whole suggests that extensive crosstalk between regulatory pathways must exist. However, the molecular mechanisms that integrate LXRs with other lipid metabolic pathways, are incompletely understood. Here we show that ligand activation of LXRs in liver not only promotes cholesterol efflux, but also simultaneously inhibits cholesterol biosynthesis. We further identify the long non-coding RNA LeXis as one mediator of this effect. Hepatic LeXis expression is robustly induced in response to western diet feeding or pharmacologic LXR activation. Raising or lowering the levels of LeXis in liver affects the expression of cholesterol biosynthetic genes, and the levels of cholesterol in the liver and plasma. LeXis interacts with and affects the DNA interactions of Raly, a heterogeneous ribonucleoprotein that is required for the maximal expression of cholesterologenic genes in mouse liver. These studies outline a regulatory role for a non-coding RNA in lipid metabolism and advance our understanding of the mechanisms orchestrating sterol homeostasis.
It is well established that the cholesterol biosynthetic pathway is downregulated under conditions where sterols are abundant through the inhibition of sterol regulatory element-binding protein (SREBP) processing4. Interestingly, however, under conditions where hepatic cholesterol content was not enriched, activation of LXR with the selective synthetic agonist GW3965 also acutely suppressed the expression of sterol synthesis genes in mouse liver (Fig. 1a and Extended data Fig. 1a). The effect could not be explained by changes in intracellular cholesterol levels, as LXR activation has been shown to lower hepatic cholesterol content 5, which would lead to up-regulation of the SREBP-2 pathway.
Figure 1. LXR activation inhibits cholesterol biosynthesis and induces LeXis expression.

a. Real-time PCR analysis of gene expression in livers from C57BL/6 mice treated by oral gavage with 40 mg/kg GW3965 for the indicated time. N=6/group. Values are means ± SEM. All curves are statistically different from baseline expression (P < 0.05). b. Schematic representation of the LeXis gene locus on Integrative Genome Viewer (IGV) showing histone marks from LICR ENCODE data. c. Real-time PCR analysis of gene expression in primary mouse hepatocytes treated with GW3965 (GW, 1 µM) and/or the RXR ligand LG268 (LG, 50 nM). Results are representative of four independent experiments. Values are means ± SD. d. Real-time PCR analysis of gene expression in livers from male C57BL/6 mice gavaged with GW3965 (40 mg/kg) prior to harvest at the indicated time (N=6/group). Values are means ± SEM. e. Gene expression in livers harvested from mice maintained on chow (N=2/group) or western diet (N=5/group). Values are means ± SEM. f. Gene expression in primary mouse peritoneal macrophages treated with GW3965 (GW, 1 µM) and/or LG268 (LG, 50 nM) for 16 hours. Results are representative of four independent experiments. Values are means ± SD. * P < 0.05; ** P < 0.01 (ANOVA with multigroup comparison (a,d,e)).
To investigate the mechanism by which LXRs suppress cholesterol biosynthesis, we performed genome-wide transcriptional profiling on primary mouse hepatocytes treated with vehicle or GW3965 (Extended data Fig. 1b). The most robustly induced gene in our RNA-sequencing analysis was a predicted noncoding RNA annotated as 4930412L05Rik (Extended data Fig. 1c). Parallel profiling of noncoding and protein-coding transcripts using microarrays also identified 4930412L05Rik as the highest induced transcript (Extended data Fig. 1d). We named this transcript LeXis (Liver-expressed LXR-induced sequence). Interestingly, the LeXis gene locus lies in close proximity to the canonical LXR target gene Abca1 in mouse. Analysis of chromatin structure from ENCODE 6–7 indicated that LeXis and Abca1 were distinct genes with separate promoters (Fig. 1b). We defined the transcripts produced from the LeXis gene using rapid amplification of cDNA ends (RACE) (Extended data Fig. 2). LeXis and Abca1 were induced by LXR (GW3965) and RXR (LG268) agonists in primary hepatocytes in an LXR-dependent manner (Fig. 1c and Extended data Fig. 3a). LeXis was induced in LXRα−/− and LXRβ−/− hepatocytes, indicating that both LXR isotypes are capable of regulating LeXis (Extended data Fig. 3b). Induction of LeXis was not sensitive to the protein synthesis inhibitor cycloheximide, and was not dependent on SREBPs, since 25-hydroxycholesterol (which blocks SREBP processing) also induced LeXis (Extended data Fig. 3c and 3d).
Administration of GW3965 to mice induced the expression of LeXis in multiple metabolically-active tissues (Fig. 1d and Extended data Fig. 3e). We also observed a prominent, LXR-dependent induction of LeXis expression in response to western diet feeding, consistent with a potential role for LeXis in the response to cholesterol excess (Fig. 1e). Despite being physically adjacent, the LeXis and Abca1 loci are regulated independently. LeXis was neither expressed at baseline nor induced by LXR in peritoneal macrophages, a cell type in which Abca1 expression is prominent (Fig. 1f). A luciferase reporter containing the LeXis promoter was induced by LXR/RXR in cotransfection assays (Extended data Fig. 3f), and we identified an LXR-response element within the LeXis promoter region that was bound by LXRα in ChIP-qPCR assays (Extended data Fig. 3g). The Coding Potential Calculator (CPC) and Coding Non-Coding Index (CNCI) algorithms predict low coding potential of LeXis (Extended data Fig. 3h,i). In addition, we found no evidence of production of a protein product from LeXis using in vitro transcription-translation assays (Extended data Fig. 3j).
To explore the function of LeXis in vivo, we transduced mice with adenoviral vectors encoding GFP control or LeXis (Fig. 2a and Extended data Fig. 4a). Remarkably, LeXis expression decreased serum cholesterol, but not triglycerides, in chow-fed C57BL/6 mice (Fig. 2a,b). No differences in liver function tests were observed between the two groups, and there was no evidence of ER stress or inflammation (Fig. 2b and Extended data Fig. 4b,c). Fractionation of lipoproteins revealed reduced cholesterol in both the LDL and HDL fractions in LeXis-expressing mice (Fig. 2c). The effects of LeXis were distinct from the consequences of hepatic expression other LXR target genes, such as Abca1 and Idol, which raise serum cholesterol8,9.
Figure 2. LeXis expression reduces serum cholesterol and sterol synthesis through a pathway requiring intact SREBP signaling.

a. Total serum cholesterol levels in 10-week old chow-fed male C57Bl/6 mice transduced with adenoviral vectors encoding GFP control (Ad-GFP) or LeXis (Ad-LeXis) for 6 days (N=24/group). b. Total serum triglycerides levels in the mice shown in a (N=12–16/group). c. Cholesterol levels in pooled fractionated serum from mice treated with Ad-GFP or Ad-LeXis. d. Analysis of gene expression in livers harvested after 6 days of transduction with Ad-GFP or Ad-LeXis (N=8/group). All values are means ± SEM. e. Total serum cholesterol levels in chow-fed male LDLR−/− mice (10 weeks old) transduced with Ad-GFP or Ad-LeXis for 6 days (N=8/group). f. Serum cholesterol levels in chow-fed WT or L-Scap KO mice gavaged with GW3965 40 mg/kg for 2 days. g. Cholesterol levels in pooled plasma fractions from mice shown in f. h. Total serum cholesterol levels in chow-fed L-Scap KO mice transduced with Ad-GFP or Ad-LeXis for 6 days. * P < 0.05; ** P < 0.01; *** P <0.001 and **** P <0.0001 (unpaired two-tailed t-test).
Unbiased pathway analysis of global gene expression revealed that the cholesterol biosynthetic pathway was strongly downregulated in LeXis-transduced livers (Extended data Fig. 4d). These results were validated by real-time PCR (Fig. 2d). These results suggested that the cholesterol lowering effects of LeXis were due, at least in part, to suppression of cholesterol biosynthesis. Consistent with this interpretation, we observed a strong trend towards lower cholesterol content in the livers of mice overexpressing LeXis (Extended data Fig. 4e). For reasons that are not yet clear, treatment of isolated primary hepatocytes did not faithfully reflect the effects of either LXR agonist treatment or LeXis expression on genes linked to sterol synthesis (Extended data Fig. 4f,g).
A reduction in plasma cholesterol suggests an increase in lipoprotein clearance or a decrease in sterol production10. To assess the contribution of LDLR to the actions of LeXis, we transduced Ldlr−/− mice with control or LeXis–expressing adenovirus. We observed decreases in plasma cholesterol levels and hepatic cholesterol content in response to LeXis in Ldlr−/− mice, suggesting that the Ldlr is not required for LeXis effects (Fig. 2e and Extended data Fig. 4h, i). To assess the contribution of Srebp-2 signaling to LXR-mediated inhibition of cholesterologenesis, we administered GW3965 to control or liver-specific Scap knockout mice (L-Scap KO)11. Consistent with previous studies 12, GW3965 treatment did not alter serum cholesterol levels in control mice (Fig. 2f). Surprisingly, however, GW3965 increased serum cholesterol levels in L-Scap KO mice, suggesting the loss of a suppressive effect (Fig. 2f and 2g). LXR target genes, including LeXis itself, were induced by GW3965 in both groups; however, the suppression of steroidogenic genes was abrogated in L-Scap KO mice (Extended data Fig. 4j). Furthermore, expression of LeXis also failed to lower serum cholesterol or to suppress cholesterogenic gene expression in L-Scap KO mice (Fig. 2h and extended data Fig. 4k).
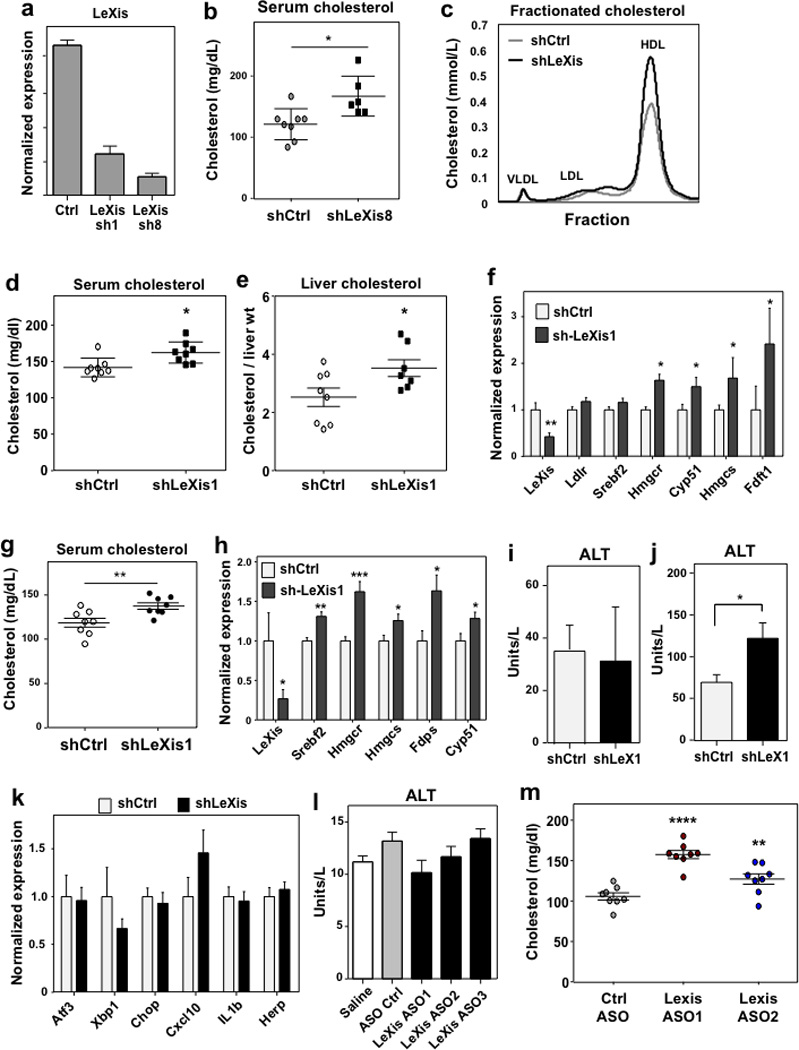
To address the role of LeXis in the setting of dietary cholesterol challenge, we used adenoviral vectors to express shRNA constructs targeting LeXis in mouse liver13,14. Knockdown of LeXis with either of two different shRNA constructs increased serum HDL cholesterol levels in mice fed a western diet (Extended data Fig. 5a–d). There was also an increase in liver cholesterol content in shLeXis-transduced mice (Extended data Fig. 5e). Gene expression analysis revealed increased expression of a number of cholesterol biosynthetic genes in response to LeXis knockdown (Extended data Fig. 5f). Similar effects of LeXis knockdown were observed in mice treated with GW3965 (Extended data Fig. 5g,h). There was no consistent evidence of ER stress or inflammation in these experiments (Extended data Figs. 5i,j,k).
As a complementary acute loss-of-function approach, we utilized antisense oligonucleotides (ASOs) to target LeXis expression15,16. Three different ASOs that potently blocked hepatic LeXis, but not saline or non-targeting ASO controls, increased serum cholesterol levels in the setting of LXR activation, with no evidence of hepatotoxicity (Fig. 3a,b and Extended data Figs. 5l,m). Furthermore, LeXis ASO administration increased cholesterogenic gene expression (Figs 3c).
Figure 3. Acute and chronic inactivation of LeXis alters hepatic lipid metabolism.

a. Gene expression in livers from C57BL/6 mice on chow diet administered ASOs IP at 25 mg/kg on days 1, 4, and 7, and gavaged with GW3965 at 40 mg/kg on days 4, 7 and 8 (N=5/group). All values are means ± SEM. b. Total serum cholesterol from mice in a. c. Gene expression from C57BL/6 mice on chow diet administered ASOs IP at 25 mg/kg on days 1, 3, and 5, and gavaged with GW3965 40 mg/kg on days 5 and 6 (N=8/group). All values are means ± SEM. d. Total serum cholesterol levels in chow-fed WT or LeXis−/− mice gavaged with GW3965 40 mg/kg for 2 days (N=8–10/group). e. Gene expression from C57BL/6 WT or LeXis−/− mice on chow diet gavaged with GW3965 40 mg/kg for 2 days (N=8–10/group). All values are means ± SEM. f. Hepatic cholesterol content normalized to liver mass from C57BL/6 WT or LeXis−/− mice fed western diet for 3 weeks (N=7–11/group). All values are means ± SEM. g. Representative (of 3 images per group) gross appearance of livers from WT and LeXis−/− after 3 weeks on western diet. h. Histologic sections of liver from WT and LeXis−/− after 3 weeks western diet (hematoxylin and eosin stain representative of 3 images per group). * P < 0.05; ** P < 0.01; *** P <0.001 and **** P <0.0001 (ANOVA (b, c) and unpaired two-tailed t-test (e,f)).
We generated LeXis-deficient mice to determine the consequences of chronic loss of LeXis function (Extended data Fig. 6a–6c). Although serum cholesterol levels in LeXis-deficient mice in the setting of LXR activation were not different from controls (Fig. 3d), the expression of sterol synthesis genes in the liver was increased (Fig. 3e). Furthermore, LeXis-null mice had increased hepatic cholesterol content when challenged with western diet (Fig. 3f). Gross and histologic examination of livers from LeXis-deficient mice null mice showed changes consistent with lipid accumulation (Fig. 3g and 3h). In contrast to the acute LXR agonist studies above, gene expression analysis of LeXis−/− mice maintained on western diet showed a trend toward decreased sterol synthetic gene expression, likely reflecting the marked increased hepatic cholesterol content in this setting (Extended data Fig. 6d).
To begin to understand how LeXis was influencing hepatic metabolism, we analyzed its subcellular localization. LeXis was almost exclusively located in the insoluble nuclear pellet in fractionation studies, along with the known nuclear lncRNAs XIST and histone H3 (Fig. 4a). Single molecule RNA fluorescence in-situ hybridization with LeXis-specific probes further confirmed its nuclear localization (Fig. 4b).
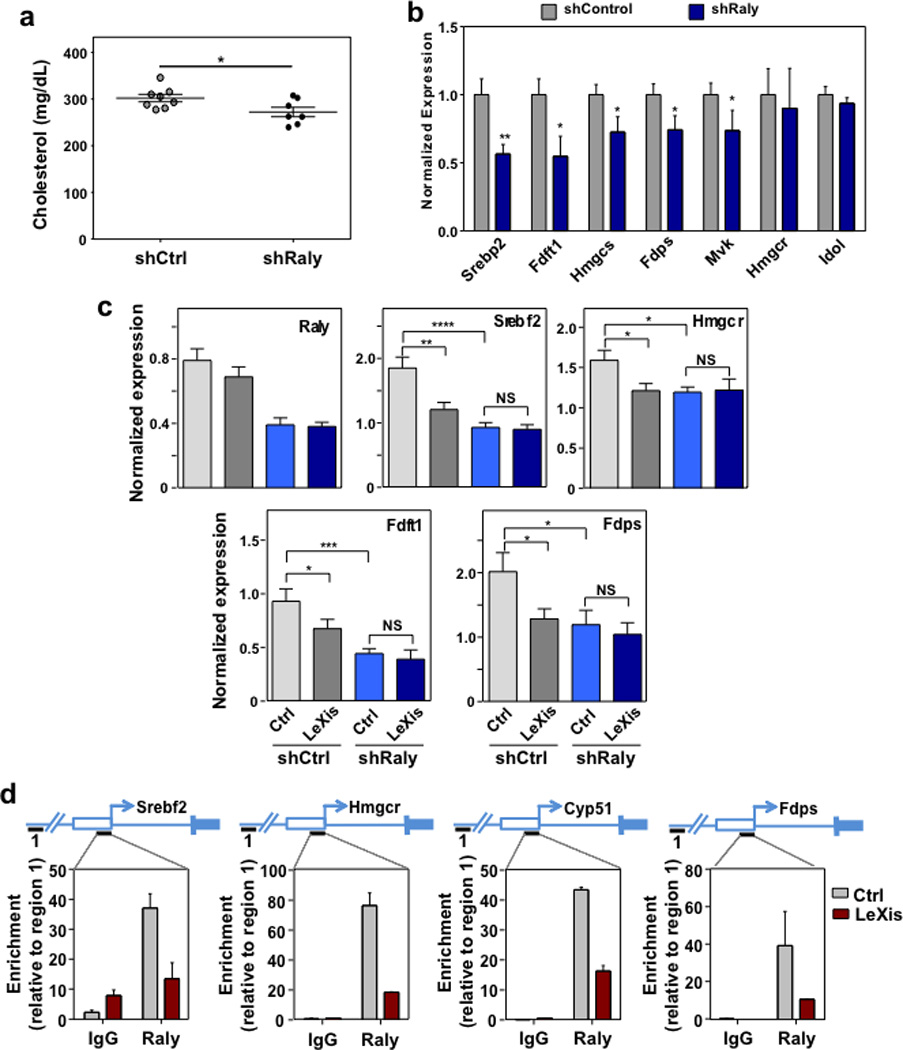
Figure 4. LeXis interacts with Raly to regulate metabolic gene expression.

a. Hepa1-6 cells were transfected with LeXis and 24 h later cellular content was separated into cytoplasmic soluble, nuclear soluble and insoluble (pellet) fractions. Transcripts in each fraction were analyzed by real-time PCR, and fraction purity was validated by Western blotting with the indicated compartment markers. Cyt=Cytoplasm, Nuc=Nucleoplasm, Pel=Nuclear Pellet. (N=3/group). Values are means ± STD. b. Representative (of 3) micrograph showing LeXis subcellular localization in primary mouse hepatocytes by single molecule fluorescence in situ hybridization using anti-sense probes to LeXis (Red). Nuclei were counterstained with DAPI (blue). c. Recruitment of RNA polymerase II to promoter regions as determined by ChIP-qPCR analysis in livers transduced with control (AdGFP) or AdLeXis. Data are expressed as percent input retrieved normalized to an upstream site (region1). (N=3/group). Values are means ± STD. d. Total serum cholesterol levels in 14-week old chow-fed male C57BL/6 mice transduced with control (shCtrl) or adenoviral vectors expressing shRNA targeting Raly (shRaly) (N=8/group). e. Gene expression in livers of the mice shown in f. Values are means ± SEM. f. Total serum cholesterol in chow-fed male C57BL/6 mice transduced with control (AdGFP) or AdLeXis (1.0 × 10⁹ PFU) and shCtrl or shRaly (2.0 × 10⁹ PFU) (N= 7–8/group). * P < 0.05; ** P < 0.01; *** P < 0.001 (unpaired two-tailed t-test (d,e) and ANOVA with multigroup comparison (f)).
Its presence in the nucleus suggested that LeXis might influence, and therefore we tested its ability to impact RNA polymerase II-dependent transcription. Expression of LeXis in mouse liver reduced RNA polymerase II engagement at the promoters of Srebf2 and its target genes (Fig. 4c). Prior work has shown that nuclear lncRNAs can affect transcription by modifying the recruitment of proteins to chromatin 17. We used an unbiased lncRNA:chromatin affinity capture technique to pulldown LeXis from mouse liver and identify interacting proteins (Extended data Fig. 7a) 18. Analysis of the LeXis interactome by mass spectrometry identified the heterogeneous ribonucleoprotein Raly 19 as a binding partner. Similar to LeXis, Raly was located in the nuclear pellet (chromatin) fraction of hepatocytes (Extended data Fig. 7b). Moreover, an antibody to Raly retrieved LeXis in co-immunoprecipitation studies (Extended data Fig. 7c,d).
Raly contains both an RNA-binding domain and a leucine-zipper coiled domain, suggesting it may act as a regulatory factor 20. Intriguingly, prior unbiased analysis of gene coexpression networks has identified Srebf2 as one of the top genes positively coregulated with Raly 21. Other studies have shown direct binding of Srebp-2 at the Raly promoter 22. Unbiased protein homology analysis revealed extensive structural conservation between Raly and RNA Binding Protein 14 (also known as CoAA; extended data Fig. 7e)23, a known steroid receptor coactivator 24. This led us to hypothesize that Raly may act as transcriptional cofactor for genes involved in cholesterol biosynthesis. In line with this idea, adenovirus-mediated knockdown of Raly in mouse liver reduced serum cholesterol, mimicking the effect of LeXis expression (Fig. 4d and Extended data Fig. 7f). This effect was correlated with reduced expression of Srebf2 and its target genes (Fig. 4e and Extended data Fig. 7g). Unbiased gene expression profiling of liver revealed that Raly knockdown preferentially affected cholesterol biosynthetic pathways (Extended data Fig. 8a,b). The effects of Raly were independent of LDLR expression, since they were preserved in Ldlr-null mice (Extended data Fig. 9a,b). The actions of LeXis in vivo were dependent on Raly, since the ability of LeXis to alter serum cholesterol levels and hepatic gene expression was impaired in the setting of Raly knockdown (Fig. 4f and extended data Fig. 9c). Finally, ChIP-qPCR analysis of mouse liver revealed that Raly associated with cholesterol biosynthetic gene promoters, and that Raly occupancy was reduced in the setting of LeXis expression (Extended data Fig. 9d).
This work identifies the non-coding RNA LeXis as additional mediator of the complex effects of LXR signaling on hepatic lipid metabolism. Our data suggest that LeXis contributes to the ability of LXRs to inhibit cholesterol synthesis. It is important to acknowledge, however, that the involvement of additional pathways in this crosstalk is not excluded by the present work. The demonstration that LeXis expression is responsive to dietary cues and can modulate physiologic pathways with links to common diseases expands our understanding of the regulatory potential of non-coding RNA. Interestingly, the consequences of acute and chronic loss of LeXis expression are only partially overlapping, perhaps reflecting compensation in the setting of developmental deletion 25.
Although the rapid sequence evolution of lncRNAs presents a challenge to identifying functional counterparts between species 26, Batch Coordinate Conversion between mouse and human assemblies revealed moderate conservation of the LeXis genomic sequence in a region adjacent to the human ABCA1 gene. An annotated putative lncRNA (TCONS 16452) in this region was robustly induced by LXR activation in human hepatocyte cell lines (Extended data Fig. 10). In the future it will be of interest to assess if this sequence or an as yet to be identified lncRNA is a functional ortholog of LeXis.
Materials & Methods
Reagents, Plasmids, and Gene Expression
GW3965 was synthesized as previously described 27. LG268 was from Ligand Pharmaceuticals. Oxysterols were purchased from Sigma and used as described 28. Simvastatin sodium salt was from Calbiochem. Ligands were dissolved in dimethyl sulfoxide before use in cell culture. LeXis was amplified from GW3695-treated primary mouse hepatocytes using KOD polymerase (Millipore) and primers designed to provide flanking attB sequences and a SacI site at the immediate 3' end. The fragments were then cloned into pDONR221 using the Gateway system and the minimal SV40 polyadenylation sequence was inserted at the SacI site. For transient transfections and viral vector production the entry clone was transferred into the pAd/CMV/V5-DEST Gateway vector by LR recombination. We estimate transcription from this vector to append 109 nucleotides at the 5' end, and 29 nucleotides at the 3' end of the cloned LeXis sequence. To obtain the shLeXis adenovirus, we used BLOCK-iT kit as described (Invitrogen) 3. Briefly, Invitrogen based software was used for original nucleotide generation targeting the LEXIS fragment and cloned into pENTR/U6. The resulting pENTR/U6-LEXIS shRNA plasmids were tested for their ability to inhibit overexpressed LEXIS in transient transfection experiments in HEK293T cells and then transferred by LR recombination into the pAd/BLOCK-iT-DEST destination vector for viral particle generation. Viruses were amplified, purified, and tittered by Viraquest. For gene expression analysis, RNA was isolated using TRIzol reagent (Invitrogen) and analyzed by real-time PCR using an Applied Biosystems 7900HT sequence detector or Applied Biosystems Quant Studio 6 Flex. Results are normalized to 36B4 or cyclophilin. Immunohistochemical staining of paraffin-embedded livers were done by the UCLA Translational Pathology Core Laboratory.
Animals and Diets
All animals (C57Bl/6, greater than 10 generations backcrossed) were housed in a temperature-controlled room under a 12-hour light/12-hour dark cycle and under pathogen-free conditions. For adenovirus experiments aged matched mice were purchased from Jackson Lab. Littermates were manually randomized to different treatment groups. Investigators were blinded to group allocation for some but not all studies. LXRα−/−, LXRβ−/−, and LXRαβ−/− mice were originally provided by David Mangelsdorf, University of Texas Southwestern Medical Center, Dallas, Texas, USA. Floxed SCAP−/−mice were previously described 29. LeXis global knockout Mice were generated at UCDavis KOMP using strategy outlined in Extended data Fig. 6). Mice were fed a chow diet except as indicated where mice were placed on a Western diet (21 percent fat, 0.21 percent cholesterol; D12079B; Research Diets Inc.) or were gavaged with either vehicle or 40 mg/kg of GW3965. Livers were harvested four hours after the last gavage. We measured cholesterol and triglycerides as previously described 30. For adenoviral infections, age-matched (9–11 weeks old) male mice were injected with 2.0 × 10⁹ PFU by tail-vein injection unless otherwise specified. Mice were sacrificed six days later following a six-hour fast. At the time of sacrifice liver tissue and blood was collected by cardiac-puncture and immediately frozen in liquid nitrogen and stored at –80°. Liver tissue was processed for isolation of RNA and protein as above. Generation 2.5 constrained ethyl ASOs, synthesized as described previously31, were IP administered 3 doses at a concentration of 25 mg/kg along with 40 mg/kg of GW3965. Animals were sacrificed on day 6 or day 8 as indicated in figure legends. The majority of experiments were performed using male mice. All animal experiments were approved by the UCLA Institutional Animal Care and Research Advisory Committee.
Cell culture
Primary peritoneal macrophages were isolated four days after thioglycollate injection and prepared as described 32. Mouse primary hepatocytes were isolated as previously described and cultured in William’s E medium with 5 percent FBS 28. Peritoneal cells were incubated in 0.5 percent FBS in DMEM, with 5 µM simvastatin and 100 µM mevalonic acid. Five to eight hours later, cells were pretreated with DMSO or appropriate ligand overnight. In vitro translation assay was performed using TnT Coupled Transcription/Translation System (PROMEGA) according to the manufacturer’s protocol. The cell lines HEK293T, HEK293A, Hepa1-6 were originally obtained from ATCC. All cells were tested for mycoplasma contamination.
RACE
The 5' and 3' ends of the LeXis transcript were defined using mouse liver RNA and the FirstChoice RLM-RACE kit (Ambion) according to manufacturer's protocol, with modifications. Briefly, for the 5' RACE, degraded mRNA 5' ends were dephosphorylated with CIP and then full-length mRNA was decapped with TAP. Following 5'RACE adapter ligation, reverse transcription was performed using SuperScriptIII First-Strand Synthesis system (Invitrogen) and LeXis-specific primers. For the 3’RACE, the RNA was reverse transcribed using SuperScriptIII First-Strand Synthesis system (Invitrogen) and the adapter-linked oligo dTs. The resulting cDNA was amplified by nested PCR across a 55–65 °C melting temperature gradient using KOD polymerase (Millipore), with the inner primers containing attB sequences. Aliquots of reactions were inspected on 1% agarose gels for product size and abundance. Products of select PCR reactions were purified using NucleoSpin Gel and PCR Cleanup kit (Clontech) and were inserted into pDONR221 by Gateway cloning. Cloned fragments were sequenced and then aligned to the mouse genome with the BLAST analysis tool.
RNA fractionation
PAd/CMV-LeXis vector was transfected into Hepa1-6 cells using BioT reagent (Bioland Scientific LLC) and 24 h later subcellular RNA fractions were obtained according to the protocol of Bhatt et al 33. Lysate aliquots were inspected for fractional purity by Western blotting with antibodies against α-tubulin, SNRP70 and histone H3 as cytoplasmic, nucleoplasmic and chromatin bound markers, respectively.
RNA Sequencing
RNA sequencing libraries, starting with 500 ng total RNA, were constructed with the TruSeq RNA Sample Prep Kits from Illumina on RNA isolated from primary hepatocytes treated with or without GW3965. Samples were indexed with adapters and submitted for paired-end 2 × 100-bp sequencing in Illumina HiSeq2000. RNA-seq reads were aligned with TopHatv2.0.2 to the mouse genome, version mm9 34. The Tophat alignment rate was 85 percent, resulting in an average of 65 million reads per sample. Transcripts were assessed and quantities were determined by Cufflinks v2.0.2, using a GTF file based on Ensembl mouse NCBI37. Comparison expression levels were made using FPKM values using Cuffdiff from the Cufflinks package 35. Data analysis performed by UCLA DNA Microarray Core.
Lipid Analysis
Tissue lipid was obtained using a Folch extraction. Briefly, chloroform extracts were dried under nitrogen and solubilized in water. Tissue and serum cholesterol and triglycerides were determined using a commercially available enzymatic kit (Wako). Hepatic cholesterol content was normalized to liver weight and protein concentration. Mice were fasted for at least 6 hours prior to blood collection and sacrifice. Plasma lipoprotein fractions were analyzed by FPLC.
Microarray
For cDNA microarray analysis, primary hepatocytes cells were treated as indicated above with either DMSO or GW3695. These samples were from an independent cohort from those submitted for RNA-seq. For each condition, two independent samples were processed. Transcriptional profiling was performed at the University of California, Los Angeles, microarray core facility by using Agilent SurePrint G3 Gene Expression array. Data were analyzed using GeneSpring software (Agilent Technologies) and David 36.
ChIP
Chip studies were performed as described elsewhere 37. Briefly mouse livers were cross-linked using a final formaldehyde concentration of 1% at room temperature for 10 minutes. The reaction was quenched with the addition of glycine. For sonication, 0.3 ml (1/3) of nuclear lysate was sonicated for 25–30 cycles 30 seconds on 30 seconds off at 4°C with BioRuptor twin sonicator (Diagenode). Sonicated Chromatin was incubated overnight at 4°C with control IgG or 25 ug of Anti-LXR alpha antibody [PPZ0412] - ChIP Grade (ABCAM), Pol II, Anti-Raly antibody [EPR10121] (ABCAM), or Pol II Antibody (N-20) X (Santa Cruz Biotechnology). Protein A Dynabeads (50 µl per IP sample) were added for 4 hours. After incubation beads were washed with wash buffer A (50 mM HEPES pH 7.9, 140 mM NaCl, 1 mM EDTA, 1% Triton X-100, 0.1% Na-deoxycholate, 0.1% SDS, 1x Protease Inhibitors freshly added), buffer B (50 mM HEPES pH 7.9, 500 mM NaCl, 1 mM EDTA, 1% Triton X-100, 0.1% Na-deoxycholate, 0.1% SDS) and finally LiCL buffer (20 mM Tris pH 8.0, 250 mM LiCl, 1 mM EDTA, 0.5% Na-deoxycholate, 0.5% NP-40). Reverse crosslinking was performed at 60°C overnight, with 1000rpm mix and DNA was extracted using a phenol-chloroform phase lock tube (5 PRIME) or Nucleospin PCR cleanup column (Macherey-Nagel). A standard curve for PCR was generated from serial dilutions of input samples and data expressed as percentage of input.
ChIRP
Chirp was performed as described by Chu et al 18. Briefly, mouse livers were cross-linked using glutaraldehyde. After glycine quenching, the nuclear lysate was sonicated for 25–30 cycles 30 seconds on 30 seconds off at 4°C with BioRuptor twin sonicator (Diagenode). LeXis and LacZ pulldown probes with BiotinTEG at 3’ were designed by Biosearch Tecnologies (see supplementary information) and allowed to hybridize overnight with sonicated chromatin at 37 °C (100 pmol probe per 1 mL chromatin). Following hybridization, C1 Dynabeads (Life Technologies) were added and incubated for 30 minutes. For protein elution for mass spectrometry analysis, washed beads were resuspended in 3× original volume of DNase buffer (100 mM NaCl and 0.1% NP-40), and protein was eluted with a cocktail of 50 mM triethyl ammonium bicarbonate, 12 mM sodium lauryl sarcosine, and 0.5% sodium deoxycholate supplemented with 100 ug/ml RNase A (Sigma-Aldrich) and 0.1 Units/microliter RNase H (Epicenter), and 100 U/ml DNase I (Invitrogen). For RNA isolation, beads were resuspended in protensase K buffer (100 mM NaCl, 10 mM TrisCl pH 7.0, 1 mM EDTA, 0.5% SDS, 5% by volume Proteainse K Ambion AM2546 20 mg/ml) and incubated at 50 °C followed by Trizol isolation and DNase treatment.
Single molecule RNA FISH
Custom Stellaris FISH probes were designed against LeXis. Stellaris probe set labeled with CAL Fluor Red 610 and RNA FISH performed as described by Raj el al 38. Briefly, hepatocytes were fixed with 3.7% formaldehyde in 1X PBS followed by 70% ethanol treatment to permeabilize cells. Cells were washed with 10% formamide in 2X SCC followed by treatment in humidified chamber with addition of probes (125 nM) in hybridization buffer (100mg/ml dextran sulphate and 10% formamide in 2X SSC). Cells were incubated in dark at 37 °C for 4 hours. Dapi Nuclear stain (5 ng/ml) was applied after washing with 10% formamide in 2X SCC. Images obtained using a Zeiss Z1 AxioObserver fluorescent microscope.
Statistical analysis
A non-paired student t-test was or ANOVA was used to determine statistical significance, defined at P-value < 0.05. Unless otherwise noted, error bars represent standard deviations. Experiments were independently performed at least twice. Sample size is based on statistical analysis of variance and prior experience with similar in vivo studies.
Extended Data
Extended data Figure 1. Identification of LeXis as an LXR-responsive lncRNA.
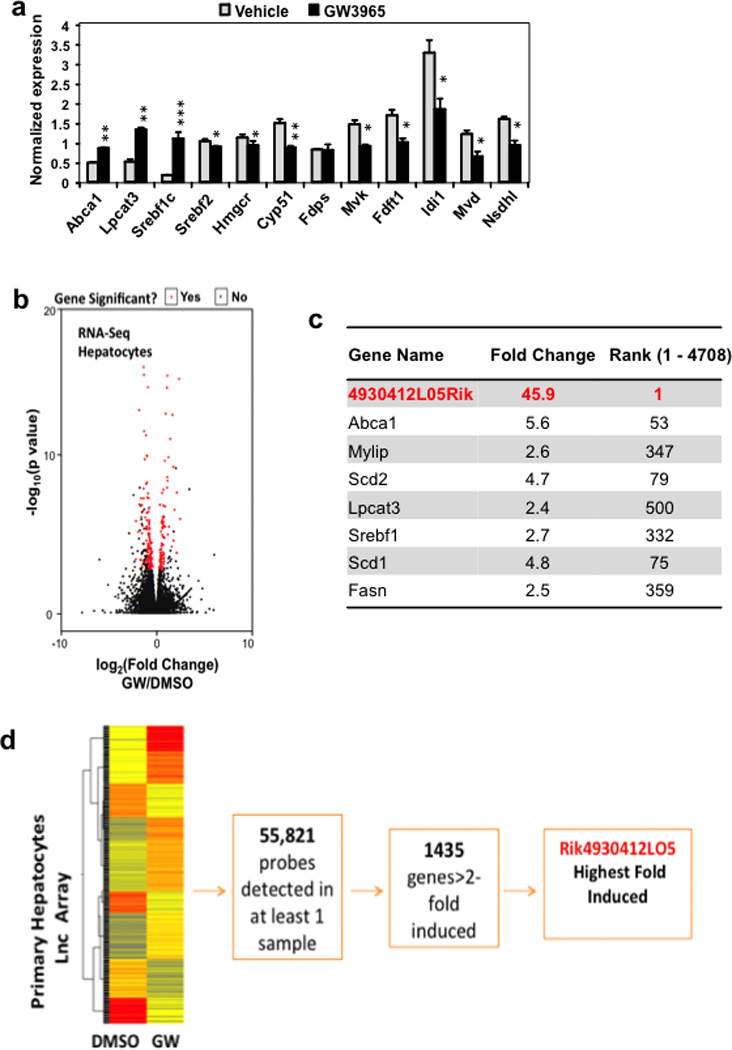
a. Real-time PCR analysis of gene expression in livers from mice gavaged with 40 mg/kg GW3965 for 2 days. Mice were fasted for 4 hours prior to harvest (N=4/group). Values are means ± SEM. * P < 0.05; ** P < 0.01 and *** P < 0.001 (unpaired two-tailed t-test). b. Volcano plot of RNA-seq results from primary hepatocytes treated for 16 hours with GW3965 (GW, 1µM). c. Relative expression of select LXR target genes identified in the RNA-seq study shown in b. Fold change represents ratio of transcript expression in GW3965 over DMSO treatment samples. Cut off fold induction of 1.1 used (total 4708 transcripts induced). d. Heat map representation of the results of transcriptional profiling (Agilent SurePrint G3 Gene Expression arrays) of primary hepatocytes treated with 1µM GW3965 16 hours. Data were analyzed using GeneSpring software.
Extended data Figure 2. Schematic of the LeXis gene locus and its RNA transcripts.
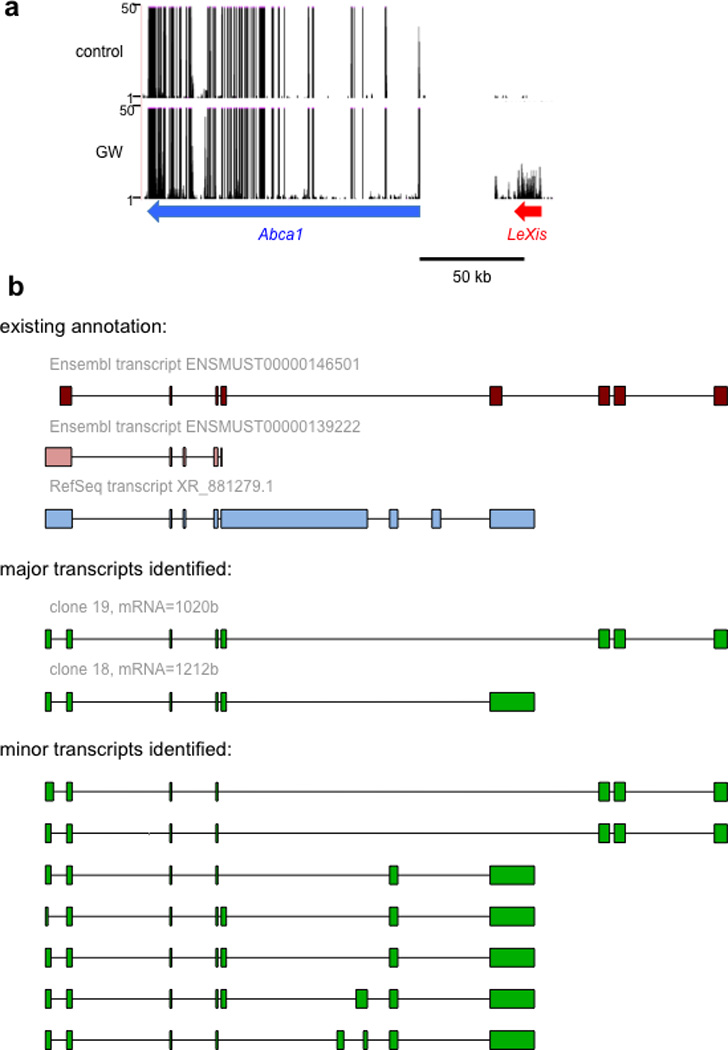
a. UCSC genome browser view of RNAseq transcriptional signatures at the Abca1/LeXis locus in mouse primary hepatocytes treated with GW3965 (GW, 1 µM) for 16 hours. b. Exon structure of major and minor LeXis transcripts identified by RACE, aligned for comparison to existing annotation in the indicated databases.
Extended data Figure 3. Regulation of LeXis expression.
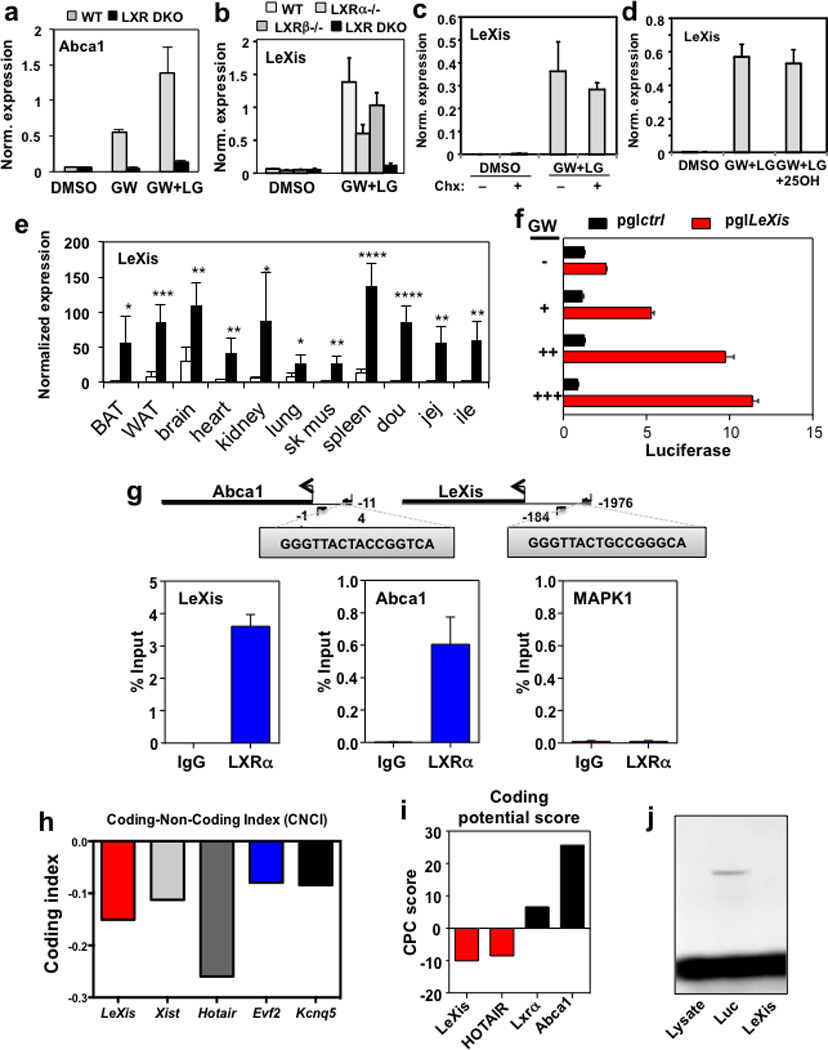
a. Real-time PCR analysis of primary mouse hepatocytes from WT or Lxrαβ−/− mice treated with 1 µM GW3965 and/or 50 nM LG268. Results are representative of four independent experiments. Values are means ± SD. b. LeXis expression in primary mouse hepatocytes from WT, Lxrα−/−, Lxrβ−/− or Lxrαβ−/− mice treated with GW3965 and LG268. Results are representative of three independent experiments. Values are means ± SD. c. LeXis expression in primary hepatocytes treated with GW3965 and LG268 in presence or absence of the protein synthesis inhibitor cycloheximide (Chx, 1 µg/µl). Results are representative of three independent experiments. Values are means ± SD. (Chx=Cyloheximide). d. LeXis expression in primary hepatocytes treated with GW3965 and LG268 (LG, 50 nM) in the presence or absence of 25-hydroxycholesterol (25OH, 2.5 µM). Results are representative of three independent experiments. Values are means ± SD. e. Gene expression in tissues from C57BL/6 mice gavaged with 40 mg/kg GW3965 for 3 days. N=5/group. Values are means ± SEM. * P < 0.05; ** P < 0.01; *** P <0.001 and **** P <0.0001 (unpaired two-tailed t-test). f. Relative firefly luciferase activity measured from the pgl4.10 vector or pgl4.10 with the LeXis promoter cloned upstream of luciferase. Reporters were cotransfected in 293 cells and treated with GW3965 for 24 hours. Activity is normalized to Renilla luciferase internal control. g. Analysis of LXRα binding to the LeXis promoter in mouse liver by ChIP-qPCR. Schematic shows primer pair positions relative to the LXREs in the LeXis, and Abca1 (positive control) promoters. Primers flanking a region of the MAP kinase I promoter served as a negative control. Chip values are presented as percentage of input DNA. (N=4/group). Values are means ± SEM. h. Prediction of coding potential using the Coding-Non-Coding Index (CNCI) software. Negative value indicates low coding potential. i. Comparison of protein coding potential using CPC score for LeXis, the noncoding gene HOTAIR, and control protein-coding transcripts. j. In vitro translation of LeXis and luciferase control RNAs.
Extended data Figure 4. LeXis modulates the expression of genes liked to sterol synthesis.
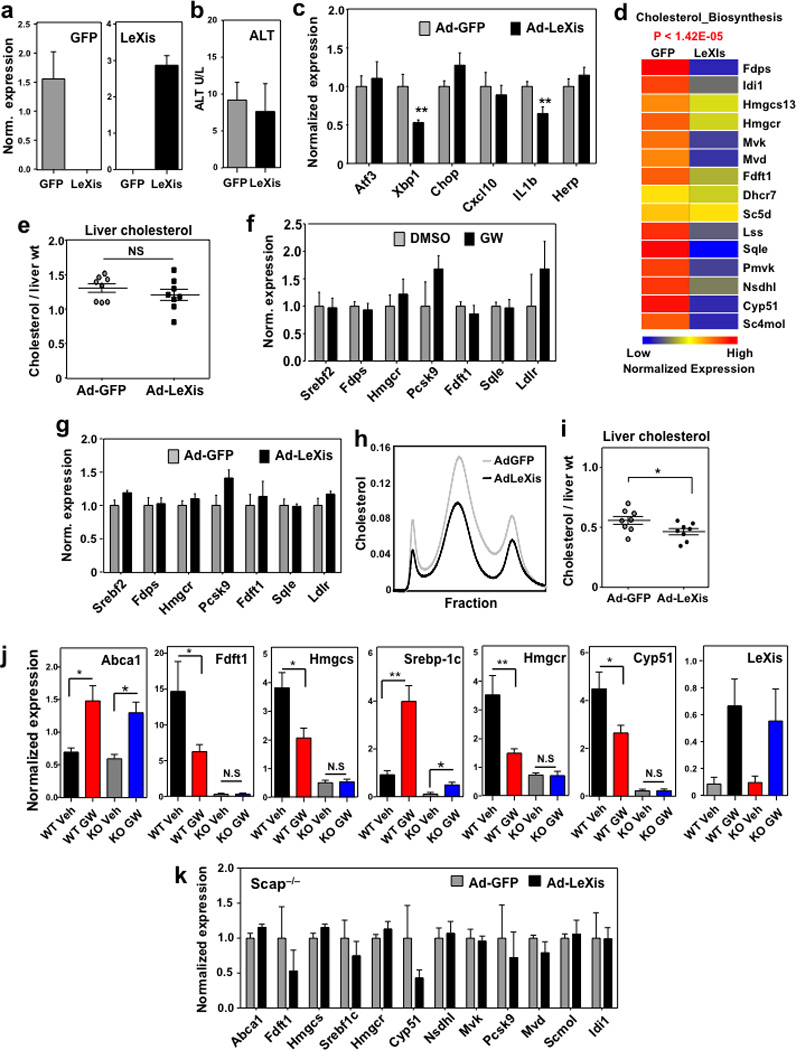
a. Gene expression in livers harvested after 6 days of transduction with pAd-GFP or pAd-LeXis (N=8/group). All values are means ± SEM. b. Serum alanine aminotransferase activity in chow-fed mice transduced with pAd-GFP or pAd-LeXis for 6 days. N=8/group. All values are means ± SEM. c. Gene expression in livers harvested after 6 days of transduction with pAd-GFP or pAd-LeXis (N=8/group). All values are means ± SEM. d. Unbiased pathway analysis (GeneSpring software) of the results from transcriptional profiling of livers treated with pAd-GFP or pAd-LeXis. N=4/group. e. Hepatic cholesterol content normalized to liver mass in WT mice transduced with pAd-GFP or pAd-LeXis (N=8/group). All values are means ± SEM. f. Gene expression in mouse hepatocytes treated overnight with 1 µM GW3965. Results are representative of two independent experiments. Values are means ± SD. g. Gene expression in mouse hepatocytes treated overnight with AdGFP or AdLeXis for 24 hours. Results are representative of two independent experiments. Values are means ± SD. h. Cholesterol levels in pooled fractionated serum from LDLR−/− mice transduced with pAd-GFP or pAd-LeXis. i. Hepatic cholesterol content normalized to liver mass in LDLR−/− mice transduced with pAd-GFP or pAd-LeXis (N=8/group). All values are means ± SEM. j. Gene expression in livers from chow-fed WT or L-Scap KO (KO) mice gavaged with 40 mg/kg GW3965 for 2 days. (N=5(WT Veh), 8(WT GW), 5(KO Veh), 7(KO GW)). All values are means ± SEM. k. Gene expression in livers from L-Scap KO chow-fed mice transduced with Ad-GFP or Ad-LeXis for 6 days. (N=5/group). All values are means ± SEM.* P < 0.05; ** P < 0.01 (unpaired two-tailed t-test).
Extended data Figure 5. Inhibition of LeXis expression alters serum cholesterol level.
a. In vitro validation of LeXis knockdown using shLeXis1 and shLeXis8 vectors. Results are representative of three independent experiments. Values means ± SD. b. Total serum cholesterol measured in C57Bl/6 mice fed 2 weeks of western diet and transduced with adenovirus shCtrl or shLeXis8 for 6 days (N=6–8/group). c. Cholesterol levels in pooled fractionated serum from mice transduced with shCtrl or shLeXis adenovirus. d. Total serum cholesterol from male C57BL/6 mice fed western diet for 2 weeks and then transduced with control (shCtrl) or adenoviral vectors expressing shRNA targeting LeXis (shLeXis1) (N=8/group). e. Hepatic cholesterol content normalized to liver mass for the mice shown in d (N= 8(shCtrl), 7(shLeXis1)). f. Gene expression in livers of mice fed western diet for 2 weeks and then transduced with shCtrl or shLeXis (N= 8(shCtrl), 7(shLeXis1)). Values are means ± SEM. g. Total plasma cholesterol levels in chow-fed C57Bl/6 mice transduced with shCtrl or shLeXis adenovirus and treated with 40 mg/kg GW3965 by gavage for 6 days (N=8/group). h. Gene expression in livers of chow-fed C57Bl/6 mice transduced with shCtrl or shLeXis adenovirus and treated with 40 mg/kg GW3965 by gavage for 6 days (N=8/group). Values are means ± SEM. i. Serum alanine aminotransferase activity from mice in h. All values are means ± SEM. j. Serum alanine aminotransferase activity from mice in d. All values are means ± SEM. k. Gene expression in livers of mice fed western diet for 2 weeks and then transduced with shCtrl or shLeXis (N= 8(shCtrl), 7(shLeXis1)). . Values are means ± SEM. l. Serum alanine aminotransferase activity from C57BL/6 mice on chow diet administered ASOs IP at 25 mg/kg on days 1, 4, and 7, and gavaged with GW3965 40 mg/kg on days 4, 7 and 8 (N=5/group). All values are means ± SEM. m. Total serum cholesterol from C57BL/6 mice on chow diet ASOs administered ASOs IP at 25 mg/kg on days 1, 3, and 5 and gavaged with 40 mg/kg GW3965 on days 5 and 6 (N=8/group). * P < 0.05; ** P < 0.01; *** P < 0.001 (unpaired two-tailed t-test (b, d–h, j) and ANOVA with multigroup comparison (m)).
Extended data Figure 6. Generation of global LeXis−/− mice.
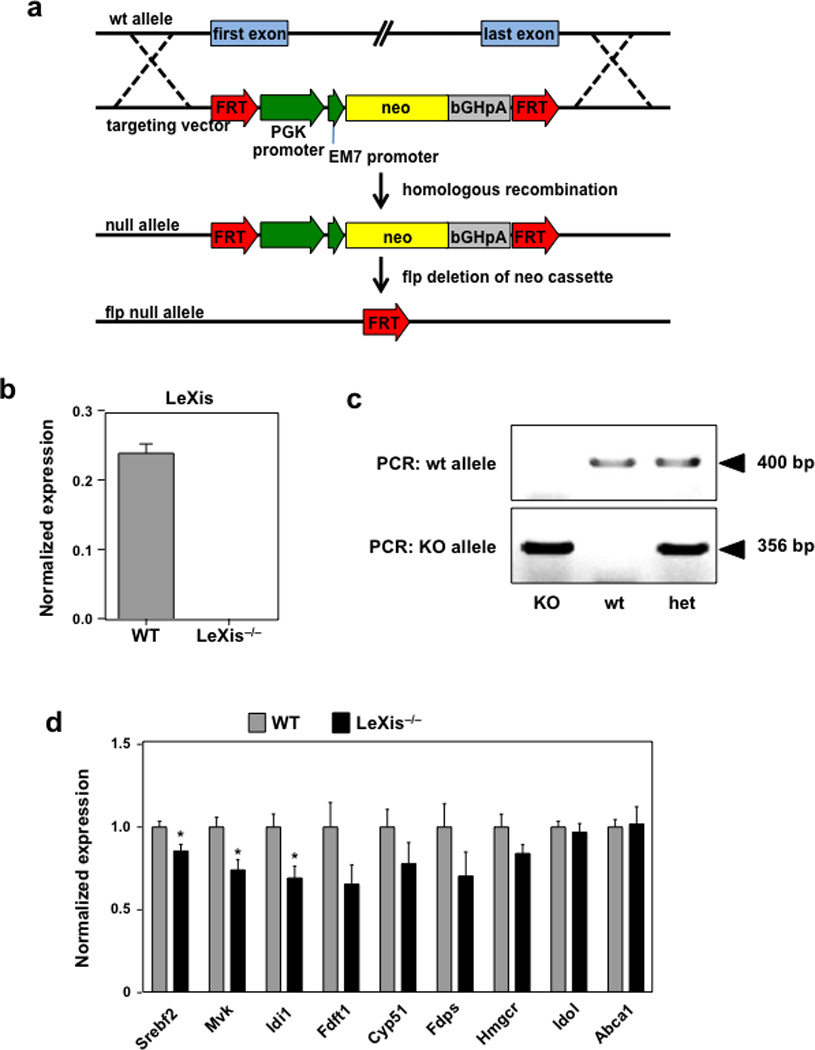
a. Schematic of knockout strategy. Vector construct designed to ablate entire LeXis transcript. Targeted mice were crossed with Flp−/− mice to excise the Neo cassette since it contains an active bi-directional promoter. b and c Gene expression (N=3/group) and PCR genotyping strategy for LeXis−/− mice. d. Gene expression from C57BL/6 WT or LeXis−/− mice placed on western diet for 3 weeks (N=11(WT), 7(LeXis−/−)). All values are means ± SEM. * P < 0.05 (unpaired two-tailed t-test).
Extended data Figure 7. Identification of Raly as a LeXis-interacting protein.
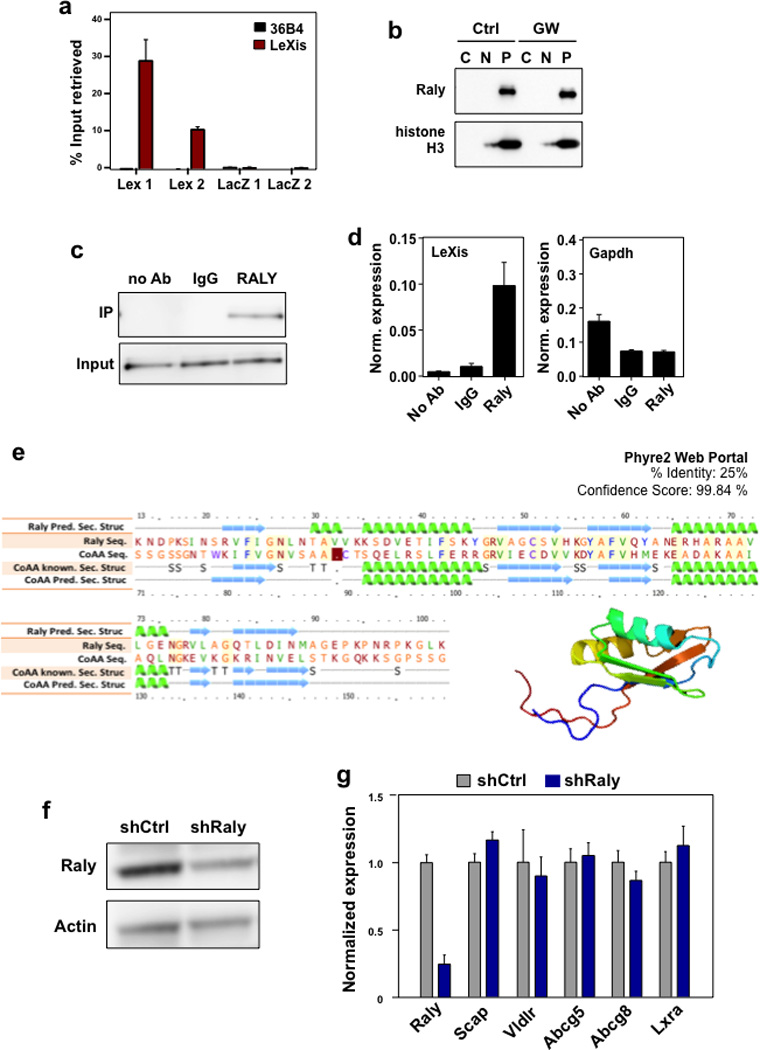
a. Complimentary biotin labeled tilling oligonucleotides incubated with cellular extracts from liver. Probes sets designed to retrieve LeXis (Lex 1 and Lex 2) or LacZ (LacZ1 and LacZ2). Percent input of retrieved LeXis and 36b4 are shown. (N=4/group). Values are means ± STD. b. Cellular contents separated into cytoplasmic soluble, nuclear soluble and insoluble (pellet) fractions were analyzed by Western blotting with anti-RALY and anti-histone H3 antibodies. C=Cytoplasm, N=Nucleoplasm, P=Nuclear Pellet. c. Antibodies were incubated with cellular lysates from mouse hepatocytes and interaction with endogenous RALY was assessed after immunoprecipitation and Western Blot. d. Complexes from b were analyzed for presence of LeXis or GAPDH by RT-qPCR and signals were normalized to 36b4. (N=4/group). e. Sequence alignment, predicted secondary structure, and 3D model of Raly are shown as reported using the Phyre2 web portal (Protein Homology/analogY Recognition Engine V 2.0). f. Western blot for Raly from livers transduced with control (shCtrl) or adenoviral vectors expressing shRNA targeting Raly (shRaly) (N=Pooled 4 animals/group). g. Gene expression from liver from 14-week old chow-fed male C57Bl/6 mice transduced with control (shCtrl) or adenoviral vectors expressing shRNA targeting Raly (shRaly) (N=8/group). All values are means ±SEM.
Extended data Figure 8. Knockdown of Raly preferentially affects pathways link to cholesterol metabolism in mouse liver.
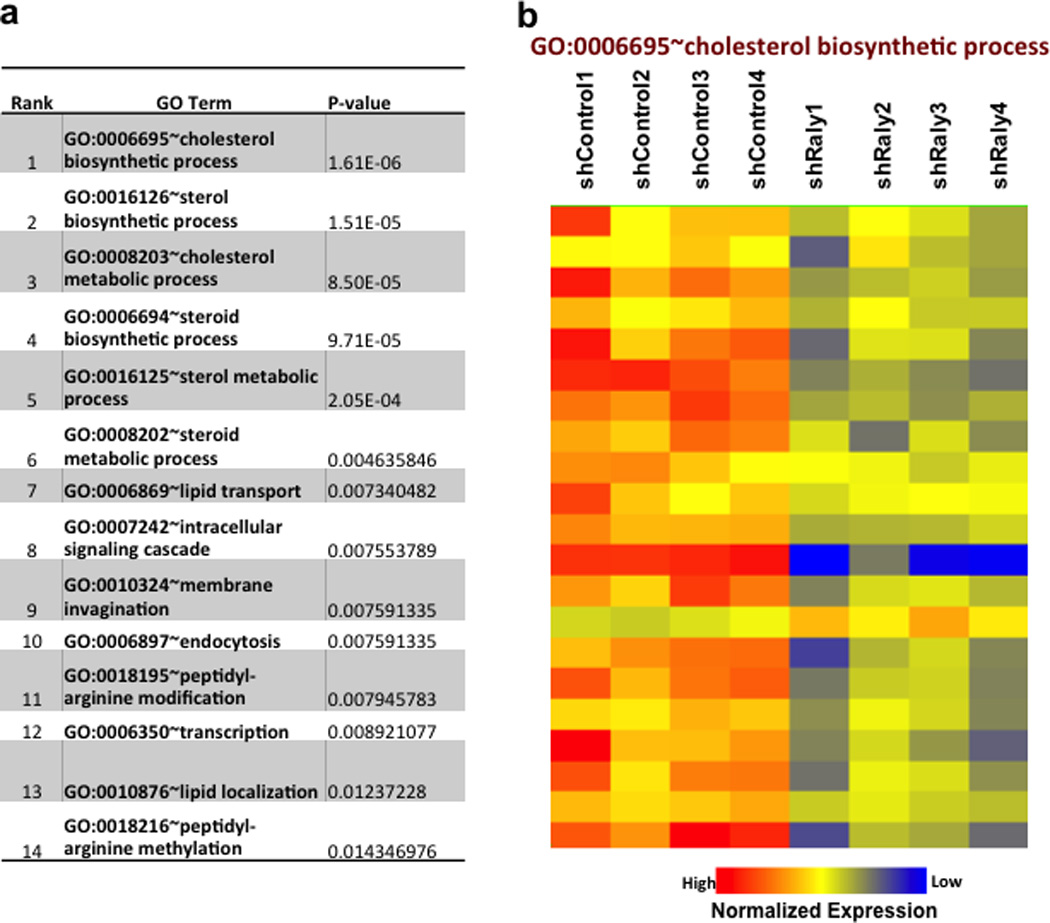
a and b. Most significant Gene Ontology terms from microarray analysis from livers treated with shCtrl or shRaly. Analysis performed using Genespring and DAVID.
Extended data Figure 9. Raly is required for LeXis mediated effects on cholesterogenesis.
a. Total serum cholesterol levels in LDLR−/− mice transduced with shCtrl or shRaly for 6 days (N=8(shCtrl), 7(shRaly)). b. Gene expression from liver harvested from LDLR−/− mice transduced with shCtrl or shRaly for 6 days (N=8(shCtrl), 7(shRaly)). All values are means ±SEM. c. Gene expression from C57Bl/6 mice transduced with Ctrl (AdGFP) or LeXis (1.0 × 10⁹ PFU) and shCtrl or shRaly (2.0 × 10⁹ PFU) (N= 7(Ctrl/shCtrl and LeXis/shRaly), 8(LeXis/shCtrl and Ctrl/shRaly)). All values are means ± SEM. d. Recruitment of Raly in promoter regions as determined by Chip analysis in livers transduced with control (AdGFP) or AdLeXis. Data expressed as percent input retrieved normalized to an upstream site (region1). (N=3/group). Values are means ± STD. * P < 0.05; ** P < 0.01; *** P < 0.001; **** P < 0.0001 (unpaired two-tailed t-test (a,b,) and ANOVA with multigroup comparison (c)).
Extended data Figure 10. Batch Genome Conversion between mouse and human at LeXis gene locus.
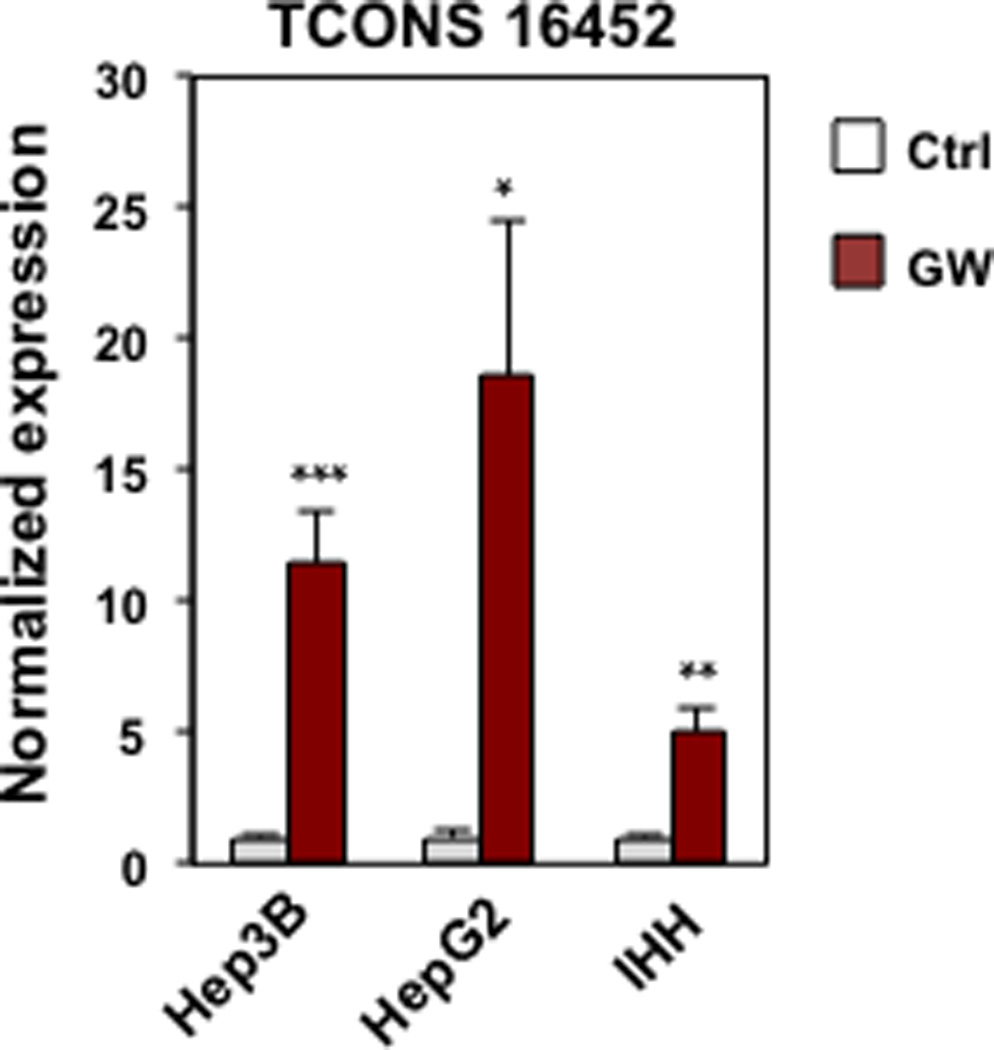
Gene expression for human lincRNA TCONS 16452 in hepatocyte cell lines treated with 1 µM GW3965. (N=3/group). Values are means ± SD. * P < 0.05; ** P < 0.01 and *** P <0.001 (unpaired two-tailed t-test).
Supplementary Material
Acknowledgments
We thank members of the Tontonoz, Nagy, Smale and Black laboratories and the UCLA Atherosclerosis Research Unit for technical assistance and useful discussions. This work was support by NIH grants HL030568, HL066088, DK063491, HL128822, DK102559 and HL69766; American Heart Association grant 13POST17080115; American College of Cardiology Presidential CDA; and the UCLA Cardiovascular Discovery Fund (Lauren B. Leichtman and Arthur E. Levine Investigator Award).
Footnotes
Contributions
TS and PT conceived and designed the study, guided the interpretation of the results and the preparation of the manuscript. PT supervised the study and provided critical suggestions. TS and XW performed the majority of mouse experiments and data analysis. MCJ, TG, LZ, JS, CH, TV participated in mouse experiments and data analysis. TS performed RNA-seq experiments and validated LeXis as an LXR target. AE and DC processed and analyzed next-generation sequencing data. MCJ performed and analyzed the RACE experiments. JW performed the Mass Spectrometry Analysis. MK and RL provided and independently validated ASOs targeting LeXis. TS and PT drafted the manuscript. TS, MCJ and PT edited the manuscript with input from all authors. All authors discussed the results and approved the final version of the manuscript.
Competing financial interests
The authors declare no competing financial interests.
References
- 1.Tontonoz P. Transcriptional and posttranscriptional control of cholesterol homeostasis by liver X receptors. Cold Spring Harbor symposia on quantitative biology. 2011;76:129–137. doi: 10.1101/sqb.2011.76.010702. [DOI] [PubMed] [Google Scholar]
- 2.Repa JJ, et al. Regulation of mouse sterol regulatory element-binding protein-1c gene (SREBP-1c) by oxysterol receptors, LXRalpha and LXRbeta. Genes & development. 2000;14:2819–2830. doi: 10.1101/gad.844900. [DOI] [PMC free article] [PubMed] [Google Scholar]
- 3.Zelcer N, Hong C, Boyadjian R, Tontonoz P. LXR regulates cholesterol uptake through Idol-dependent ubiquitination of the LDL receptor. Science. 2009;325:100–104. doi: 10.1126/science.1168974. [DOI] [PMC free article] [PubMed] [Google Scholar]
- 4.Brown MS, Goldstein JL. The SREBP pathway: regulation of cholesterol metabolism by proteolysis of a membrane-bound transcription factor. Cell. 1997;89:331–340. doi: 10.1016/s0092-8674(00)80213-5. [DOI] [PubMed] [Google Scholar]
- 5.Zhang Y, et al. Liver LXRalpha expression is crucial for whole body cholesterol homeostasis and reverse cholesterol transport in mice. The Journal of clinical investigation. 2012;122:1688–1699. doi: 10.1172/JCI59817. [DOI] [PMC free article] [PubMed] [Google Scholar]
- 6.Creyghton MP, et al. Histone H3K27ac separates active from poised enhancers and predicts developmental state. Proceedings of the National Academy of Sciences of the United States of America. 2010;107:21931–21936. doi: 10.1073/pnas.1016071107. [DOI] [PMC free article] [PubMed] [Google Scholar]
- 7.Consortium EP. An integrated encyclopedia of DNA elements in the human genome. Nature. 2012;489:57–74. doi: 10.1038/nature11247. [DOI] [PMC free article] [PubMed] [Google Scholar]
- 8.Zelcer N, Tontonoz P. Liver X receptors as integrators of metabolic and inflammatory signaling. The Journal of clinical investigation. 2006;116:607–614. doi: 10.1172/JCI27883. [DOI] [PMC free article] [PubMed] [Google Scholar]
- 9.Vaisman BL, et al. ABCA1 overexpression leads to hyperalphalipoproteinemia and increased biliary cholesterol excretion in transgenic mice. The Journal of clinical investigation. 2001;108:303–309. doi: 10.1172/JCI12517. [DOI] [PMC free article] [PubMed] [Google Scholar]
- 10.Horton JD, Goldstein JL, Brown MS. SREBPs: activators of the complete program of cholesterol and fatty acid synthesis in the liver. The Journal of clinical investigation. 2002;109:1125–1131. doi: 10.1172/JCI15593. [DOI] [PMC free article] [PubMed] [Google Scholar]
- 11.Matsuda M, et al. SREBP cleavage-activating protein (SCAP) is required for increased lipid synthesis in liver induced by cholesterol deprivation and insulin elevation. Genes & development. 2001;15:1206–1216. doi: 10.1101/gad.891301. [DOI] [PMC free article] [PubMed] [Google Scholar]
- 12.Hong C, et al. The LXR-Idol axis differentially regulates plasma LDL levels in primates and mice. Cell metabolism. 2014;20:910–918. doi: 10.1016/j.cmet.2014.10.001. [DOI] [PMC free article] [PubMed] [Google Scholar]
- 13.Carpenter S, et al. A long noncoding RNA mediates both activation and repression of immune response genes. Science. 2013;341:789–792. doi: 10.1126/science.1240925. [DOI] [PMC free article] [PubMed] [Google Scholar]
- 14.Yang F, Zhang H, Mei Y, Wu M. Reciprocal regulation of HIF-1alpha and lincRNA-p21 modulates the Warburg effect. Molecular cell. 2014;53:88–100. doi: 10.1016/j.molcel.2013.11.004. [DOI] [PubMed] [Google Scholar]
- 15.Raal FJ, et al. Mipomersen, an apolipoprotein B synthesis inhibitor, for lowering of LDL cholesterol concentrations in patients with homozygous familial hypercholesterolaemia: a randomised, double-blind, placebo-controlled trial. Lancet. 2010;375:998–1006. doi: 10.1016/S0140-6736(10)60284-X. [DOI] [PubMed] [Google Scholar]
- 16.Gaudet D, et al. Targeting APOC3 in the familial chylomicronemia syndrome. The New England journal of medicine. 2014;371:2200–2206. doi: 10.1056/NEJMoa1400284. [DOI] [PubMed] [Google Scholar]
- 17.Rinn JL, Chang HY. Genome regulation by long noncoding RNAs. Annual review of biochemistry. 2012;81:145–166. doi: 10.1146/annurev-biochem-051410-092902. [DOI] [PMC free article] [PubMed] [Google Scholar]
- 18.Chu C, Quinn J, Chang HY. Chromatin isolation by RNA purification (ChIRP) Journal of visualized experiments : JoVE. doi: 10.3791/3912. [DOI] [PMC free article] [PubMed] [Google Scholar]
- 19.Michaud EJ, Bultman SJ, Stubbs LJ, Woychik RP. The embryonic lethality of homozygous lethal yellow mice (Ay/Ay) is associated with the disruption of a novel RNA-binding protein. Genes & development. 1993;7:1203–1213. doi: 10.1101/gad.7.7a.1203. [DOI] [PubMed] [Google Scholar]
- 20.Jiang W, Guo X, Bhavanandan VP. Four distinct regions in the auxiliary domain of heterogeneous nuclear ribonucleoprotein C-related proteins. Biochimica et biophysica acta. 1998;1399:229–233. doi: 10.1016/s0167-4781(98)00114-6. [DOI] [PubMed] [Google Scholar]
- 21.Okamura Y, et al. COXPRESdb in 2015: coexpression database for animal species by DNA-microarray and RNAseq-based expression data with multiple quality assessment systems. Nucleic acids research. 2015;43:D82–D86. doi: 10.1093/nar/gku1163. [DOI] [PMC free article] [PubMed] [Google Scholar]
- 22.Seo YK, et al. Genome-wide localization of SREBP-2 in hepatic chromatin predicts a role in autophagy. Cell metabolism. 2011;13:367–375. doi: 10.1016/j.cmet.2011.03.005. [DOI] [PMC free article] [PubMed] [Google Scholar]
- 23.Kelley LA, Mezulis S, Yates CM, Wass MN, Sternberg MJ. The Phyre2 web portal for protein modeling, prediction and analysis. Nature protocols. 2015;10:845–858. doi: 10.1038/nprot.2015.053. [DOI] [PMC free article] [PubMed] [Google Scholar]
- 24.Auboeuf D, et al. CoAA, a nuclear receptor coactivator protein at the interface of transcriptional coactivation and RNA splicing. Molecular and cellular biology. 2004;24:442–453. doi: 10.1128/MCB.24.1.442-453.2004. [DOI] [PMC free article] [PubMed] [Google Scholar]
- 25.Rossi A, et al. Genetic compensation induced by deleterious mutations but not gene knockdowns. Nature. 2015;524:230–233. doi: 10.1038/nature14580. [DOI] [PubMed] [Google Scholar]
- 26.Ulitsky I, Shkumatava A, Jan CH, Sive H, Bartel DP. Conserved function of lincRNAs in vertebrate embryonic development despite rapid sequence evolution. Cell. 2011;147:1537–1550. doi: 10.1016/j.cell.2011.11.055. [DOI] [PMC free article] [PubMed] [Google Scholar]
- 27.Sallam T, et al. The macrophage LBP gene is an LXR target that promotes macrophage survival and atherosclerosis. Journal of lipid research. 2014;55:1120–1130. doi: 10.1194/jlr.M047548. [DOI] [PMC free article] [PubMed] [Google Scholar]
- 28.Rong X, et al. LXRs Regulate ER Stress and Inflammation through Dynamic Modulation of Membrane Phospholipid Composition. Cell metabolism. 2013;18:685–697. doi: 10.1016/j.cmet.2013.10.002. [DOI] [PMC free article] [PubMed] [Google Scholar]
- 29.Tarling EJ, Ahn H, de Aguiar Vallim TQ. The Nuclear Receptor FXR Uncouples the Actions of miR-33 From SREBP-2. Arteriosclerosis, thrombosis, and vascular biology. 2015;35:787–795. doi: 10.1161/ATVBAHA.114.304179. [DOI] [PMC free article] [PubMed] [Google Scholar]
- 30.Hong C, et al. LXRalpha is uniquely required for maximal reverse cholesterol transport and atheroprotection in ApoE-deficient mice. Journal of lipid research. 2012;53:1126–1133. doi: 10.1194/jlr.M022061. [DOI] [PMC free article] [PubMed] [Google Scholar]
- 31.Seth PP, et al. Short antisense oligonucleotides with novel 2'-4' conformationaly restricted nucleoside analogues show improved potency without increased toxicity in animals. Journal of medicinal chemistry. 2009;52:10–13. doi: 10.1021/jm801294h. [DOI] [PubMed] [Google Scholar]
- 32.Bradley MN, et al. Ligand activation of LXR beta reverses atherosclerosis and cellular cholesterol overload in mice lacking LXR alpha and apoE. The Journal of clinical investigation. 2007;117:2337–2346. doi: 10.1172/JCI31909. [DOI] [PMC free article] [PubMed] [Google Scholar]
- 33.Bhatt DM, et al. Transcript dynamics of proinflammatory genes revealed by sequence analysis of subcellular RNA fractions. Cell. 2012;150:279–290. doi: 10.1016/j.cell.2012.05.043. [DOI] [PMC free article] [PubMed] [Google Scholar]
- 34.Trapnell C, Pachter L, Salzberg SL. TopHat: discovering splice junctions with RNA-Seq. Bioinformatics. 2009;25:1105–1111. doi: 10.1093/bioinformatics/btp120. [DOI] [PMC free article] [PubMed] [Google Scholar]
- 35.Trapnell C, et al. Transcript assembly and quantification by RNA-Seq reveals unannotated transcripts and isoform switching during cell differentiation. Nature biotechnology. 2010;28:511–515. doi: 10.1038/nbt.1621. [DOI] [PMC free article] [PubMed] [Google Scholar]
- 36.Huang da W, Sherman BT, Lempicki RA. Systematic and integrative analysis of large gene lists using DAVID bioinformatics resources. Nature protocols. 2009;4:44–57. doi: 10.1038/nprot.2008.211. [DOI] [PubMed] [Google Scholar]
- 37.Carey MF, Peterson CL, Smale ST. Chromatin immunoprecipitation (ChIP) Cold Spring Harbor protocols. 2009;2009 doi: 10.1101/pdb.prot5279. ppdb prot5279. [DOI] [PubMed] [Google Scholar]
- 38.Raj A, Tyagi S. Detection of individual endogenous RNA transcripts in situ using multiple singly labeled probes. Methods in enzymology. 2010;472:365–386. doi: 10.1016/S0076-6879(10)72004-8. [DOI] [PubMed] [Google Scholar]
Associated Data
This section collects any data citations, data availability statements, or supplementary materials included in this article.