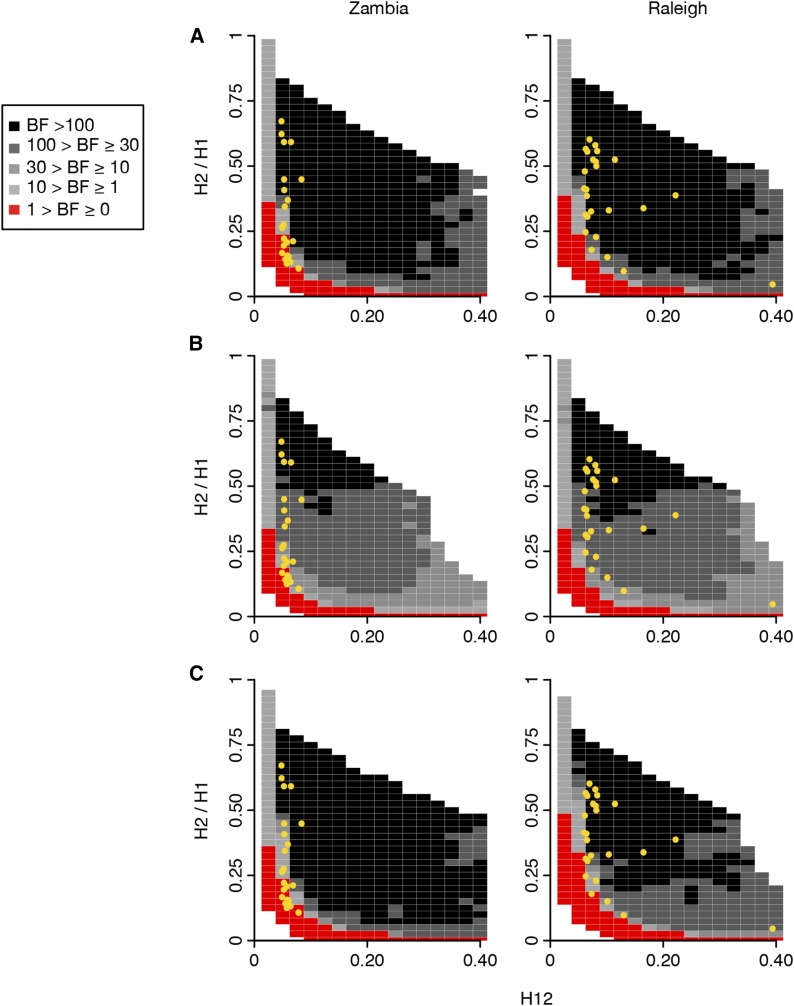
Figure 5.
Range of H12 and H2/H1 values expected under hard and soft sweeps for Zambian and Raleigh data. BFs were calculated for a grid of H12 and H2/H1 values to demonstrate the range of H12 and H2/H1 values expected under hard vs. soft sweeps for the top 25 peaks in the Zambian and Raleigh scans. BFs were calculated by taking the ratio of the number of soft sweep vs. hard sweep simulations that were within a Euclidean distance of 0.1 of a given pair of H12 and H2/H1 values. Red portions of the grid represent H12 and H2/H1 values with stronger support for hard sweeps, while gray portions represent regions of space with stronger support for soft sweeps. Each panel presents the results from 106 hard sweep simulations generated with θA = 0.01 and 106 soft sweep simulations generated with θA = 10. For any colored square, at least 1000 hard and soft sweep simulations match the corresponding pair of H12 and H2/H1 values of the grid. White portions of the grid represent cases where fewer than 1000 simulations match the pair of H12 and H2/H1 values. Simulations were performed in samples of 145 individuals with a constant Ne ≈ 4.8 × 10⁶ demographic model for comparison with the Zambian data and a constant Ne ≈ 2.6 × 10⁶ demographic model for comparison with the Raleigh data. Overlaid on each plot in yellow are the observed H12 and H2/H1 values for the top 25 peaks for each scan. We tested the effect of varying recombination rates on the BF analysis: (A) ρ = 0.5 cM/Mb, and in (B) ρ = 5 cM/Mb. In (A) and (B) H12 was measured in an analysis window centered on the selected site. Panels (A) and (B) show that the H12 and H2/H1 values measured at the top 25 peaks in Zambian data are supported by both hard and soft sweeps, whereas the H12 and H2/H1 values measured in Raleigh are supported by soft sweeps rather than hard sweeps in all scenarios. Varying ρ changes a small number of peaks identified as hard vs. soft sweeps in the Zambian data. These peaks have low H12 values to begin with, making them difficult to distinguish between hard and soft sweeps definitively. In (C), instead of measuring H12 in a window centered on the selected site, the analysis window with the highest H12 value was first identified in a simulation of 100 kb, and then H2/H1 was measured. Here, ρ = 0.5 cM/Mb. In this scenario, a few peaks in the Raleigh data are borderline supported by soft sweeps, but the results in Zambia do not change.

