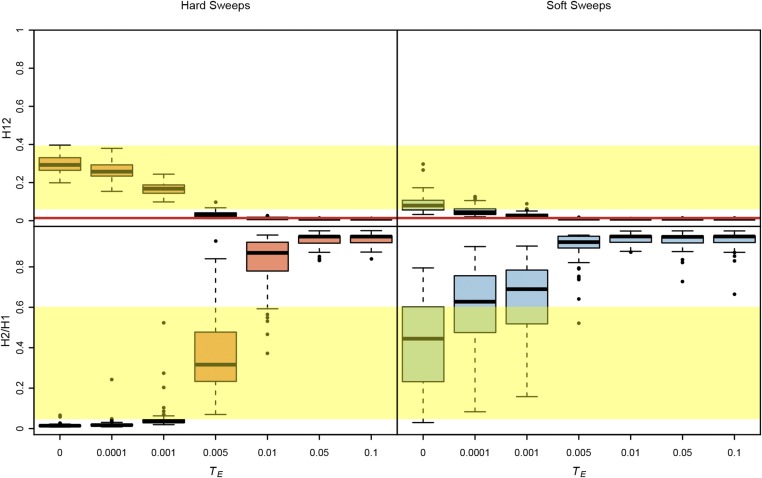
Figure 7.
H12 and H2/H1 measured in sweeps decayed for varying amounts of time. Partial hard and soft sweeps were simulated with s = 10−1 and ρ = 0.5 cM/Mb. All sweeps ended at a frequency of 0.5 when selection ceased. Sweeps were allowed to decay for varying amounts of time after selection ceased (TE), ranging from 0 to 0.1*4Ne generations. Simulations were performed in a sample size of 145 individuals and with a constant Ne ≈ 2.6 × 10⁶ model fit to Raleigh data (see Materials and Methods). Each boxplot is comprised of 100 simulations. The yellow region shows the range of H12 and H2/H1 values observed in Raleigh data at the top 25 peaks. The red line shows the one-per-genome FDR value of H12 measured under neutrality with the Ne ≈ 2.6 × 10⁶ model. In most evolutionary scenarios, hard sweeps cannot produce both high H12 and H2/H1 values, unlike soft sweeps. Hard sweeps that have not decayed for >0.005*4Ne generations have H12 values that are large enough to be differentiated from neutrality. Hard sweeps that have decayed for 0.005*4Ne generations have high H2/H1 values, but the H12 values in this scenario are borderline distinguishable from neutrality. Figure S7 shows additional evolutionary scenarios.

