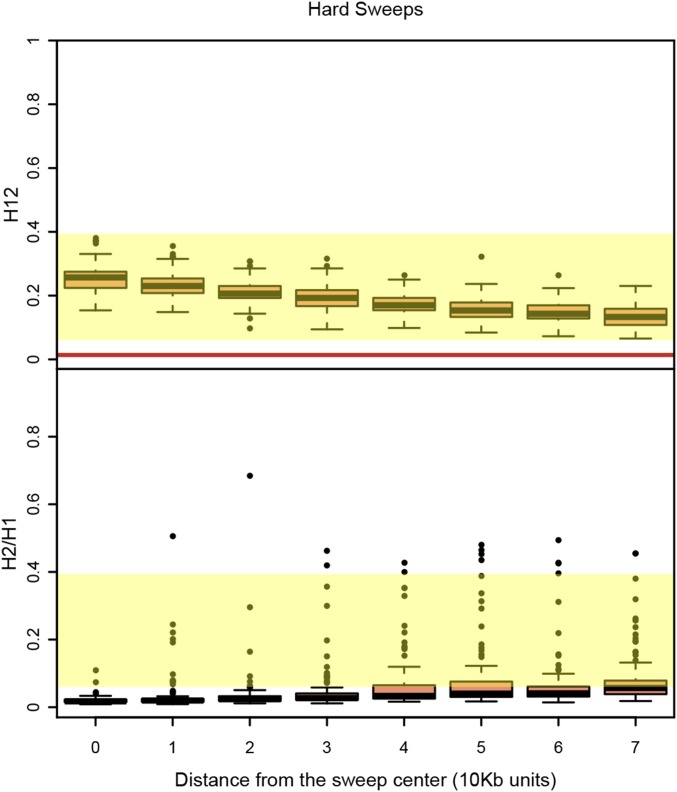
Figure 8.
H12 and H2/H1 measured in hard sweeps at varying distances from the selected site. Partial hard sweeps were simulated with s = 10−2 and ρ = 0.5 cM/Mb. All sweeps were sampled when selection ceased and had a frequency of 0.5. Simulations were performed in a sample size of 145 individuals and with a constant Ne ≈ 2.6 × 10⁶ model fit to Raleigh data (see Materials and Methods). Each boxplot comprises 100 simulations with H12 and H2/H1 values measured in 401 SNP windows centered varying distances away from the selected site. The yellow region shows the range of H12 and H2/H1 values observed in Raleigh data at the top 25 peaks. The red line shows the one-per-genome FDR value of H12 measured under neutrality with the Ne ≈ 2.6 × 10⁶ model. The center of the sweep where the selected site is located generates the highest H12 values. Analysis windows in the shoulders of the hard sweeps further away from the sweep center generate higher H2/H1 values. However, conditioning on the highest H12 value in a peak (defined as a consecutive tract of analysis windows with H12 values greater than the one-per-genome FDR values) results in low H2/H1 values for hard sweeps. Figure S8 shows similar results for complete sweeps and partial sweeps that have decayed for some time.

