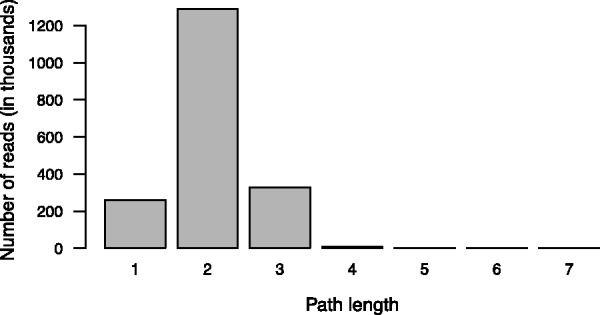
Fig. 4.

The path length distribution for multi-edge-spanning reads that span two or more edges when mapped to the de Bruijn graph by TAG. The X-axis represents the length of multi-edge-spanning read paths (i.e. the number of edges that the multi-edge-spanning reads span) and the Y-axis represents the total number of multi-edge-spanning reads spanning the paths of certain lengths. Paths of length 1 represent the cases when the seed extension in one direction resulted in an alignment of at most 7 bp, and thus were considered insignificant and discarded
