

Abstract
Several prominent neurocomputational models predict that an increase of choice alternatives is modulated by increased activity in the subthalamic nucleus (STN). In turn, increased STN activity allows prolonged accumulation of information. At the same time, areas in the medial frontal cortex such as the anterior cingulate cortex (ACC) and the pre‐SMA are hypothesized to influence the information processing in the STN. This study set out to test concrete predictions of STN activity in multiple‐alternative decision‐making using a multimodal combination of 7 Tesla structural and functional Magnetic Resonance Imaging, and ancestral graph (AG) modeling. The results are in line with the predictions in that increased STN activity was found with an increasing amount of choice alternatives. In addition, our study shows that activity in the ACC is correlated with activity in the STN without directly modulating it. This result sheds new light on the information processing streams between medial frontal cortex and the basal ganglia. Hum Brain Mapp 36:4041–4052, 2015. © 2015 Wiley Periodicals, Inc.
Keywords: decision‐making, basal ganglia, computational modeling, ultrahigh field magnetic resonance imaging, functional magnetic resonance imaging, diffusion weighted imaging
INTRODUCTION
Decision‐making is ubiquitous in everyday life, and has attracted much attention in the empirical and neurocomputational neurosciences [Forstmann et al., 2008; Gold and Shadlen, 2007; Ho et al., 2009]. However, many studies focus on two‐alternative forced‐choice decision‐making tasks, limiting the ecological validity of these studies [Churchland et al., 2008; Churchland and Ditterich, 2012]. To address this issue, recent animal studies have adapted the frequently used binary‐choice random dot motion (RDM) paradigm by increasing the number of alternatives, showing that an increase in choice options prolonged the accumulation of evidence [Churchland et al., 2008]. To incorporate such results in the theoretical framework of decision‐making, quantitative mathematical and neurocomputational models have been developed that make predictions about the latent psychological processes and brain structures involved in multiple‐choice decision‐making [Bogacz and Gurney, 2007; Bogacz et al., 2007; Chau et al., 2014; Churchland et al., 2008; Frank, 2006; van Maanen et al., 2012]. Several of these models focus on information processing in the basal ganglia (BG), and describe the computations of its different structures, including the STN. Despite its small size, the STN is thought to play an important role in action selection due to its unique anatomical position. The STN neurons project to inhibitory neurons in the output nuclei of the BG, and thus STN activity effectively inhibits movements. Furthermore, individual STN neurons project to a wide range of the output nuclei neurons[Parent, 1995] and thus the individual STN neurons are thought to contribute to inhibiting multiple motor plans [Gurney et al., 2001].
The function of the STN has been the subject of several hypotheses. First, it has been proposed that while one action is being selected, the STN inhibits all actions. As only the activity of neurons representing the winning action can overcome the STN inhibition, the STN activity results in “surround inhibition” of the other actions [Mink, 1996]. Second, it has been suggested that when conflicting information is present that supports more than one choice, STN neurons selective for all the supported choices become active. This result in an increase in inhibition of all actions, which postpones movement initiation until the conflict has been resolved [Frank, 2006]. As predicted by this theory, using deep brain stimulation, it has been demonstrated that the STN responds to conflict and that this is reflected in an increased response threshold [Cavanagh et al., 2011; Coulthard et al., 2012; Frank et al., 2007; Green et al., 2013; Zavala et al., 2014]. Third, it has been suggested that activity in the BG approximates a decision procedure, known as the Multiple Sequential Probability Ratio Test (MSPRT) [Baum and Veeravalli, 1994], and computes the probabilities that different actions will be appropriate according to Bayes' theorem [Bogacz and Gurney, 2007]. This model suggests that the STN effectively computes the normalization term in Bayes' theorem, which ensures that probabilities of all actions add up to 1. In this model, the STN fulfills the functions assigned to it by the surround inhibition and conflict theories. When the probability of one action increases, the STN ensures that the probabilities of other actions decrease (to maintain a sum of 1). Furthermore, when two actions receive equal support, the STN ensures that their probabilities do not exceed 0.5, so that neither of the action probabilities can exceed a higher threshold of confidence until the conflict is resolved.
Each of the above theories predicts that STN activity during decision‐making should increase with the number of choice alternatives. With more alternatives competing for selection, more STN neurons will be selective for these alternatives, inhibiting other options; there will be higher conflict and a prolonged need for movement inhibition until the conflict is resolved; and there will be a need for more extensive normalization of action probabilities. Here, by simulating the MSPRT model we generated predictions on how the activity in the STN and the observed behavior respond to the number of choice alternatives in a multiple‐choice RDM task. These MSPRT predictions were then tested by acquiring 7Tesla (T) functional Magnetic Resonance Imaging (MRI) data while 15 participants complete a multiple‐choice decision‐making RDM task with three, five or seven alternatives (see Fig. 1).
Figure 1.
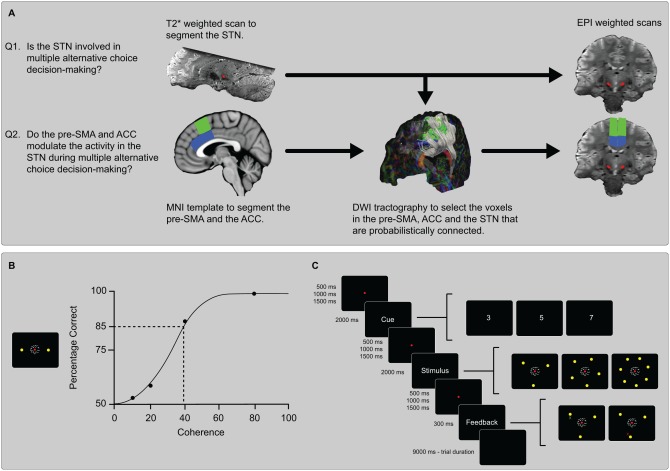
The analysis pipeline and methods. (A) Using individually segmented STN masks as a ROI in a standard fMRI analysis the question is addressed whether the STN is involved in multiple‐alternative choice decision‐making. To answer the question whether the pre‐SMA or ACC modulate the activity in the STN the BOLD signal is extracted per trial in the three ROI's. Using DWI tractography only the voxels that are probabilistically connected between the pre‐SMA or ACC and STN are selected. (B) The level of coherently moving dots was determined per individual. This was done by interpolating from the psychometric curve produced by the proportional‐rate diffusion and selecting the coherency level that was associated with 85% accuracy. (C) Each trial lasted for nine seconds. The duration of the fixation dot was jittered and varied between 500, 1,000, and 1,500 ms. The cue was always valid and the locations of the targets did not vary within or between subjects. A response was considered correct if the final location of the joystick was within 20° of the correct target. If the response was outside of this window the response was considered incorrect. The participants were aware of this response window and were instructed to respond as fast and as accurate as possible. Seven percent of the trials were neutral trials in which a fixation dot was displayed for 9 s.
The information processing in the BG is thought to be modulated by areas such as the pre‐supplementary motor area (pre‐SMA) and the ACC. These two structures are known to be involved in perceptual decision‐making [Keuken et al., 2014b; Ridderinkhof et al., 2004] and are anatomically connected to the STN [Keuken et al., 2012; Lambert et al., 2012]. Previous work has shown that the pre‐SMA modulates the response threshold [Forstmann et al., 2008], while the ACC is implicated in switching between response regimes [vanMaanen et al., [Link]]. Taking these anatomical and functional findings into account, these two areas may have an important modulatory role on the STN activation in multiple‐choice decision‐making.
This study also addressed a question of the directionality of the connection between cortical and subcortical areas. More specifically, we tested the functional and effective connectivity between the pre‐SMA, ACC, and STN during decision‐making using a novel multimodal combination of 7T structural and functional MRI, Diffusion Weighted Imaging (DWI) data, and AG modeling [Waldorp et al., 2011] (see Fig. 1A). AG is a type of graphical modeling that enables the testing of the presence and nature of functional and effective connections between nodes or regions of interest (ROI).
EXPERIMENTAL PROCEDURES
Participants
Fifteen healthy participants (nine female, mean age = 23.7, SD age = 1.58) were scanned. All participants had normal or corrected to normal vision and no history of neurological or psychological disorders. All participants were right‐handed, as confirmed by the Edinburgh Inventory [Oldfield, 1971]. The study was approved by the local ethical committee of the Max Planck Institute for Human Brain and Cognitive Sciences in Leipzig. All participants gave written informed consent and received a monetary reward for their participation.
General Procedure
The experimental session lasted for two hours, during which the participant underwent a behavioral session and a session in a 7T MRI scanner. The behavioral sessions consisted of a calibration procedure to determine the individual subjects' sensitivity to the random‐dot motion stimulus. This entailed a binary choice random‐dot motion task where the coherence was varied between 0, 10, 20, 40, and 80%. The calibration procedure started with a practice block of 20 trials to ensure that the participant understood the task and got familiar with using a joystick. The actual calibration task was similar to the practice block but incorporated more trials, that is, 400 trials in total, resulting in 80 trials per coherence level.
After the calibration task, the participants performed one short practice block of 54 trials of the multiple‐choice random‐dot motion task. Once this was completed, the participant was placed in the scanner and the practice block was repeated to familiarize with the scanner compatible joystick, which was different than the joystick used in the calibration session. Finally, the participant started with the actual experiment, which consisted of two blocks of 100 trials each.
Random‐Dot Motion Paradigm
The stimuli were displayed using Presentation (version 16.1) and consisted of white dots on a black background with a size of 3 × 3 pixels. The dots moved within a circle with a diameter that reflected a visual angle of 5°, with a speed of 5°/s. The overall dot density was 16.7 dots/deg2/s. On the first three frames of the motion stimulus, the dots were located in random positions. For each of these frames, the dots were repositioned after two subsequent frames. The dots were generated in a similar manner as the Variable Coherence Random‐Dot Motion library (http://www.shadlen.org/Code/VCRDM). The participant was instructed to move a joystick toward one of the targets to which the direction of motion was perceived. For the binary calibration session two targets were placed at the left and right side of the cloud of dots. For the multiple‐choice decision‐making task, there were three, five, and seven targets equally spaced around the moving dot cloud. The locations of the targets did not vary within or between subjects. A response was considered correct if the final location of the joystick was within 20° of the correct target. This response window was equal for the two, three, five, or seven choice alternatives and assured that any difference in response time or accuracy between the choice alternatives was not due to motor response difficulty. If the response was outside of this window, the response was considered incorrect. The participants were made aware of this response window and were instructed to respond as fast and as accurate as possible.
Calibration Coherence Level
Using the proportional‐rate diffusion model, the level of coherence was determined for each individual separately at a level that corresponded to an accuracy level of 85% correct for two alternatives [Palmer et al., 2005]. This coherence level was determined by interpolating from the psychometric curve produced by the proportional‐rate diffusion model. This value was then used for the ensuing multiple‐choice random‐dot motion task in the scanner to ensure equal task difficulty across participants [Winkel et al., 2014]. See Figure 1B for an illustration of how the level of coherence was determined using the psychometric curve derived from proportional‐rate diffusion model fit. Observing the behavior of the first participant during the fMRI session it became clear that the determined coherence was too difficult and in line with previous work [van Maanen et al., in press]; therefore, the individual determined coherences were multiplied with a factor of 1.3 for the ensuing participants. For example, if a coherence level of 10% was determined to correspond to an 85% accuracy level, a coherence level of 13% was used in the scanner. This multiplication factor was decided on arbitrarily. Each trial lasted for 9 s, corresponding to three MR volumes per trial. If the participant responded within 200 ms of stimulus onset, the participant received “Too Fast” as feedback. If the participant responded between 1,750 and 2,000 ms, the participant received “Too Slow” as feedback. If the participant failed to respond within 2,000 ms, the participant received “No Response” as feedback. Figure 1C illustrates the layout and timing of a single trial.
MRI Data Acquisition
All MRI data were acquired using a whole body 7T scanner (MAGNETOM, Siemens Medical Solutions, Erlangen, Germany) using a 24 channel head coil (Nova Medical). All subjects underwent three separate MRI sessions, one for the structural T1 and T2* weighted anatomical scans, one session for the DWI scans, and finally a functional MRI session which was preceded by the behavioral calibration session.
Structural Scans
The structural data that were used to segment the ROI's consisted of three sequences: a whole brain MP2RAGE [Marques et al., 2010]; a zoomed MP2RAGE and a zoomed FLASH [Haase et al., 1986]. The whole brain MP2RAGE had 240 sagittal slices with an acquisition time of 10:57 min (repetition time (TR) = 5,000 ms; echo time (TE) = 2.45 ms; inversion times TI1/TI2 = 900/2,750 ms; flip angle = 5°/3°; bandwidth = 250 Hz/Px; voxel size = 0.7 mm isotropic). The whole brain MP2RAGE had 240 sagittal slices with an acquisition time of 10:57 min (repetition time (TR) = 5,000 ms; echo time (TE) = 2.45 ms; inversion times TI1/TI2 = 900/2,750 ms; flip angle = 5°/3°; bandwidth = 250 Hz/Px; voxel size = 0.7 mm isotropic). The zoomed MP2RAGE slab consisted of 128 slices with an acquisition time of 9:07 min (TR = 5,000 ms; TE = 3.71 ms; TI1/TI2 = 900/2,750 ms; flip angle = 5°/3°; bandwidth = 240 Hz/Px; voxel size = 0.6 mm isotropic) and was acquired to facilitate the registration of the FLASH image to the whole brain MP2RAGE. The zoomed FLASH slab consisted of 128 slices with an acquisition time of 17:18 min (TR = 41 ms and three different echo times (TE): 11.22/20.39/29.57 ms; flip angle = 14°; bandwidth = 160 Hz/Px; voxel size = 0.5 mm isotropic). Both of the slab sequences consisted of axial slices covering the midbrain. All MP2RAGE and FLASH scans are freely available (http://www.nitrc.org/projects/atag_mri_scans) [Forstmann et al., 2014].
Diffusion Weighted Imaging
The DWI scans were used to select only those voxels within the ACC, pre‐SMA, and the STN ROI's which were connected with one and other according to probabilistic tractography. The DWI data was acquired using spin‐echo echo planar imaging (EPI) [Heidemann et al., 2010] and consisted of 100 axial slices with a total acquisition time of 54:16 min (TR = 11.3 s, TE = 67 ms, voxel size = 1.0 mm isotropic, GRAPPA acceleration factor = 3, diffusion weighting was isotropically distributed along 60 directions, b‐value = 1,000 s/mm2, AV= 4, for each repetition 7 images with no diffusion weighting (b0) was acquired).
Functional MRI
The fMRI images were acquired using a zoomed Field of View (FOV) covering a similar FOV as the zoomed anatomical slabs [Heidemann et al., 2012] as previously used[Forstmann et al., 2008]. The two EPI runs consisted of 36 slices with an acquisition time of 15:17 min per run (EPI 2D, TR= 3,000 ms, TE= 19 ms. 36 slices, voxel size= 1.5 mm isotropic, phase encoding direction r → l, GRAPPA acceleration factor 3. Number of pulses 300, bandwidth 1,056 Hz/px, echo spacing 1.05 ms, and partial Fourier 6/8). This was followed by the acquisition of a B0 field map helping to correct geometric distortions due to inhomogeneity's in the B0 field. The FOV of the field map was identical as the FOV for the EPI with an acquisition time of 4:53 min (TR = 1,500 ms, ΔTE = 1.02 ms, 27 slices, voxel size = 2.0 mm isotropic, phase encoding direction r → l).
ROI Segmentation for Ancestral Graph Model
The STN segmentation was done on the individual FLASH images according to the previously described segmentation protocol [Forstmann et al., 2008, 2012; Keuken et al., 2013, 2014a]. The resulting mean (SD) STN inter‐rater volume was 62.25 (15.19) mm3. The mean (SD) Cohen's Kappa was 0.74 (0.09) indicating a good inter‐rater reliability. The pre‐SMA was identified using the coordinates reported by Johansen‐Berg et al. [2004]. The ACC was defined as the gray matter tissue between the pre‐SMA and the Corpus Callosum. The posterior border of the ACC was based on the posterior border of the pre‐SMA and the anterior border was based on the most anterior part of the Corpus Callosum. This anterior border was chosen due to the coverage of the zoomed EPI, which for all participants at least covered the entire anterior part of the Corpus Callosum. The anterior border excluded the most frontal and the subgenual part of the ACC. Based on the functional meta‐analysis of the ACC this is not a confound as most reported activations relevant for the current task are in the more posterior region of the ACC which are included in the ACC mask [Ridderinkhof et al., 2004]. The pre‐SMA and the ACC masks were segmented on the 0.4 mm3 MNI template provided by the CBS High‐Res Brain Processing Tools (http://www.cbs.mpg.de/institute/software/cbs-hrt/index.html). The masks were registered to the individual whole brain MP2RAGE scan using a linear 12 DOF automatic registration algorithm implemented in MIPAV. Since both the pre‐SMA and ACC masks are coordinate‐based, no inter‐rater value was computed.
Functional MRI Analyses
To investigate whether the STN is involved in multiple‐choice decision‐making, single trial betas were acquired by modeling the data according to the Least Squares‐Separate as proposed by Mumford et al. [2012] (see Jahfari et al. [2011] for a similar approach). The single trial RT was used as a coregressor to ensure that any effect found in the STN was not solely due to differences in motor response. The fMRI data was B0 unwarped, motion corrected, high‐pass filtered at 100 s, and slice‐time corrected. All analyses were done in individual space and a statistical threshold of P = 0.01 (uncorrected) was used. To preserve the spatial resolution and anatomical specificity, no smoothing was applied. Finally, using featquery, the mean beta of the entire STN ROI was extracted, per hemisphere, per trial, and used in a linear mixed effect model. All fMRI analyses were done using FEAT (distributed in FSL version 5.0.1) and focused on stimulus‐locked presentation.
Functional MRI Single‐Trial Analyses
For the AG analysis, the same single trial betas were used as described above but now the ROI's also included the ACC, and the pre‐SMA. To select only those voxels in the STN, ACC, and pre‐SMA that were anatomically connected with high probability, the following steps were computed. First, a single image without diffusion weighting (b = 0) was extracted from the DWI data and nonbrain tissue was removed using BET to create a brain‐mask which was used in the subsequent analyses. Second, DTIFIT was applied to fit a tensor model at each voxel of the data. Probabilistic tractography using bedpostx (distributed in FSL version 5.0.1) and subsequent seed‐based classification were performed using the STN, pre‐SMA, and ACC masks per hemisphere using 5,000 samples, estimating 2 fibers per voxel, and a curvature threshold of 0.2 [Behrens et al., 2003]. Subsequent classification masks were thresholded at 50 and were used as a ROI for the AG analysis. Finally, using featquery and the classification masks obtained from probabilistic tractography, the average beta values per probabilistically connected ROI, per trial, and per subject, were extracted.
MSPRT
Optimal behavior in perceptual decision‐making is defined here as minimizing the mean response time at a fixed level of accuracy [Draglia et al., 1999; Wald and Wolfowitz, 1948]. Such behavior is achieved in the MSPRT model by continuously calculating for each alternative the posterior probability that that alternative is the correct answer given the observed stimuli. This can be expressed with Bayes' rule, which quantifies the posterior probability of hypothesis Hi that alternative i is the correct alternative given the set of motion samples S as the relative likelihood of the motion (S) under hypothesis Hi compared to the sum of the likelihoods under all competing hypotheses:
The posterior probability of each alternative is updated at each time step until a predetermined response criterion (θ) is surpassed. This determines the moment of choice, with the choice outcome determined by the highest posterior probability at this time. Changes in the posterior probabilities of each alternative are mediated by two mechanisms (see also [van Maanen et al., 2012] for a similar model): (1) The number of alternatives influences the posterior probabilities of each alternative because the likelihood of each alternative is scaled by the sum of likelihoods. (2) The spatial proximity between alternatives influences the posterior probabilities because spatially close alternatives receive similar evidence from the stimulus.
Following Bogacz and Gurney [2007], we implemented the MSPRT model in a neural network model, to study how changes in cortical input layers affected STN activation. For the network to reach a decision, evidence for the various choice alternatives is required as input. The MSPRT model assumes that evidence integration takes place in cortical neural populations that each code for one choice alternative:
Here we assume a discrete representation of time. At each time step t in the interval [1,T] an evidence sample is accumulated that represents the evidence for one choice alternative (i) at that time (with ). For example, in the task described in this article, xi(t) could indicate a location on a tuning curve in motion sensitive areas in the brain (e.g., [Jazayeri and Movshon, 2006; van Maanen et al., 2012]). If motion is perceived that provides evidence for choice alternative i, then xi(t) is high, yielding strong evidence accumulation.
The neural network implementation of MSPRT makes a choice by inverting the signal from the cortical integrators in inhibitory signals to the output nuclei. This inhibitory signal is combined with a diffuse excitatory signal from STN that activates the output nuclei (see [Bogacz and Gurney, 2007; Gurney et al., 2001] for details):
Because the default operation of the output nuclei (O) is to inhibit possible actions, inhibition of the output nuclei themselves leads to activation of target structures related to possible actions. In particular, as soon as the activation of one of the output nodes falls below a particular threshold, an action is performed (θ *, note that this differs from the threshold θ used to set the response criterion for the posterior probabilities).
Under the assumption that the BG implement the MSPRT [Draglia et al., 1999], the activation of STN should be [Bogacz and Gurney, 2007]:
Thus, the activation of STN at time t is independent of the choice alternatives, and depends on the strength of the cortical integrators.
We simulated behavioral responses and STN activation under the hypothesis that there were N independent cortical integrators. The correct alternative (without loss of generality, this is referred to as alternative 1) was represented by a signal taken from a sampling distribution with a mean μ 1 = 1. The mean signal in the remaining N – 1 cortical integrators drops with spatial proximity to emulate the experimental design deployed here (Fig. 1C). Specifically, the signal of each distractor is determined by the angle to the correct alternative, using a Von Mises distribution function [van Maanen et al., 2012]:
where I o(x) is the modified Bessel function of order 0, κ the precision of the Von Mises function, and φi the angle between alternative i and the correct alternative. To ensure that all signals are proportional to the signal of the correct alternative (ì 1 = 1), the signals are normalized (this also cancels out the Bessel function):
In our simulations, κ was set at κ = 0.3, the standard deviation of all cortical integrators was σi = 0.25, and the shared response threshold θ * was set at θ* = 0.8.
We performed 50,000 simulated trials with these parameters. In each simulation, we computed the values for CXi and STN on the time interval [0, 500], and recorded the first time step when the value of Oi fell below θ *. Also, we recorded which alternative was the first to be below θ * (i.e., which choice was made, Fig. 2A), and what was the value of STN at this time step (Fig. 2C). R code implementing this simulation is available as Supporting Information.
Figure 2.
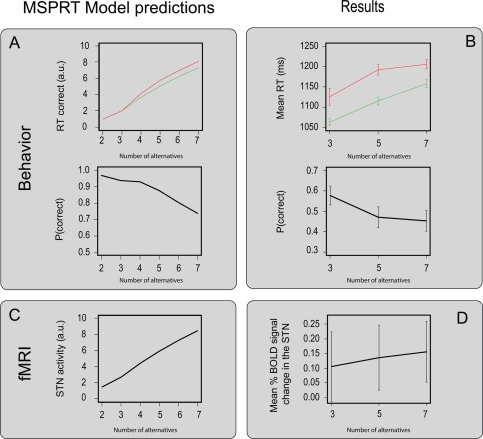
The MSPRT predictions and the behavioral and fMRI results. (A) The MSPRT predictions for the RT and accuracy. (B) The behavioral results that were normalized within subjects and averaged over the entire group. (C) The MSPRT predictions for the BOLD signal change in the STN. (D) The mean percent BOLD signal change in the bilateral STN, normalized within subjects and averaged over the entire group. The red line corresponds to the incorrect responses; the green line corresponds to the correct response. Error bars reflect the standard error.
Ancestral Graph Analysis
To investigate whether the pre‐SMA and the ACC act as modulating cortical areas for the STN, AG analysis was employed. AG is a type of graphical modeling which allows testing the presence and nature of functional connections between nodes or ROI's. We tested AG models with two different types of connections. These connections are undirected and directed. Although the AG model allows for bilateral connections this was not feasible with the network configuration that we tested [Waldorp et al., 2011].
An undirected connection between two nodes reflects two nodes being functionally correlated but does not causally influencing each other (represented as the following connection: A – B). Directed connections between two nodes reflect two nodes being functionally correlated while additionally one node causally influences the other (A → B) [Jahfari et al., 2011; Waldorp et al., 2011]. These different connections are determined by testing the likelihood that the distribution of activation values (e.g., BOLD) across trials and ROIs is consistent with a distribution with particular conditional dependencies. The AG analysis allowed us to test whether the STN is functionally connected (undirected connection) to the pre‐SMA and ACC and whether these connections are also effectively connected (directed connection) [Waldorp et al., 2011]. Note that there is no prior preference for a directed or an undirected graph in the AG method [Pearl, 2000]. This is because directed and undirected segments of the graph are associated with different properties of the covariance matrix between the beta distributions of the three ROIs. To illustrate this, a simulation was run in which 200 observations were sampled from three nodes in a network. The simulated network is similar in architecture to the tested brain network of the ACC, pre‐SMA, and STN. The covariance structure of the observations is either “random,” “directed,” or “undirected,” and we fitted a directed as well as an undirected AG to these data. Supporting Information Figure S1 shows the proportion of simulations in which the undirected model is preferred versus the standard deviation of the data, averaged over 1,000 simulations. The preference is based on the AIC values of the directed and undirected models. Supporting Information Figure S1 illustrates that the models nicely disambiguate between situations in which the covariance structure in the data is clear. If there is no covariance in the data (the “random” data), the AICs are similar, and the preferred model is not biased toward directed‐ or undirectedness.
The 12 AG networks that were tested are shown in Figure 3. To be able to fit the AG models for each participant, we computed single‐trial beta weights of the BOLD response (as described above), for the left and the right pre‐SMA, the left and the right ACC, and left and right STN, respectively. Next, we fitted the graph models in Figure 3 to the data and computed the AIC values [Waldorp et al., 2011] and Akaike weights [Wagenmakers and Farrell, 2004]. Finally the evidence ratios (the ratio of Akaike weights) were computed to determine the probability that the data was generated under any of the alternative models that were tested [Wagenmakers and Farrell, 2004].
Figure 3.
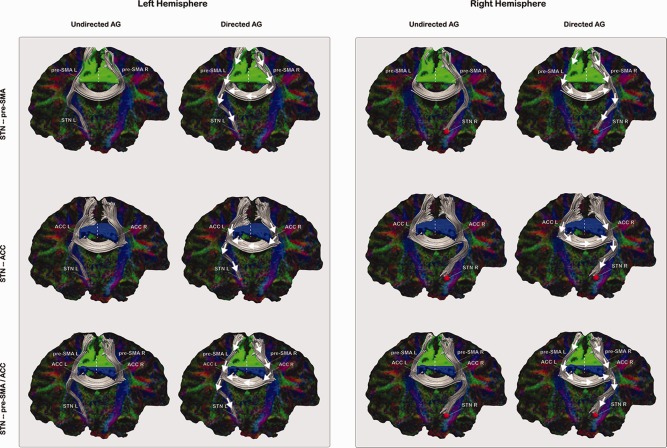
The undirected and directed AG models. The first and third column shows the six tested AG models that incorporate the hypothesis of functional connectivity. These models have undirected connections between the cortical nodes and the STN, which would mean that for instance the pre‐SMA and the STN would be correlated but do not directly influence each other. The second and fourth column shows the six tested AG models that incorporate the hypothesis of effective connectivity. These models have directed connections from the cortical nodes toward the STN, which would mean that for instance the pre‐SMA would directly influence the activity in the STN. The white arrows indicate the direction of the connection. In red the individual segmented STN, in green the coordinate based pre‐SMA mask and in blue the coordinate based ACC mask. Plots in this figure are constructed using the actual DWI tractography data from a representative subject. Visualization was done using trackvis (http://trackvis.org).
RESULTS
MSPRT Predictions
The MSPRT model simulation predicts that increasing the number of choice alternatives prolongs the decision time, decreases accuracy, and increases the BOLD response in the STN. Figure 2A illustrates the predicted behavior, and Figure 2C illustrates the dependence of STN activity on the number of alternatives, based on a simulation of the MSPRT model. See Supporting Information 1 for R code implementing this MSPRT model simulation.
Behavioral Results
The 15 participants performed a multiple‐alternative RDM task in the MRI scanner for two blocks of 100 trials each (see Fig. 1C). The reaction time (RT) data was normalized for each participant using a z‐transformation and all data points smaller or larger than 2.5 were removed from the analysis. This resulted in an exclusion of 1.76% of the total amount of data. A two‐way repeated measure ANOVA showed that with more alternatives the RT increased (F (2,13)=9.69, P<0.001) and that participants responded slower for incorrect trials compared to correct trials (F (1,14)=8.25, P=0.003). There was no interaction between the number of alternatives and accuracy on RT. Post hoc tests, using a Bonferroni correction for multiple comparisons, showed that the mean RT for the three groups all differed significantly (three versus five alternatives: t (14)=4.89, P<0.001; three versus seven alternatives: t (14)=6.69, P<0.001; five versus seven alternatives t (14)=3.69, P=0.007). For response accuracy a separate two‐way repeated measure ANOVA showed that with an increase of alternatives participants were less accurate (F (2,13)=76.41, P<0.001).
In sum, as expected, participants become slower and less accurate with an increasing number of choice alternatives. At the same time, slower RTs are observed on incorrect compared to correct trials (see Fig. 2B).
fMRI Results
To investigate whether the STN is involved in multiple‐choice decision‐making, single trial betas were extracted from the individual STN. To ensure that the findings in the STN were not solely due to differences in motor response, the single trial RT was used as a coregressor in the fMRI analysis. The percentage BOLD signal change in the left and right STN for choice versus neutral trials was significantly above zero (left STN: t (236.82)=−3.81, P<0.001, right STN: t (236.02)=−2.86, P=0.005). These findings show that the STN is bilaterally involved in perceptual decision‐making. Using a linear mixed‐effect model with participant as a random effect and hemisphere as a fixed effect, there was a significant increase of percentage BOLD signal change in the STN with an increase of choice alternatives (t(3,941)=2.12, P=0.034). There was no significant effect of accuracy (t(3,941)=1.03, P=0.30) or hemisphere (t(14)=−0.67, P=0.51; see Fig. 2 panel C for the MSPRT BOLD predictions and panel D for the BOLD results for the STN). There was no interaction between accuracy and the number of alternatives (t(3,941)=−1.50, P=0.13). To exclude the alternative hypothesis that the observed increase of BOLD was not specific to the STN, a similar analysis was computed on a combined mask of the ACC and pre‐SMA. This analysis showed no main effect of the number of choice alternatives on the percentage BOLD signal change in these cortical regions (t(7,911)=−1.65, P=0.10). A similar analysis for only the ACC also showed no main effect of the number of alternatives on the percentage BOLD signal change (t(7,911)=−0.96, P=0.34).
In sum, both the behavioral and fMRI results corroborate the hypothesis that the STN is sensitive to the number of choice alternatives.
Ancestral Graph Analysis
To investigate whether the pre‐SMA and the ACC act as modulating cortical areas for the STN, the undirected and direct AG models shown in Figure 3 were fit to the data. From the model fits the Akaike Information Criterion (AIC) values were computed. The AIC values for both direct and undirected models were used to calculate the evidence ratio, which reflects the probability that the data was generated by that specific model given the other models that were tested.
The AIC evidence ratio revealed that the six undirected models are always preferred over the six directed models (Table 1). These results show that there is no evidence that the pre‐SMA or the ACC directly modulates the STN. Additional analyses showed that the undirected STN—ACC model fits the data better than the undirected STN—pre‐SMA model or the undirected STN—pre‐SMA and ACC model (left: summed AIC weight 1.0, preferred for 8 out of 15 participants; right: summed AIC weight 1.0, preferred for 9 out of 13 participants—two participants did not have any voxels in the left pre‐SMA that were probabilistically connected to the right STN). Therefore, networks involving the right STN are tested in only 13 participants. In sum, this result shows that the ACC and STN are correlated, but without clear evidence that the ACC directly influences the STN.
Table 1.
The results of the ancestral graph analysis
| AIC evidence ratio | ||
|---|---|---|
| Directed | Undirected | |
| 1) L STN—pre‐SMA | 0.0 (0) | 1.0 (15) |
| 2) L STN—ACC | 0.0 (1) | 1.0 (14) |
| 3) L STN—pre‐SMA/ACC | 0.0 (3) | 1.0 (12) |
| 4) R STN—pre‐SMA | 0.0 (1) | 1.0 (12) |
| 5) R STN—ACC | 0.0 (0) | 1.0 (13) |
| 6) R STN—pre‐SMA/ACC | 0.0 (5) | 1.0 (8) |
According to the DWI voxel selection, two participants did not have any voxels in the left pre‐SMA that were probabilistically connected to the right STN. Therefore, networks involving the right STN are tested only in data of 13 participants.
The summed evidence ratios (the ratio of the Akaike weights) for the directed and undirected models across all the participants. AIC evidence ratios can be anywhere between 0 and 1 and reflect the normalized probability of one model being more likely than the other tested model. Between brackets is the number of participants that favored that specific model over the other model
DISCUSSION
Using a similar paradigm as Churchland et al. [2008] in primates, this study shows that the STN is involved in multiple‐alternative perceptual decision‐making, in line with the computational models. The behavioral data and the 7T fMRI BOLD results for the STN activity support the MSPRT predictions: both the reaction time and the STN's BOLD signal increased with the number of choice‐alternatives, whereas accuracy decreased with the number of alternatives.
The current findings support the hypothesis that the STN functions as a general brake mechanism when there is increased choice difficulty in perceptual decision‐making. Based on current and previous results, it is possible that the brake function of the STN is a general mechanism, independent of the perceptual decision‐making domain [Florio et al., 2001; Wylie et al., 2010]. Such an interpretation is supported by previous functional MRI and electrophysiological work that has attributed a pivotal role to the STN in solving the speed‐accuracy trade‐off, response inhibition, and task switching, all proposed via the mechanism of braking the motor output [Aron et al., 2007; Bogacz et al. 2010; Cavanagh et al., 2011; Forstmann et al., 2012; Frank et al., 2007; Green et al., 2013; Jahfari et al., 2011; Mansfield et al., 2011; Zavala et al. 2013; Zavala et al., 2014]. We speculate that this brake mechanism reflects an increasing decision threshold, in line with previous work [Cavanagh et al. 2011; Frank et al., 2015; Green et al., 2013; Mansfield et al., 2011]. To directly investigate the role of the STN in the setting of the decision threshold, Green et al. [2013] used a SAT manipulation while stimulation the STN with DBS on or off. Their results showed that when stimulating the STN with DBS, the response threshold was less influenced by the SAT indicating that indeed the STN is involved in setting the decision‐threshold [ Bogacz et al., 2010; Heitz 2014; Zavala et al. 2013].
The combination of DWI and AG analysis was used to test whether a cortico‐subcortical structural network was functionally involved in perceptual decision‐making, and more specifically, whether there was any evidence for the cortical regions directly influencing the STN. Results from the AG analysis provide no evidence for a directional functional influence of the ACC on the STN, but confirms that the activity of these two regions is correlated during perceptual decision‐making. The function of the ACC has been related to performance monitoring [Ridderinkhof et al., 2004; van Maanen et al., 2011]. More specifically, it has been proposed that the ACC detects situations where errors are likely to occur, and thus more attention is required [Botvinick et al., 2001; Carter et al., 1998]. The current findings suggest that both the ACC and the STN are involved in perceptual decision‐making: however, they may implement different functions. The ACC may help to increase attention during more difficult situations, that is, more choice alternatives, while elevated STN activity may be related to an increased need to withhold a response. This would allow more information to be accumulated during multiple‐alternative decision‐making, increasing the likelihood of selecting the correct response.
There are some limitations that need to be addressed. The first limitation is that while we used the MSPRT model to predict the involvement of the STN in multiple‐choice decision‐making, we did not actually fit the model to the data. The reason for this was the relative low number of trials in total and few errors in the three choice alternative condition. Fitting a relatively complex model as the MSPRT to the data would become unreliable because the uncertainty around the estimated model parameters would be substantial. For these reasons, we decided for a simulation analysis using the MSPRT model instead. Another limitation that follows from not fitting the MSPRT model to the data is that it does not allow for a comparison between different theoretical models regarding the STN in decision‐making. Three prominent theories (action inhibition theory [Mink, 1996], the reduction of conflict [Frank, 2006], or the computation of the normalization term in Bayes theorem [Bogacz and Gurney, 2007]) all predict that the STN becomes more active with more choice alternatives. To be able to distinguish between these three theoretical models, a future study is needed where the MSPRT predictions can be fitted to the actual data.
Another limitation is related to the AG model. The networks that were tested incorporate direct structural connections between the ACC and pre‐SMA to the STN. The hypothesis was that cortical areas (ACC and pre‐SMA) would modulate activity in the STN. The results show that there is an undirected AG connection between the ACC Heitz et al. 2014; and the STN. Given the nature of this undirected connection, it is possible that both the ACC and the STN directly influence a hidden node that was not captured in the a priori hypothesized networks.
In conclusion, by means of the excellent spatial resolution and sensitivity provided by ultrahigh field MRI and fMRI, the MSPRT predictions regarding the involvement of the STN in multiple‐alternative decision‐making were confirmed. When the number of alternatives increases task difficulty, the STN becomes more active. To the best of our knowledge, this is the first study to show the functional role of the STN in multiple‐choice decision‐making using fMRI [see de Hollander et al., 2015 for a review on fMRI activation reported in the STN].
The results support the view that the STN functions as a brake mechanism, thereby facilitating the accumulation of more evidence for the choice at hand. Additionally, using a novel combination of DWI, fMRI, and AG modeling, it was shown that the ACC correlates with, but no evidence was found that it directly modifies the activity in the STN during multiple‐choice decision‐making.
Supporting information
Supporting Information Figure 1
Supporting Information
ACKNOWLEDGMENTS
The authors would want to thank Lourens Waldorp for the constructive discussions regarding the Ancestral Graph modeling. M.C.K., A.S., and B.U.F. acquired data, L.v.M. and R.B. MSPRT simulations, M.C.K., L.v.M., R.B., A.S., J.N., R.T., and B.U.F. conceived and designed experiments.
Max C. Keuken and Leendert Van Maanen contributed equally to this work.
REFERENCES
- Aron AR, Behrens TE, Smith S, Frank MJ, Poldrack RA (2007): Triangulating a cognitive control network using diffusion‐weighted magnetic resonance imaging (MRI) and functional MRI. J Neurosci 27:3743–3752. [DOI] [PMC free article] [PubMed] [Google Scholar]
- Baum CW, Veeravalli VV (1994): A sequential procedure for multihypothesis testing. IEEE Trans Inf Theory 40:1997–2007. [Google Scholar]
- Behrens T, Johansen‐Berg H, Woolrich MW, Smith SM, Wheeler‐Kingshott C, Boulby PA, Barker GJ, Sillery EL, Sheehan K, Ciccarelli O (2003): Non‐invasive mapping of connections between human thalamus and cortex using diffusion imaging. Nat Neurosci 6:750–757. [DOI] [PubMed] [Google Scholar]
- Bogacz R, Gurney K (2007): The basal ganglia and cortex implement optimal decision making between alternative actions. Neural Comput 19:442–477. [DOI] [PubMed] [Google Scholar]
- Bogacz R, Usher M, Zhang J, McClelland J (2007): Extending a biologically inspired model of choice: Multi‐alternatives, nonlinearity and value‐based multidimensional choice. Philos Trans B 362:1655 [DOI] [PMC free article] [PubMed] [Google Scholar]
- Bogacz R, Wagenmakers EJ, Forstmann BU, Nieuwenhuis S (2010): The neural basis of the speed–accuracy tradeoff. Trends Neurosci 33:10–16. [DOI] [PubMed] [Google Scholar]
- Botvinick M, Carter C, Braver T, Barch D, Cohen J (2001): Conflict monitoring and cognitive control. Psychol Rev 108:624–652. [DOI] [PubMed] [Google Scholar]
- Carter CS, Braver TS, Barch DM, Botvinick MM, Noll D, Cohen JD (1998): Anterior cingulate cortex, error detection, and the online monitoring of performance. Science 280:747–749. [DOI] [PubMed] [Google Scholar]
- Cavanagh JF, Wiecki TV, Cohen MX, Figueroa CM, Samanta J, Sherman SJ, Frank MJ (2011): Subthalamic nucleus stimulation reverses mediofrontal influence over decision threshold. Nat Neurosci 14:1462–1467. Available at: http://www.nature.com/neuro/journal/v14/n11/full/nn.2925.html?WT.ec_id=NEURO-201111. [DOI] [PMC free article] [PubMed] [Google Scholar]
- Chau BKH, Kolling N, Hunt LT, Walton ME, Rushworth MFS (2014): A neural mechanism underlying failure of optimal choice with multiple alternatives. Nat Neurosci 17:463–470. [DOI] [PMC free article] [PubMed] [Google Scholar]
- Churchland A, Kiani R, Shadlen M (2008): Decision‐making with multiple alternatives. Nat Neurosci 11:693 [DOI] [PMC free article] [PubMed] [Google Scholar]
- Churchland AK, Ditterich J (2012): New advances in understanding decisions among multiple alternatives. Curr Opin Neurobiol 22:920–926. [DOI] [PMC free article] [PubMed] [Google Scholar]
- Coulthard EJ, Bogacz R, Javed S, Mooney LK, Murphy G, Keeley S, Whone AL (2012): Distinct roles of dopamine and subthalamic nucleus in learning and probabilistic decision making. Brain 135:3721–3734. [DOI] [PMC free article] [PubMed] [Google Scholar]
- de Hollander G, Keuken MC, Forstmann BU (2015): The subcortical cocktail problem; mixed signals from the subthalamic nucleus and substantia nigra. PloS One 10:e0120572. [DOI] [PMC free article] [PubMed] [Google Scholar]
- Draglia VP, Tartakovsky AG, Veeravalli VV (1999): Multihypothesis sequential probability ratio tests. I. Asymptotic optimality. IEEE Trans Inf Theory 45:2448–2461. [Google Scholar]
- Florio T, Capozzo A, Cellini R, Pizzuti G, Staderini EM, Scarnati E (2001): Unilateral lesions of the pedunculopontine nucleus do not alleviate subthalamic nucleus‐mediated anticipatory responding in a delayed sensorimotor task in the rat. Behav Brain Res 126:93–103. [DOI] [PubMed] [Google Scholar]
- Forstmann BU, Dutilh G, Brown S, Neumann J, Cramon von DY, Ridderinkhof KR, Wagenmakers E‐J (2008): Striatum and pre‐SMA facilitate decision‐making under time pressure. Proc Natl Acad Sci USA 105:17538–17542. [DOI] [PMC free article] [PubMed] [Google Scholar]
- Forstmann BU, Keuken MC, Jahfari S, Bazin PL, Neumann N, Schafer A, Anwander A, Turner R (2012): Cortico‐subthalamic white matter tract strength predict interindividual efficacy in stopping a motor response. NeuroImage 60:370–375. [DOI] [PubMed] [Google Scholar]
- Forstmann BU, Keuken MC, Schäfer A, Bazin P‐L, Alkemade A, Turner R (2014): Multi‐modal ultra‐high resolution structural 7‐Tesla MRI data repository. Sci Data 1: 140050 [DOI] [PMC free article] [PubMed] [Google Scholar]
- Frank MJ (2006): Hold your horses: a dynamic computational role for the subthalamic nucleus in decision making. Neural Netw 19:1120–1136. [DOI] [PubMed] [Google Scholar]
- Frank MJ, Samanta J, Moustafa AA, Sherman SJ (2007): Hold your horses: Impulsivity, deep brain stimulation, and medication in parkinsonism. Science 318:1309–1312. [DOI] [PubMed] [Google Scholar]
- Frank MJ, Gagne C, Nyhus E, Masters S, Wiecki TV, Cavanagh JF, Badre D (2015): fMRI and EEG predictors of dynamic decision parameters during human reinforcement learning. J Neurosci 35:485–494. [DOI] [PMC free article] [PubMed] [Google Scholar]
- Gold JI, Shadlen MN (2007): The neural basis of decision making. Annu Rev Neurosci 30:535–574. [DOI] [PubMed] [Google Scholar]
- Green N, Bogacz R, Huebl J, Beyer A‐K, Kühn AA, Heekeren HR (2013): Reduction of influence of task difficulty on perceptual decision making by STN deep brain stimulation. Curr Biol 23:1681–1684. [DOI] [PubMed] [Google Scholar]
- Gurney K, Prescott T, Redgrave P (2001): A computational model of action selection in the basal ganglia. I. A new functional anatomy. Biol Cybern 84:401–410. [DOI] [PubMed] [Google Scholar]
- Haase A, Frahm J, Matthaei D, Hanicke W, Merboldt KD (1986): FLASH imaging. Rapid NMR imaging using low flip‐angle pulses. J Magn Reson 67:258–266. [DOI] [PubMed] [Google Scholar]
- Heidemann RM, Porter DA, Anwander A, Feiweier T, Heberlein K, Knösche TR, Turner R (2010): Diffusion imaging in humans at 7T using readout‐segmented EPI and GRAPPA. Magn Reson Med 64:9–14. [DOI] [PubMed] [Google Scholar]
- Heidemann RM, Ivanov D, Trampel R, Fasano F, Meyer H, Pfeuffer J, Turner R (2012): Isotropic submillimeter fMRI in the human brain at 7 T: Combining reduced field‐of‐view imaging and partially parallel acquisitions. Magn Reson Med 68:1506–1516. [DOI] [PubMed] [Google Scholar]
- Heitz RP (2014): The speed‐accuracy tradeoff: history, physiology, methodology, and behavior. Front Neurosci 8:1–19. [DOI] [PMC free article] [PubMed] [Google Scholar]
- Ho TC, Brown S, Serences JT (2009): Domain general mechanisms of perceptual decision making in human cortex. J Neurosci 29:8675–8687. [DOI] [PMC free article] [PubMed] [Google Scholar]
- Jahfari S, Waldorp L, van den Wildenberg WPM, Scholte HS, Ridderinkhof KR, Forstmann BU (2011): Effective connectivity reveals important roles for both the hyperdirect (fronto‐subthalamic) and the indirect (fronto‐striatal‐pallidal) fronto‐basal ganglia pathways during response inhibition. J Neurosci 31:6891–6899. [DOI] [PMC free article] [PubMed] [Google Scholar]
- Jazayeri M, Movshon J (2006): Optimal representation of sensory information by neural populations. Nat Neurosci 9:690–696. [DOI] [PubMed] [Google Scholar]
- Johansen‐Berg H, Behrens T, Robson MD, Drobnjak I, Rushworth M, Brady JM, Smith SM, Higham DJ, Matthews PM (2004): Changes in connectivity profiles define functionally distinct regions in human medial frontal cortex. Proc Natl Acad Sci USA 101:13335–13340. [DOI] [PMC free article] [PubMed] [Google Scholar]
- Keuken MC, Uylings HBM, Geyer S, Schaefer A, Turner R, Forstmann BU (2012): Are there three subdivisions in the primate subthalamic nucleus? Front Neuroanat 6:1–10. [DOI] [PMC free article] [PubMed] [Google Scholar]
- Keuken MC, Bazin PL, Schafer A, Neumann J, Turner R, Forstmann BU (2013): Ultra‐high 7T MRI of structural age‐related changes of the subthalamic nucleus. J Neurosci 33:4896–4900. [DOI] [PMC free article] [PubMed] [Google Scholar]
- Keuken MC, Bazin PL, Crown L, Hootsmans J, Laufer A, Müller‐Axt C, Sier R, van der Putten EJ, Schafer A, Turner R, Forstmann BU (2014a): Quantifying inter‐individual anatomical variability in the subcortex using 7T structural MRI. NeuroImage 94:1–7. [DOI] [PubMed] [Google Scholar]
- Keuken MC, Müller‐Axt C, Langner R, Eickhoff SB, Forstmann BU, Neumann J (2014b): Brain networks of perceptual decision‐making: an fMRI ALE meta‐analysis. Front Hum Neurosci 8:1–14. [DOI] [PMC free article] [PubMed] [Google Scholar]
- Lambert C, Zrinzo L, Nagy Z, Lutti A, Hariz M, Foltynie T, Draganski B, Ashburner J, Frackowiak R (2012): Confirmation of functional zones within the human subthalamic nucleus: Patterns of connectivity and sub‐parcellation using diffusion weighted imaging. NeuroImage 60:83–94. [DOI] [PMC free article] [PubMed] [Google Scholar]
- Mansfield EL, Karayanidis F, Jamadar S, Heathcote A, Forstmann BU (2011): Adjustments of response threshold during task switching: A model‐based functional magnetic resonance imaging study. J Neurosci 31:14688–14692. [DOI] [PMC free article] [PubMed] [Google Scholar]
- Marques JP, Kober T, Krueger G, van der Zwaag W, van de Moortele P‐F, Gruetter R (2010): MP2RAGE, a self bias‐field corrected sequence for improved segmentation and T1‐mapping at high field. NeuroImage 49:1271–1281. [DOI] [PubMed] [Google Scholar]
- Mink JW (1996): The basal ganglia: Focused selection and inhibition of competing motor programs. Prog Neurobiol 50:381–425. [DOI] [PubMed] [Google Scholar]
- Mumford JA, Turner BO, Ashby FG, Poldrack RA (2012): Deconvolving BOLD activation in event‐related designs for multivoxel pattern classification analyses. NeuroImage 59:2636–2643. [DOI] [PMC free article] [PubMed] [Google Scholar]
- Oldfield RC (1971): The assessment and analysis of handedness: The Edinburgh inventory. Neuropsychologia 9:97–113. [DOI] [PubMed] [Google Scholar]
- Palmer J, Huk A, Shadlen M (2005): The effect of stimulus strength on the speed and accuracy of a perceptual decision. J Vis 5:376–404. [DOI] [PubMed] [Google Scholar]
- Parent A (1995): Functional anatomy of the basal ganglia. I. The cortico‐basal ganglia‐thalamo‐cortical loop. Brain Res Brain Res Rev 20:91–127. [DOI] [PubMed] [Google Scholar]
- Pearl J (2000): Causality: models and prediction. Brain Res Brain Res Rev Cambridge University Press. [Google Scholar]
- Ridderinkhof KR, Ullsperger M, Crone EA, Nieuwenhuis S (2004): The role of the medial frontal cortex in cognitive control. Science 306:443 [DOI] [PubMed] [Google Scholar]
- van Maanen L, Brown SD, Eichele T, Wagenmakers E‐J, Ho T, Serences J, Forstmann BU (2011): Neural correlates of trial‐to‐trial fluctuations in response caution. J Neurosci 31:17488–17495. [DOI] [PMC free article] [PubMed] [Google Scholar]
- van Maanen L, Grasman RP, Forstmann BU, Keuken MC, Brown SD, Wagenmakers E‐J (2012): Similarity and number of alternatives in the random‐dot motion paradigm. Atten Percept Psychophys 74:739–753. [DOI] [PMC free article] [PubMed] [Google Scholar]
- van Maanen L, Forstmann BU, Keuken MC, Wagenmakers E‐J, Heathcote A (in press): The impact of MRI scanner environment on perceptual decision making. Behavior Research Methods. [DOI] [PMC free article] [PubMed]
- Wagenmakers E‐J, Farrell S (2004): AIC model selection using Akaike weights. Psychon Bull Rev 11:192–196. [DOI] [PubMed] [Google Scholar]
- Wald A, Wolfowitz J (1948): Optimum character of the sequential probability ratio test. Ann Math Stat 19:326–339. [Google Scholar]
- Waldorp L, Christoffels I, van de Ven V (2011): Effective connectivity of fMRI data using ancestral graph theory: Dealing with missing regions. NeuroImage 54:2695–2705. [DOI] [PubMed] [Google Scholar]
- Winkel J, Keuken MC, Maanen L, Wagenmakers E‐J, Forstmann BU (2014): Early evidence affects later decisions: Why evidence accumulation is required to explain response time data. Psychon Bull Rev 21:777–784. [DOI] [PubMed] [Google Scholar]
- Wylie SA, Ridderinkhof KR, Elias WJ, Frysinger RC, Bashore TR Downs KE, van Wouwe NC, van den Wildenberg WPM (2010): Subthalamic nucleus stimulation influences expression and suppression of impulsive behaviour in Parkinson's disease. Brain 133:3611–3624. [DOI] [PMC free article] [PubMed] [Google Scholar]
- Zavala B, Brittain JS, Jenkinson N, Ashkan K, Foltynie T, Limousin P, Zrinzo L, Green AL, Aziz T, Zaghloul K, Brown P (2013): Subthalamic nucleus local field potential activity during the Eriksen Flanker task reveals a novel role for theta phase during conflict monitoring. J Neurosci 33:14758–14766. [DOI] [PMC free article] [PubMed] [Google Scholar]
- Zavala BA, Tan H, Little S, Ashkan K, Hariz M, Foltynie T, Zrinzo L, Zaghloul KA, Brown P (2014): Midline frontal cortex low‐frequency activity drives subthalamic nucleus oscillations during conflict. J Neurosci 34:7322–7333. [DOI] [PMC free article] [PubMed] [Google Scholar]
Associated Data
This section collects any data citations, data availability statements, or supplementary materials included in this article.
Supplementary Materials
Supporting Information Figure 1
Supporting Information