Abstract
Conventional fluorescence tomography (FT) can recover the distribution of fluorescent agents within a highly scattering medium. However, poor spatial resolution remains its foremost limitation. Previously, we introduced a new fluorescence imaging technique termed “temperature-modulated fluorescence tomography” (TM-FT), which provides high-resolution images of fluorophore distribution. TM-FT is a multimodality technique that combines fluorescence imaging with focused ultrasound to locate thermo-sensitive fluorescence probes using a priori spatial information to drastically improve the resolution of conventional FT. In this paper, we present an extensive simulation study to evaluate the performance of the TM-FT technique on complex phantoms with multiple fluorescent targets of various sizes located at different depths. In addition, the performance of the TM-FT is tested in the presence of background fluorescence. The results obtained using our new method are systematically compared with those obtained with the conventional FT. Overall, TM-FT provides higher resolution and superior quantitative accuracy, making it an ideal candidate for in vivo preclinical and clinical imaging. For example, a 4 mm diameter inclusion positioned in the middle of a synthetic slab geometry phantom (D:40 mm × W :100 mm) is recovered as an elongated object in the conventional FT (x = 4.5 mm; y = 10.4 mm), while TM-FT recovers it successfully in both directions (x = 3.8 mm; y = 4.6 mm). As a result, the quantitative accuracy of the TM-FT is superior because it recovers the concentration of the agent with a 22% error, which is in contrast with the 83% error of the conventional FT.
1. INTRODUCTION
Fluorescence imaging plays an important role in preclinical and clinical studies due to its high sensitivity to exogenous contrast agents and specificity to molecular information [1,2]. Indeed, 3D images can be rendered in a tomographic mode, which is necessary for thick tissue imaging [3,4]. In the last decade, researchers from various institutions have developed small animal fluorescence tomography (FT) systems for many applications [1,5–17]. Despite rapid and promising development, the main barrier for widespread use of FT is the low spatial resolution due to strong tissue scattering, making direct light focusing infeasible beyond one transport mean free path [18,19].
In order to improve the resolution of FT, extensive effort has been spent toward the image-guided approach, which is to integrate FT with other anatomic imaging modalities such as x-ray CT, MRI, and ultrasound [5,7,8,20–22]. In image-guided FT, prior information about the location and structure of a lesion is obtained using a high-resolution anatomical imaging modality. This structural template is then applied in the FT reconstruction model to acquire region-based fluorescence parameters. For this purpose, both hard a priori and soft a priori approaches have been utilized by numerous research groups [20,23–25]. In hard a priori, all the pixels in a segmented region are forced to be the same value, while in soft a priori, the pixels are loosely grouped into regions, but independent update is still permitted. Significant improvement of FT quantitative accuracy has been demonstrated in the literature with MRI-, x-ray CT-, and ultrasound-guided FT. Despite the success and wide acceptance of this image-guided approach, the main concern is that it does not perform well when the fluorescent source cannot be localized in the anatomical image or when the fluorescence contrast does not correlate with anatomical imaging modality contrast [26]. Recently, temperature-sensitive fluorescence contrast agents have been reported using ICG loaded pluronic nanocapsules [27]. The unique thermo-reversible behavior of polymers such as Pluronic-F127 have been reported as a promising drug carrier for cancer therapy [28]. Pluronic-F127 polymer consists of an amphiphilic tri-block copolymer of ethylene and propylene oxide that can self assemble into a micelle in aqueous solution. As the temperature changes, this affects the bonding strength of the nanocapsule as it induces a change in the hydrophobicity/hyrophilicity of the Pluronic-F127 polymer. This in turn changes the micelle size, which affects the environment and concentration of the ICG encapsulated inside the micelle and is responsible for the variations in the fluorescence quantum yield [29]. From 22°C to 40°C, the fluorescence quantum efficiency increased 4–8 times and this change is reversible. The temperature dependence of these contrast agents provides an opportunity to overcome the spatial resolution limitation of conventional FT by using temperature modulation. Previously, we proposed a new technique, namely, temperature-modulated fluorescence tomography (TM-FT), which combines the sensitivity of fluorescence imaging with focused ultrasound resolution. The idea is to irradiate the medium with excitation light and a focused ultrasound wave generated by high intensity focused ultrasound (HIFU) in low power mode. As the HIFU scans through the medium, it sequentially generates a hot spot, which elevates the temperature of this small area several degrees. When the temperature-sensitive fluorescence agents are present within this HIFU focal zone, the fluorescence quantum efficiency increases due to the elevated local temperature. As a result, the emitted fluorescence light intensity has a detectable change only when the agent is present within the focal zone. This temperature modulation via the HIFU allows us to now have a separate fluorescence measurement for each pixel in a region of interest (ROI), which is not available with conventional FT. Furthermore, the location and size obtained from the HIFU scan specifically indicates the location of the fluorescence source, which can potentially overcome the challenges of the traditional anatomical image guided FT approach.
There are other emerging modalities that also combine optical and ultrasound techniques for imaging of fluorescence agents. For example, ultrasound modulated fluorescence tomography (UMFT) utilizes the direct ultrasound modulation of optical signal in the focal zone [30] in contrast with TM-FT, which modulates the local temperature. Unfortunately, UMFT has low modulation efficiency and an extremely low signal-to-noise ratio, which makes the implementation of this technique difficult [31]. Another example is photo-acoustic imaging (PAI), which is also an intriguing combination of optical and ultrasound techniques. PAI can provide the optical absorption maps with high spatial resolution and a depth penetration of several centimeters [18,32]. By using multiple-wavelength measurements, PAI can reveal the distribution of exogenous contrast agents [33,34]. An interesting PAI application, which uses fluorescence agents, is achieved through fluorescence quenching [35]. The idea is that, a lower fluorescence quantum yield of dyes within the perfluorocarbon nanoparticles would improve PAI contrast due to higher heat yield, which in turn would generate a stronger ultrasound signal (thermal expansion) [36]. Moreover, nonquenched nanoparticles are expected to produce higher fluorescence intensity but poor PAI signal compared with quenched nanoparticles. However, PAT is inherently sensitive to absorption and detects a differential increase in absorption due to molecular probes compared with background absorption.
In fact, TM-FT inherently measures the fluorescence emission of the contrast agents. Our limited preliminary results demonstrated the feasibility of this novel approach in addition to the reports from other groups [37–39]. In this work, we demonstrate the theoretical framework for TM-FT and present the major components of the TM-FT forward and inverse problem in detail. We tested the algorithm using simulations to study a number of different cases, including size and depth dependence, the presence of multiple fluorescence sources, and the effect of background fluorescence. For each case, the performance of TM-FT is compared with conventional FT. The results show that, in all cases, TM-FT provides higher spatial resolution and superior quantitative accuracy. These simulation studies presented here confirm that TM-FT, which combines FT and HIFU, is able to acquire high-resolution fluorescence images of temperature-sensitive molecular probes in deep tissue.
2. METHOD
Simulation studies are carried out to demonstrate the feasibility of this approach. These studies are performed on a synthetic phantom with slab geometry (D:40 mm × W :100 mm). Eight sources and eight detectors are utilized in transmission mode on opposite sides of the phantom. The background optical properties are set to be μa = 0.01 mm−1 and , respectively. Synthetic FT data is generated by solving the forward problem using the finite element method. Conventional FT reconstruction is first performed for each case to recover the spatial distribution of the fluorophore concentration, which is directly related to the absorption coefficient μaf (r). Unfortunately, on its own, conventional FT delivers a low-resolution map with poor quantitative accuracy. However, this low-resolution map can be used to determine the ROI for the TM-FT HIFU scan. Then, the TM-FT forward solver is used to recover a binary map that reveals the spatial distribution of temperature-sensitive fluorophores with high resolution. As the final step of TM-FT, this high-resolution binary map is used to constrain and guide a conventional FT reconstruction algorithm to obtain quantitatively correct high-resolution fluorophore concentration maps. For each case, the conventional FT and TM-FT reconstruction results are compared side by side in terms of the recovered fluorescence object size and concentration.
To be able to perform these simulations, several steps have been followed and are described in detail in this text, mainly: (1) modeling of the temperature distribution in the medium due to HIFU; (2) modeling of excitation and fluorescence emission light propagation in turbid medium (forward solver) and reconstruction of the images from synthetic data (inverse solver); (3) generation of TM-FT binary a priori information; (4) reconstruction of fluorescence images with TM-FT a priori. These steps are described as follows.
A. Modeling of Temperature Distribution in the Medium due to HIFU Heating
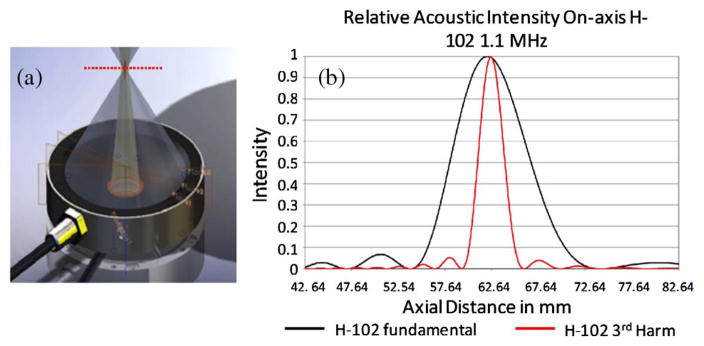
The ultrasound energy deposit is calculated from HIFU heating based on the Rayleigh–Sommerfeld radiation integral equation [40,41]. In this work, the specification of a commercial device is used for simulation studies, [Fig. 1(a)]. The pressure field induced by the Sonic Concepts H102 transducer can be approximated as a Gaussian kernel with a 1.26 mm full width half-maximum (FWHM) (for first harmonic resonance) in the lateral direction of the focal plane [Fig. 1(b). This approximation can be adapted to different HIFU devices by modifying the focal spot size.
Fig. 1.
(a) Commercial HIFU device (H102 transducer). (b) Its on-axis pressure profile temperature.
The transport of temperature induced by HIFU heating can be modeled by the Pennes’ bioheat transfer equation [41,42]:
| (1) |
where T is the temperature of the medium at position r⃗ and time t. The density, specific heat, and thermal conductivity of the medium are represented by ρ, c, and κ, respectively. Ta is the temperature of blood flow. The last term on the right hand side, Q, is the heat sink term, which takes into account the heat loss due to blood perfusion. The specific heat and perfusion rate of the blood are represented by cb and ω. In our simulation, the transducer power is turned on for 2 s at each scanning step. Thus, the heat-sink term is neglected due to the short heating time.
B. Modeling of Light Propagation in Tissue, FT Forward, and Inverse Problem
The fluorescence light propagation in tissue is described by the coupled diffusion equation in the continuous wave domain:
| (2) |
| (3) |
where Φx (r) and Φm(r)(W · mm−2) represent the photon density for the excitation and emission light, respectively. The diffusion coefficient, Dx,m(r)(mm−1), is defined by where is the reduced scattering coefficient and μax,m(mm−1) is the absorption coefficient of the medium. The absorption coefficients are assumed to be the same at the excitation and emission wavelengths. The absorption coefficient due to the fluorophore, μaf (r), is directly related to its concentration. T is the temperature of the medium. The fluorescence quantum efficiency, η(T), is the intrinsic property of the fluorophore, which is defined as the ratio of the number of fluorescence photons emitted to the number of excitation photons absorbed. Using our thermo-sensitive agents, the fluorescence quantum efficiency is a temperature-dependent parameter. The Robin boundary condition is applied to the diffusion model.
After applying the finite element method, Eq. (3) can be rewritten into an assembled matrix form:
| (4) |
where ξm and ξx are the nodal representation of the emission and excitation photon distribution, respectively. More detail on the matrix assembly and computation can be found in our previous works [20,22,43].
The inverse problem is solved by minimizing the difference between the measured and calculated data according to the following objective function:
| (5) |
where Ns and Nd represent the number of sources and detectors, respectively. is the set of fluorescence measurements. Pij(μaf) are the flux on the measured point calculated by the forward solver from the spatial distribution of μaf. We iteratively update the unknown μaf to be reconstructed with the Levenberg–Marquardt method by
| (6) |
where X represents the unknown matrix of μaf. The Jacobian matrix J is calculated with an adjoint method [44]. Unfortunately, the reconstructed μaf map at the end of this process is not quantitatively accurate and cannot recover the fluorescence targets with high resolution.
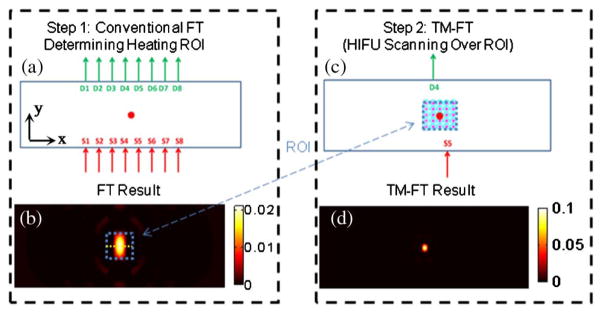
For conventional FT, eight sources and detectors in transmission configuration are used to acquire full tomographic synthetic measurements, as shown in Fig. 2(a). This configuration produces 64 measurements and allows reconstruction of a fluorescence concentration map, as we previously demonstrated with preliminary experimental studies [37]. In this example, a 3 mm diameter fluorescent target is placed at the center of the synthetic phantom, 20 mm away from each boundary. The reconstructed conventional FT image is presented in Fig. 2(b).
Fig. 2.
TM-FT image procedure. (a) During step 1, conventional FT is performed using an eight-source and eight-detector configuration. (b) Low-resolution map of μaf is then obtained using the standard FT reconstruction algorithm. This low-resolution map is used to determine the ROI for the HIFU heating in the second step. (c) A specific source-detector pair is selected with the best fluorescence signal in terms of SNR and sensitivity. The HIFU beam scans through the ROI determined from the previous step. This step provides a spatial a priori on the localization of the fluorescent source μaf. (d) This a priori information is then used in the TM-FT image reconstruction algorithm to obtain a high-resolution image with superior quantitative accuracy.
C. Generation of TM-FT a priori Information
Once the ROI is determined by the low-resolution conventional FT images reconstructed in the previous step, the HIFU beam is scanned over this ROI [Fig. 2(c)]. Meanwhile, a particular source-detector pair, which has the highest sensitivity around this ROI (S5/D4 for this case), is monitored continuously. It is only when the temperature-sensitive contrast agent is present within the focal spot, the emitted fluorescence light intensity changes drastically due to the change in quantum efficiency and, hence, the measured signal. Thus a well-defined description of the contrast agent distribution in the form of a binary mask is obtained. Here the resolution of TM-FT is closely related to the spot size of HIFU (~1.26 mm for the presented results in our simulation). Please note that the obtained binary mask already represents a high-resolution fluorescence image even without any reconstruction process. However, a final TM-FT reconstruction process is required in order to achieve a quantitatively accurate contrast agent concentration map.
D. Reconstruction of Fluorescence Images with TM-FT a priori Information
Since the TM-FT a priori information is available in the form of a binary map, the FT reconstruction process is performed a second time utilizing the a priori information to guide and constrain the solution. Again, we iteratively update the unknown μaf to be reconstructed with the Levenberg–Marquardt method; however, this time a penalty matrix obtained from the a priori information generated with TMFT is used:
| (7) |
where X represents the unknown matrix of μaf. The Jacobian matrix J is calculated with the adjoint method [44]. Here, the matrix L is the penalty matrix describing the a priori information obtained using temperature modulation as described below [37]. This final step reveals a much higher-resolution fluorescence image with superior quantitative accuracy as it is guided by the TM-FT priori [Fig. 2(d)].
3. RESULTS
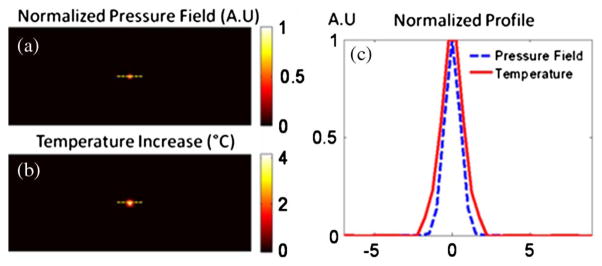
We assumed that the ultrasound pressure field was generated from an H102 HIFU transducer and approximated as a Gaussian shape with a 1.26 mm FWHM (Fig. 3). The specific heat, density, and thermal conductivity of the tissue are set to be 4186 [J/(kg · °C)], 1000 (kg/m3), and 0.7 [W/(m · °C)], respectively. The HIFU is turned on for 2 s with the maximum temperature rise below 5°C. Figure 3(a) shows the Gaussian-shaped pressure field from HIFU, and the resulting temperature rise at 2 s of heating is shown in Fig. 3(b). The profile for the pressure field and temperature increase is plotted in Fig. 3(c). It shows that the size of the heating spot is slightly larger than that of the ultrasound pressure field due to the heat diffusion.
Fig. 3.
(a) 2D pressure field on the focal plane. (b) Corresponding temperature increase due to the HIFU heating at the end of 2 s. (c) Normalized profile for the pressure field and temperature increase.
The temperature-dependent profile of the quantum efficiency is computed from the heating profile and is used in the simulation studies. The quantum efficiency is assumed to increase 50% at the heating spot. For each study, the fluorescence source is reconstructed using conventional FT and TM-FT, and then the results are compared. To evaluate the performance of the TM-FT extensively, the following simulation studies are carried out.
A. Size and Position Dependence
Due to the ill-posedness of the FT inverse problem, the reconstructed fluorescence concentration is expected to depend on the size and location of the inclusion [20,22,45]. We evaluate this effect for conventional FT and TM-FT in this study. The size and location of the inclusion are varied, as listed in Table 1. Here, the parameter depth refers to the distance from detectors. However, the absorption coefficient due to the contrast agent, μaf = 0.01 mm−1, is kept the same for all the cases.
Table 1.
Recovered μaf for First Simulation Study
| Case No. | Inclusion Size (mm) | Depth (mm) | True μaf (mm−1) | Conventional FT
|
TM-FT
|
||
|---|---|---|---|---|---|---|---|
| μaf (mm−1) | FWHM (mm) x/y | μaf (mm−1) | FWHM (mm) x/y | ||||
| 1 | 4 | 5 | 0.01 | 0.0031 | 3.9/7.1 | 0.0077 | 4.0/4.8 |
| 2 | 4 | 10 | 0.01 | 0.0024 | 4.2/8.0 | 0.0079 | 4.0/4.4 |
| 3 | 4 | 20 | 0.01 | 0.0017 | 4.5/10.4 | 0.0078 | 3.8/4.6 |
| 4 | 3 | 20 | 0.01 | 0.0014 | 4.3/10.4 | 0.0094 | 3.0/4.2 |
| 5 | 7 | 20 | 0.01 | 0.0048 | 5.4/10.8 | 0.0090 | 7.0/7.2 |
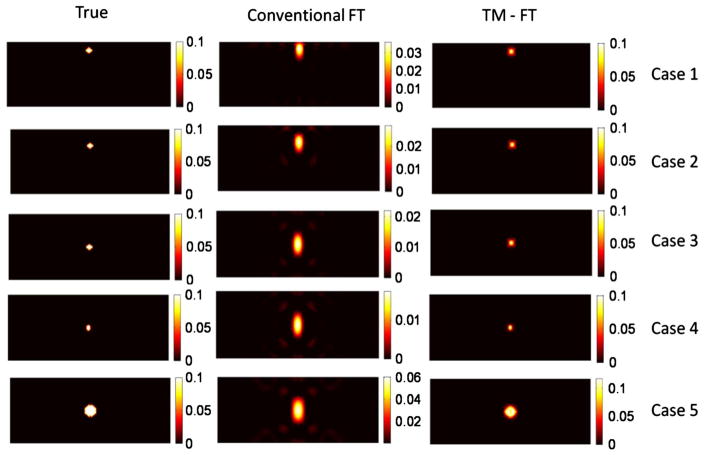
The reconstructed absorption map due to the fluorescence contrast agent is shown in Fig. 4, and the recovered absorption coefficient and fluorescence source size are listed in Table 1.
Fig. 4.
Results for the first simulation study using inclusions of various sizes buried at different depths.
The first three cases (1–3) allowed us to investigate the depth dependence of the results for a 4 mm diameter object. Due to the slab geometry and transmission mode measurements, the spatial resolution in the horizontal and vertical directions are different. The FWHM of the recovered fluorescence source is calculated in both directions, as shown in Table 1. For conventional FT, the 4 mm inclusion is recovered with more than 70% error for all three depths (cases 1–3). The accuracy of the recovered fluorescence source strength and size decreases as the inclusion is embedded deeper into the scattering medium. For example, for the very same 4 mm diameter object, the recovered μaf is reduced from 0.0031 mm−1 down to 0.0017 mm−1 as its depth increases from 5 to 20 mm. However, when using TM-FT, the size and strength of the fluorescence source is recovered more accurately. Indeed, the quantitative accuracy of TM-FT is not affected by the depth of the inclusion. Regardless of its location, the recovered μaf of the 4 mm inclusion is nearly the same, 0.0078 mm−1. Meanwhile, TM-FT recovers the size more accurately, i.e., with less than 20% error in both directions, while the error can go as high as 150% for the conventional FT, especially for the y direction. In summary, the recovered fluorescence size is not affected by the source-detector geometry for the TM-FT compared with the elongated shape obtained with conventional FT.
Meanwhile, the last three cases (3–5) allowed us to investigate the size dependence of the results for different inclusions located at the center of the slab phantom. For these inclusions located at the center, the error of the recovered source strength reduces as the true fluorescence size increases from 3 to 7 mm for conventional FT. For instance, the source strength recovered has an error of almost 50% for the 7 mm inclusion and 86% for the 3 mm inclusion. Consequently, the recovered fluorescence strength is indeed highly dependent on the size of the inclusion for conventional FT. When TM-FT is used, the accuracy of the recovered fluorescence source strength is much improved, i.e., the error is less than 20% for all objects, as shown in Table 1. When it comes to the recovered size of the object, the performance of TM-FT is superior, with less than 15% error for all three inclusions with different sizes. The error reduces with the size of the object. For example, it is only around 3% for the largest object with 7 mm diameter. The variation in the recovered size of these small inclusions is most probably due to the spatial resolution limitation of the TM-FT, which directly depends on the size of the HIFU beam (~1.26 mm). As it is investigated in the next sections, the other critical factor for the spatial resolution of the TM-FT is the HIFU scanning pattern.
B. Multiple Inclusions
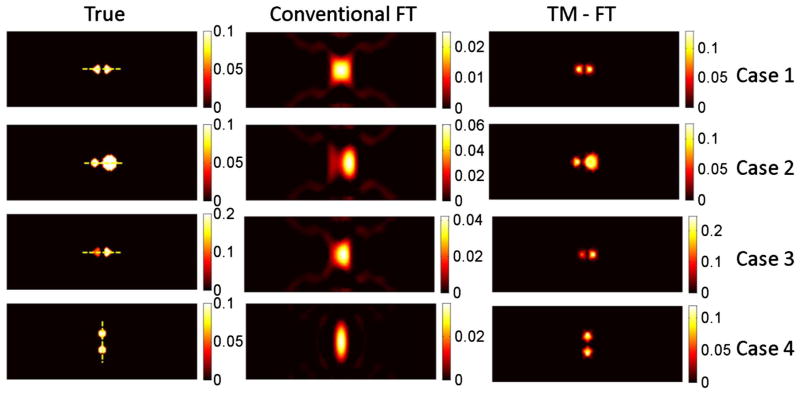
To further explore the spatial resolution limit of the TM-FT method for imaging temperature-sensitive probes, simulation studies were performed using multiple inclusions. Again, the same slab geometry simulation phantom with similar background optical properties is used. Four cases with various sizes and contrasts are tested. For the first three cases, the two inclusions are separated edge to edge 2 mm apart and are parallel to the source-detector plane, while, for the fourth case, the two inclusions were placed 4 mm apart and are perpendicular to the source-detector plane.
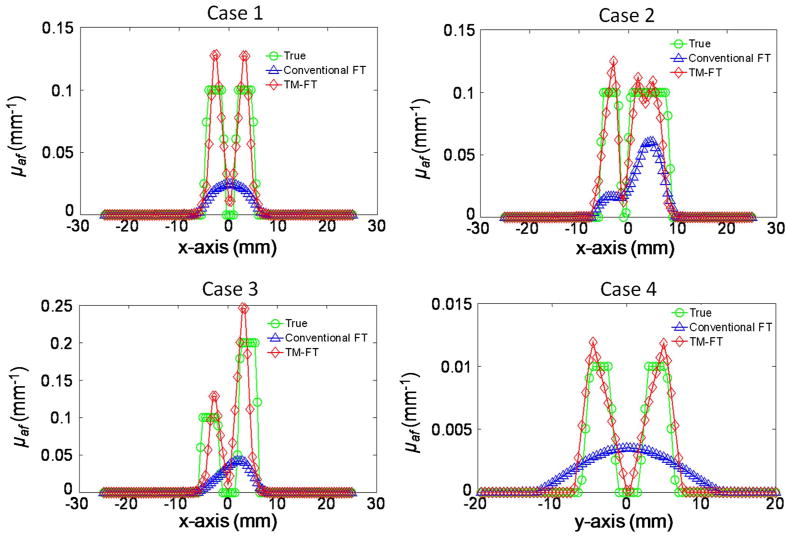
The reconstructed absorption maps due to fluorescence contrast agent are shown in Fig. 5, and the recovered absorption coefficients are listed in Table 2 together with the fluorescence source size for each inclusion. The results show that conventional FT cannot resolve the two objects successfully for any case due to the intrinsic limited spatial resolution; thus, the source strength and size are calculated as one inclusion (Table 2). Figure 6 shows the plot of the profiles along the yellow dashed lines, as indicated in the first column of Fig. 5, for the true inclusion and the reconstructed inclusions from conventional FT and TM-FT.
Fig. 5.
Results for the second simulation study using multiple inclusions.
Table 2.
Recovered μaf for Second Simulation Study
| Case No. | Obj. No. | Inclusion Size (mm) | True μaf (mm−1) | Two Objects Resolved
|
Conventional FT
|
TM-FT
|
|||
|---|---|---|---|---|---|---|---|---|---|
| FT | TM-FT | μaf (mm−1) | FWHM (mm) x/y | μaf (mm−1) | FWHM (mm) x/y | ||||
| 1 | 1 | 4 | 0.01 | X | ✓ | 0.0020 | 8.7/9.9 | 0.0092 | 4.4/5.0 |
| 2 | 4 | 0.01 | 0.0098 | 4.4/5.0 | |||||
| 2 | 1 | 4 | 0.01 | X | ✓ | 0.0049 | 6.1/12.5 | 0.0093 | 5.2/5.2 |
| 2 | 8 | 0.01 | 0.0092 | 8.1/8.3 | |||||
| 3 | 1 | 4 | 0.01 | X | ✓ | 0.0033 | 6.9/10.9 | 0.0095 | 4.4/5.0 |
| 2 | 4 | 0.02 | 0.0178 | 4.6/5.2 | |||||
| 4 | 1 | 4 | 0.01 | X | ✓ | 0.0028 | 4.5/14.7 | 0.0086 | 4.2/5.1 |
| 2 | 4 | 0.01 | 0.0085 | 4.3/5.3 | |||||
Fig. 6.
Profile of the results for the second simulation study. The profiles are carried out across the inclusions, along the yellow dashed line, (Fig. 5).
The first case shows that TM-FT successfully recovered two individual inclusions that are 2 mm apart, while conventional FT fails. When one inclusion is larger in size, its recovered dominantly with conventional FT and the smaller inclusion is hardly visible. However, TM-FT recovers the true size and location of both inclusions regardless of their sizes, as shown in case 2. The third case shows that if one inclusion has twice the source strength than the other, TM-FT can still recover 1.9 times contrast between the two inclusion, while conventional FT shows that the higher concentration inclusion dominates the reconstructed μaf map and the inclusion with lower concentration is hardly visible.
Due to the transmission geometry, the spatial resolution in the vertical direction is expected to be lower than in the horizontal direction. Accordingly, the two inclusions are separated 4 mm away in the fourth case but in the vertical direction. Conventional FT is not able to separate them due to its poor spatial resolution in this direction. However, TM-FT is not affected by the optical source-detector geometry because the spatial resolution is primarily determined by the HIFU scan. In all cases, the error in the recovered object size changes between 5% and 30% when TM-FT is used, while the errors in the recovered μaf values are always less than 15%.
C. Presence of Background Fluorescence
There is likely to be residual fluorescence and/or autofluorescence from the tissue surrounding the target in realistic in vivo experiments. In this study, the contribution of background fluorescence is taken into account to investigate the performance of TM-FT in the presence of background fluorescence. Two cases with object to background contrast of 10 and 2 were evaluated, as shown in Table 3.
Table 3.
Recovered μaf for Third Simulation Studya
| Case # | True μaf (mm−1): Inclusion/Background | Conventional FT: μaf (mm−1) | TM-FT: μaf (mm−1) |
|---|---|---|---|
| 1 | 0.01/0.005 | 0.0055 (45%) | 0.0091 (9%) |
| 2 | 0.01/0.001 | 0.0021 (79%) | 0.0088 (12%) |
Percent error is shown in the parenthesis.
For conventional FT and TM-FT, the inclusion could be localized on the fluorescence map, as shown in Fig. 7. For conventional FT, the recovered fluorescence absorption coefficient is 0.0055 (45% error) and 0.0021 (79% error) for the contrast of 10 and 2, respectively. The recovered value is significantly improved to 0.0091 (9% error) and 0.0088 (12% error) using TM-FT, indicating the accuracy and robustness of TM-FT in recovering the fluorescence source strength independent of object to background contrast.
Fig. 7.
Results for the third simulation study showing the effect of background fluorescence, present in the phantom, on the quality of reconstructed image.
D. Various Heating Profile
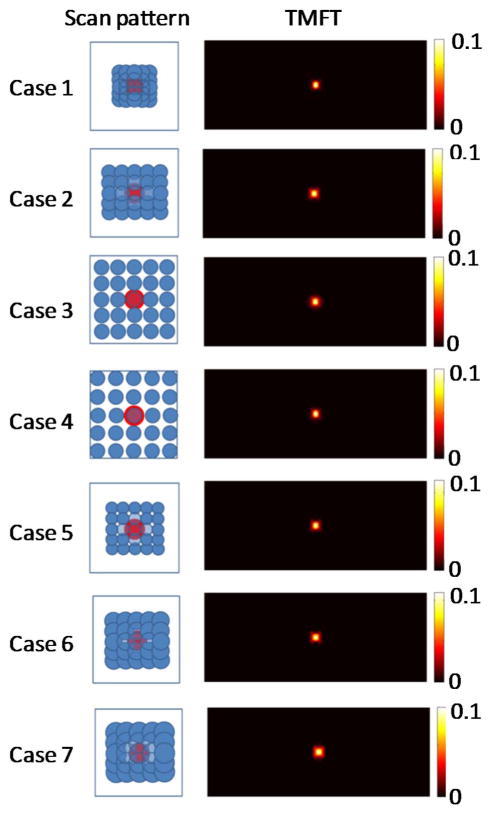
As seen in the previous simulations, TM-FT does not always work perfectly, although it is superior to conventional FT for all cases. To further improve the TM-FT performance, the HIFU resolution needs to be considered because it is directly related to the spatial resolution of TM-FT. For this purpose, in this last simulation study, we evaluated the effect of the HIFU focal size and the spatial sampling rate on the spatial resolution of this method. Similar to the first phantom study, a 4 mm diameter inclusion is embedded in the same rectangular phantom. The HIFU is scanned through an 8 mm × 8 mm area with 0.5, 1.5, 2, and 3 mm step size (cases 1–4). Then, for the same phantom, the same area is scanned with a 1.0 mm step using a HIFU with a focal size of 0.8, 2.5, and 3.5 mm (cases 5–7). The reconstructed fluorescence absorption maps are shown in Fig. 8, and the recovered absorption coefficient and fluorescence source size for each inclusion is listed in Table 4. When the 0.5 mm scanning step is used, the source strength can be accurately recovered to 0.01 mm−1, and the value decrease to 0.0076 mm−1 (24% error) when the scanning step increases to 3 mm. Cases 1–4 shows that with TM-FT, the finer the scanning step, the better the spatial resolution and quantitative accuracy. This is logical because TM-FT relies primarily on the HIFU spatial resolution. When the 0.8 mm focal spot HIFU is used (case 5), the source strength is recovered as 0.0089 mm−1 (11% error), and the error increases to 32% as the focal size increases to 3.5 mm (case 7).
Fig. 8.
Results of the fourth simulation study showing the dependence of spatial resolution of TM-FT on the HIFU resolution.
Table 4.
Recovered μaf for Fourth Simulation Study
| Case No. | Scanning step (mm) | HIFU Focal Spot Size (mm) | True μaf (mm−1) | TM-FT
|
|
|---|---|---|---|---|---|
| μaf (mm−1) | FWHM (mm) x/y | ||||
| 1 | 0.5 | 1.5 | 0.01 | 0.01 | 3.2/4.2 |
| 2 | 1.5 | 1.5 | 0.01 | 0.0085 | 3.8/4.4 |
| 3 | 2 | 1.5 | 0.01 | 0.0078 | 3.6/4.6 |
| 4 | 3 | 1.5 | 0.01 | 0.0076 | 3.6/4.5 |
| 5 | 1 | 0.8 | 0.01 | 0.0089 | 3.6/4.4 |
| 6 | 1 | 2.5 | 0.01 | 0.0083 | 3.8/4.2 |
| 7 | 1 | 3.5 | 0.01 | 0.0068 | 4.8/5.0 |
Finally, cases 5–7 show that the smaller the HIFU focal spot, the better the spatial resolution and quantitative accuracy of TM-FT, especially for small objects.
4. DISCUSSION AND CONCLUSION
This study investigates the performance of our new imaging modality termed “temperature modulated fluorescence tomography,” which can provide high-resolution fluorescence images with superior quantitative accuracy. TM-FT is based on the change of fluorescence quantum efficiency in correspondence to a temperature change. In practice, the relationship between the two parameters can be measured using fluorescence spectroscopy together with a temperature control and measuring device. In TM-FT, the location and structure of the fluorescence source can be directly determined from HIFU scan. This geometric information from TM-FT can serve as structural a priori information to guide the image reconstruction via the conventional image-guided approach. Please note that, unlike traditional image-guided FT, structural information offered by the HIFU scan accurately indicates the position of the fluorescence sources. By constraining and guiding the FT reconstruction algorithm, TM-FT can obtain high-resolution and quantitatively accurate fluorescence concentration maps. It is important to note here that the resolution of TM-FT directly depends on the HIFU resolution. Therefore, the HIFU resolution and its scanning pattern plays a crucial role in TM-FT. Accordingly, our simulation studies not only demonstrated that TM-FT is superior to conventional FT for many different cases, including objects buried in a fluorescence background, but they also confirmed that the HIFU resolution and selected scanning pattern are critical. In the practical application of this technique, a scanning pattern selection would depend on the time available for imaging (i.e., more overlapping patterns would require more time) and selection of the HIFU transducer would depend on the application (i.e., the imaging depth for a HIFU with smaller focal spot would be limited).
In addition to fluorescence concentration, FT can also recover lifetime parameters [9,12,20,46]. The ICG loaded micelles changes its quantum efficiency when the solvent polarity changes, which is caused by the change of hydrophobicity/hydrophilicity of the micelle interior in response to temperature change [27,47]. As reported in the literature, in addition to the quantum efficiency, the lifetime also depends on the solvent polarity [48]. Thus, it is expected that lifetime also will have measurable change due to temperature modulation. Current work is limited to continuous wave measurements and the temperature modulation of the fluorescence quantum efficiency. In order to measure lifetime, either time-domain or frequency-domain techniques are required. Future work includes investigating lifetime response to temperature modulation and TM-FT using time-resolved measurements.
In conclusion, TM-FT combines the superior sensitivity of fluorescence imaging and spatial resolution of focused ultrasound. The forward and inverse problem of this new method is presented, and the simulation studies demonstrated the feasibility of this TM-FT approach. The results showed that TM-FT can robustly recover the fluorescence source with high spatial resolution and quantitative accuracy for a number of cases.
Acknowledgments
Funding. National Institutes of Health (NIH) (R21 EB013387, 1R21CA191389, R01EB008716, P30CA062203, SBIR HHSN261201300068C, 1F31CA171915-01A1); UCI Eugene Cota-Robles Fellowship.
Footnotes
OCIS codes: (170.0170) Medical optics and biotechnology; (170.0110) Imaging systems; (110.6955) Tomographic imaging; (260.2510) Fluorescence.
References
- 1.Sevick-Muraca EM, Rasmussen JC. Molecular imaging with optics: primer and case for near-infrared fluorescence techniques in personalized medicine. J Biomed Opt. 2008;13:041303. doi: 10.1117/1.2953185. [DOI] [PMC free article] [PubMed] [Google Scholar]
- 2.Ntziachristos V. Fluorescence molecular imaging. Ann Rev Biomed Eng. 2006;8:1–33. doi: 10.1146/annurev.bioeng.8.061505.095831. [DOI] [PubMed] [Google Scholar]
- 3.Ntziachristos V, Bremer C, Weissleder R. Fluorescence imaging with near-infrared light: new technological advances that enable in vivo molecular imaging. Euro Radiol. 2003;13:195–208. doi: 10.1007/s00330-002-1524-x. [DOI] [PubMed] [Google Scholar]
- 4.Leblond F, Davis SC, Valdés PA, Pogue BW. Pre-clinical whole-body fluorescence imaging: Review of instruments, methods and applications. J Photochem Photobiol B. 2010;98:77–94. doi: 10.1016/j.jphotobiol.2009.11.007. [DOI] [PMC free article] [PubMed] [Google Scholar]
- 5.Schulz RB, Ale A, Sarantopoulos A, Freyer M, Soehngen E, Zientkowska M, Ntziachristos V. Hybrid system for simultaneous fluorescence and X-ray computed tomography. IEEE Trans Med Imaging. 2010;29:465–473. doi: 10.1109/TMI.2009.2035310. [DOI] [PubMed] [Google Scholar]
- 6.Lin Y, Barber WC, Iwanczyk JS, Roeck WW, Nalcioglu O, Gulsen G. Quantitative fluorescence tomography using a trimodality system: in vivo validation. J Biomed Opt. 2010;15:040503. doi: 10.1117/1.3467495. [DOI] [PMC free article] [PubMed] [Google Scholar]
- 7.Kepshire D, Mincu N, Hutchins M, Gruber J, Dehghani H, Hypnarowski J, Leblond F, Khayat M, Pogue BW. A microcomputed tomography guided fluorescence tomography system for small animal molecular imaging. Rev Sci Instrum. 2009;80:043701. doi: 10.1063/1.3109903. [DOI] [PMC free article] [PubMed] [Google Scholar]
- 8.Davis SC, Pogue BW, Springett R, Leussler C, Mazurkewitz P, Tuttle SB, Gibbs-Strauss SL, Jiang SS, Dehghani H, Paulsen KD. Magnetic resonance–coupled fluorescence tomography scanner for molecular imaging of tissue. Rev Sci Instrum. 2008;79:064302. doi: 10.1063/1.2919131. [DOI] [PMC free article] [PubMed] [Google Scholar]
- 9.Nothdurft RE, Patwardhan SV, Akers W, Ye Y, Achilefu S, Culver JP. In vivo fluorescence lifetime tomography. J Biomed Opt. 2009;14:024004. doi: 10.1117/1.3086607. [DOI] [PubMed] [Google Scholar]
- 10.Corlu A, Choe R, Durduran T, Rosen MA, Schweiger M, Arridge SR, Schnall MD, Yodh AG. Three-dimensional in vivo fluorescence diffuse optical tomography of breast cancer in humans. Opt Express. 2007;15:6696–6716. doi: 10.1364/oe.15.006696. [DOI] [PubMed] [Google Scholar]
- 11.Zavattini G, Vecchi S, Mitchell G, Weisser U, Leahy RM, Pichler BJ, Smith DJ, Cherry SR. A hyperspectral fluorescence system for 3D in vivo optical imaging. Phys Med Biol. 2006;51:2029–2043. doi: 10.1088/0031-9155/51/8/005. [DOI] [PubMed] [Google Scholar]
- 12.Kumar ATN, Raymond SB, Dunn AK, Bacskai BJ, Boas DA. A time domain fluorescence tomography system for small animal imaging. IEEE Trans Med Imaging. 2008;27:1152–1163. doi: 10.1109/TMI.2008.918341. [DOI] [PMC free article] [PubMed] [Google Scholar]
- 13.Venugopal V, Chen J, Lesage F, Intes X. Full-field time-resolved fluorescence tomography of small animals. Opt Lett. 2010;35:3189–3191. doi: 10.1364/OL.35.003189. [DOI] [PubMed] [Google Scholar]
- 14.Nouizi F, Chabrier R, Torregrossa M, Poulet P. 3D modeling for solving forward model of no-contact fluorescence diffuse optical tomography method. Proc SPIE. 2009;7369:73690C. [Google Scholar]
- 15.Koenig A, Hervé L, Gonon G, Josserand V, Berger M, Dinten JM, Boutet J, Peltié P, Coll JL, Rizo P. Fluorescence diffuse optical tomography for free-space and multifluorophore studies. J Biomed Opt. 2010;15:016016. doi: 10.1117/1.3309738. [DOI] [PubMed] [Google Scholar]
- 16.Pian Q, Yao R, Zhao L, Intes X. Hyperspectral time-resolved wide-field fluorescence molecular tomography based on structured light and single-pixel detection. Opt Lett. 2015;40:431–434. doi: 10.1364/OL.40.000431. [DOI] [PMC free article] [PubMed] [Google Scholar]
- 17.Lapointe E, Pichette J, Bérubé-Lauzière Y. A multi-view time-domain non-contact diffuse optical tomography scanner with dual wavelength detection for intrinsic and fluorescence small animal imaging. Rev Sci Instrum. 2012;83:063703. doi: 10.1063/1.4726016. [DOI] [PubMed] [Google Scholar]
- 18.Lihong H-IW, Wang V. Biomedical Optics: Principles and Imaging. Wiley-Interscience; 2007. [Google Scholar]
- 19.Xu X, Liu H, Wang LV. Time-reversed ultrasonically encoded optical focusing into scattering media. Nat Photonics. 2011;5:154–157. doi: 10.1038/nphoton.2010.306. [DOI] [PMC free article] [PubMed] [Google Scholar]
- 20.Lin Y, Ghijsen MT, Gao H, Liu N, Nalcioglu O, Gulsen G. A photo-multiplier tube-based hybrid MRI and frequency domain fluorescence tomography system for small animal imaging. Phys Med Biol. 2011;56:4731–4747. doi: 10.1088/0031-9155/56/15/007. [DOI] [PMC free article] [PubMed] [Google Scholar]
- 21.Gruber JD, Paliwal A, Krishnaswamy V, Ghadyani H, Jermyn M, O’Hara JA, Davis SC, Kerley-Hamilton JS, Shworak NW, Maytin EV, Hasan T, Pogue BW. System development for high frequency ultrasound-guided fluorescence quantification of skin layers. J Biomed Opt. 2010;15:026028. doi: 10.1117/1.3374040. [DOI] [PMC free article] [PubMed] [Google Scholar]
- 22.Lin Y, Barber WC, Iwanczyk JS, Roeck W, Nalcioglu O, Gulsen G. Quantitative fluorescence tomography using a combined tri-modality FT/DOT/XCT system. Opt Express. 2010;18:7835–7850. doi: 10.1364/OE.18.007835. [DOI] [PMC free article] [PubMed] [Google Scholar]
- 23.Davis SC, Dehghani H, Wang J, Jiang S, Pogue BW, Paulsen KD. Image-guided diffuse optical fluorescence tomography implemented with Laplacian-type regularization. Opt Express. 2007;15:4066–4082. doi: 10.1364/oe.15.004066. [DOI] [PubMed] [Google Scholar]
- 24.Lin Y, Gao H, Nalcioglu O, Gulsen G. Fluorescence diffuse optical tomography with functional and anatomical a priori information: feasibility study. Phys Med Biol. 2007;52:5569–5585. doi: 10.1088/0031-9155/52/18/007. [DOI] [PubMed] [Google Scholar]
- 25.Yalavarthy BPP, Dehghani H, Carpenter C, Jiang S, Paulsen K. Structural information within regularization matrices improves near infrared diffuse optical tomography. Opt Express. 2007;15:8043–8058. doi: 10.1364/oe.15.008043. [DOI] [PubMed] [Google Scholar]
- 26.Zhou L, Yazici B, Ntziachristos V. Fluorescence molecular-tomography reconstruction with a priori anatomical information. Proc SPIE. 2008;6868:68680O. [Google Scholar]
- 27.Chen Y, Li X. Biomedical Optics and 3-D Imaging, Technical Digest. Optical Society of America; 2010. Thermo/pH-responsive and reversible NIR fluorescent probes for optical molecular imaging. paper JMA105. [Google Scholar]
- 28.Escobar-Chávez JJ, López-Cervantes M, Naïk A, Kalia YN, Quintanar-Guerrero D, Ganem-Quintanar A. Applications of thermo-reversible pluronic F-127 gels in pharmaceutical formulations. J Pharm Pharm Sci. 2006;9:339–358. [PubMed] [Google Scholar]
- 29.Kim T, Chen Y, Mount C, Gombotz W, Li X, Pun S. Evaluation of temperature-sensitive, indocyanine green-encapsulating micelles for noninvasive near-infrared tumor imaging. Pharm Res. 2010;27:1900–1913. doi: 10.1007/s11095-010-0190-y. [DOI] [PubMed] [Google Scholar]
- 30.Yuan B, Liu Y. Ultrasound-modulated fluorescence from rhodamine B aqueous solution. J Biomed Opt. 2010;15:021321. doi: 10.1117/1.3333546. [DOI] [PubMed] [Google Scholar]
- 31.Yuan B, Liu Y, Mehl PM, Vignola J. Microbubble-enhanced ultrasound-modulated fluorescence in a turbid medium. Appl Phys Lett. 2009;95:181113. [Google Scholar]
- 32.Wang LV. Prospects of photoacoustic tomography. Med Phys. 2008;35:5758–5767. doi: 10.1118/1.3013698. [DOI] [PMC free article] [PubMed] [Google Scholar]
- 33.Li ML, Oh JT, Xie X, Ku G, Wang W, Li C, Lungu G, Stoica G, Wang LV. Simultaneous molecular and hypoxia imaging of brain tumors in vivo using spectroscopic photoacoustic tomography. Proc IEEE. 2008;96:481–489. [Google Scholar]
- 34.Ma R, Taruttis A, Ntziachristos V, Razansky D. Multispectral optoacoustic tomography (MSOT) scanner for whole-body small animal imaging. Opt Express. 2009;17:21414–21426. doi: 10.1364/OE.17.021414. [DOI] [PubMed] [Google Scholar]
- 35.Akers WJ, Kim C, Berezin M, Guo K, Fuhrhop R, Lanza GM, Fischer GM, Daltrozzo E, Zumbusch A, Cai X. Noninvasive photoacoustic and fluorescence sentinel lymph node identification using dye-loaded perfluorocarbon nanoparticles. Acs Nano. 2011;5:173–182. doi: 10.1021/nn102274q. [DOI] [PMC free article] [PubMed] [Google Scholar]
- 36.Kim C, Favazza C, Wang LV. In vivo photoacoustic tomography of chemicals: high-resolution functional and molecular optical imaging at new depths. Chem Rev. 2010;110:2756–2782. doi: 10.1021/cr900266s. [DOI] [PMC free article] [PubMed] [Google Scholar]
- 37.Lin Y, Bolisay L, Ghijsen M, Kwong TC, Gulsen G. Temperature-modulated fluorescence tomography in a turbid media. Appl Phys Lett. 2012;100:073702. doi: 10.1063/1.3681378. [DOI] [PMC free article] [PubMed] [Google Scholar]
- 38.Lin Y, Kwong TC, Bolisay L, Gulsen G. Temperature-modulated fluorescence tomography based on both concentration and lifetime contrast. J Biomed Opt. 2012;17:056007. doi: 10.1117/1.JBO.17.5.056007. [DOI] [PMC free article] [PubMed] [Google Scholar]
- 39.Yuan B, Pei Y, Kandukuri J. Breaking the acoustic diffraction limit via nonlinear effect and thermal confinement for potential deep-tissue high-resolution imaging. Appl Phys Lett. 2013;102:63703. doi: 10.1063/1.4792736. [DOI] [PMC free article] [PubMed] [Google Scholar]
- 40.Ocheltree KB, Frizzel LA. Sound field calculation for rectangular sources. IEEE Trans Ultrason Ferroelectr Freq Control. 1989;36:242–248. doi: 10.1109/58.19157. [DOI] [PubMed] [Google Scholar]
- 41.Wang G, Shen H, Cong W, Zhao S, Wei GW. Temperature-modulated bioluminescence tomography. Opt Express. 2006;14:7852–7871. doi: 10.1364/oe.14.007852. [DOI] [PubMed] [Google Scholar]
- 42.Wissler EH. Pennes’ 1948 paper revisited. J Appl Physiol. 1998;85:35–41. doi: 10.1152/jappl.1998.85.1.35. [DOI] [PubMed] [Google Scholar]
- 43.Lin Y, Yan H, Nalcioglu O, Gulsen G. Quantitative fluorescence tomography with functional and structural a priori information. Appl Opt. 2009;48:1328–1336. doi: 10.1364/ao.48.001328. [DOI] [PMC free article] [PubMed] [Google Scholar]
- 44.Arridge S. Optical tomography in medical imaging. Inverse Prob. 1999;15:R41–R93. [Google Scholar]
- 45.Kepshire DS, Davis SC, Dehghani H, Paulsen KD, Pogue BW. Subsurface diffuse optical tomography can localize absorber and fluorescent objects but recovered image sensitivity is nonlinear with depth. Appl Opt. 2007;46:1669–1678. doi: 10.1364/ao.46.001669. [DOI] [PubMed] [Google Scholar]
- 46.Gao F, Li J, Zhang L, Poulet P, Zhao H, Yamada Y. Simultaneous fluorescence yield and lifetime tomography from time-resolved transmittances of small-animal-sized phantom. Appl Opt. 2010;49:3163–3172. doi: 10.1364/AO.49.003163. [DOI] [PubMed] [Google Scholar]
- 47.Victoria BR, Scott MH, Allan SH, Patrick SS, Suzie HP, Li X. Biomedical Optics, Technical Digest. Optical Society of America; 2008. Stabilized micellar formulation of indocyanine green for near-infrared imaging. paper BSuA4. [Google Scholar]
- 48.Berezin MY, Lee H, Akers W, Achilefu S. Near infrared dyes as lifetime solvatochromic probes for micropolarity measurements of biological systems. Biophys J. 2007;93:2892–2899. doi: 10.1529/biophysj.107.111609. [DOI] [PMC free article] [PubMed] [Google Scholar]


