Significance
Cellular processes take place in dynamic, crowded environments. Single-stranded DNA binding (SSB) proteins are ubiquitous in cells, serving to protect the transient single-stranded (ss)DNA formed during DNA replication, recombination, and repair and recruit numerous other proteins to the ssDNA. SSBs must be displaced or otherwise moved in order for DNA to be replicated or repaired. The motor protein activity of ssDNA translocases could serve in this capacity to facilitate directional movement of SSBs along ssDNA. In this work, we show that high-affinity SSBs can be moved directionally along ssDNA and eventually displaced via the ATP-driven action of ssDNA translocases. This process occurs via nonspecific chemo-mechanical pushing of the SSB along the ssDNA in the direction of translocation.
Keywords: SSB proteins, SF1 translocases, DNA motors, dynamics
Abstract
Single-stranded (ss)DNA binding (SSB) proteins bind with high affinity to ssDNA generated during DNA replication, recombination, and repair; however, these SSBs must eventually be displaced from or reorganized along the ssDNA. One potential mechanism for reorganization is for an ssDNA translocase (ATP-dependent motor) to push the SSB along ssDNA. Here we use single molecule total internal reflection fluorescence microscopy to detect such pushing events. When Cy5-labeled Escherichia coli (Ec) SSB is bound to surface-immobilized 3′-Cy3–labeled ssDNA, a fluctuating FRET signal is observed, consistent with random diffusion of SSB along the ssDNA. Addition of Saccharomyces cerevisiae Pif1, a 5′ to 3′ ssDNA translocase, results in the appearance of isolated, irregularly spaced saw-tooth FRET spikes only in the presence of ATP. These FRET spikes result from translocase-induced directional (5′ to 3′) pushing of the SSB toward the 3′ ssDNA end, followed by displacement of the SSB from the DNA end. Similar ATP-dependent pushing events, but in the opposite (3′ to 5′) direction, are observed with EcRep and EcUvrD (both 3′ to 5′ ssDNA translocases). Simulations indicate that these events reflect active pushing by the translocase. The ability of translocases to chemo-mechanically push heterologous SSB proteins along ssDNA provides a potential mechanism for reorganization and clearance of tightly bound SSBs from ssDNA.
Single-stranded (ss)DNA binding (SSB) proteins play essential roles in genome maintenance, binding transiently, but with high affinity, to ssDNA intermediates to protect them during DNA replication, recombination, and repair (1). SSB proteins also interact with a large array of other proteins (1–7), to bring them to their sites of action on DNA (1). Escherichia coli (Ec) SSB is a homotetramer (8, 9) that binds ssDNA in several binding modes differing in occluded site size and cooperativity depending on salt conditions and SSB concentration (10). Once bound, SSB proteins also function to remove interfering DNA secondary structure (e.g., hairpins) (2, 11). EcSSB binds ssDNA with very high (picomolar to femtomolar) affinities (10, 12, 13), yet these tightly bound and long-lived SSB–ssDNA complexes need to be displaced or moved to complete replication, recombination, and repair. Despite its high affinity for ssDNA, EcSSB is dynamic on ssDNA. EcSSB tetramers can diffuse along ssDNA with a 1D diffusion coefficient, D1 = 270 nt2/s at 37 °C (2, 14), and can undergo direct intra- or intersegment transfer to other DNA sites (13, 15, 16).
DNA helicases/translocases are motor proteins that can translocate directionally and processively along ssDNA at high rates in reactions tightly coupled to ATP binding and hydrolysis (17). Well-studied examples are the Superfamily 1A (SF1A) translocases Bacillus stearothermophilius (Bst)PcrA (18–20), EcUvrD (21–24), EcRep (25, 26), Saccharomyces cerevisiae (Sc) Srs2 (27), and the SF1B translocase ScPif1 (28). Many DNA translocases can use their ATP-dependent motor functions to displace proteins from DNA (28–33). EcUvrD (32, 34) and Bst PcrA (20, 35, 36) act as antirecombinases to remove RecA filaments from ssDNA. Similarly, ScSrs2 removes Rad51 filaments from ssDNA (27, 37, 38). EcRep can disrupt dsDNA binding of proteins such as lac repressor (39, 40). ScPif1 is involved in displacing telomerase from telomeric repeats and double-strand breaks (41–44). EcRecBCD can displace histones (45) and also push dsDNA bound proteins along dsDNA (46, 47).
Although SF1 translocases can displace proteins from ssDNA, there has been no demonstration that an ssDNA translocase can remodel ssDNA–protein complexes by “pushing” them directionally along ssDNA. Here we show that the SF1 ssDNA translocases (ScPif1, EcUvrD, and EcRep) can push a high affinity ssDNA binding protein (EcSSB) along ssDNA, eventually displacing it from ssDNA. Such an activity is likely functionally important in a variety of contexts in genome maintenance.
Results
SSB Diffusion and Dynamics on ssDNA.
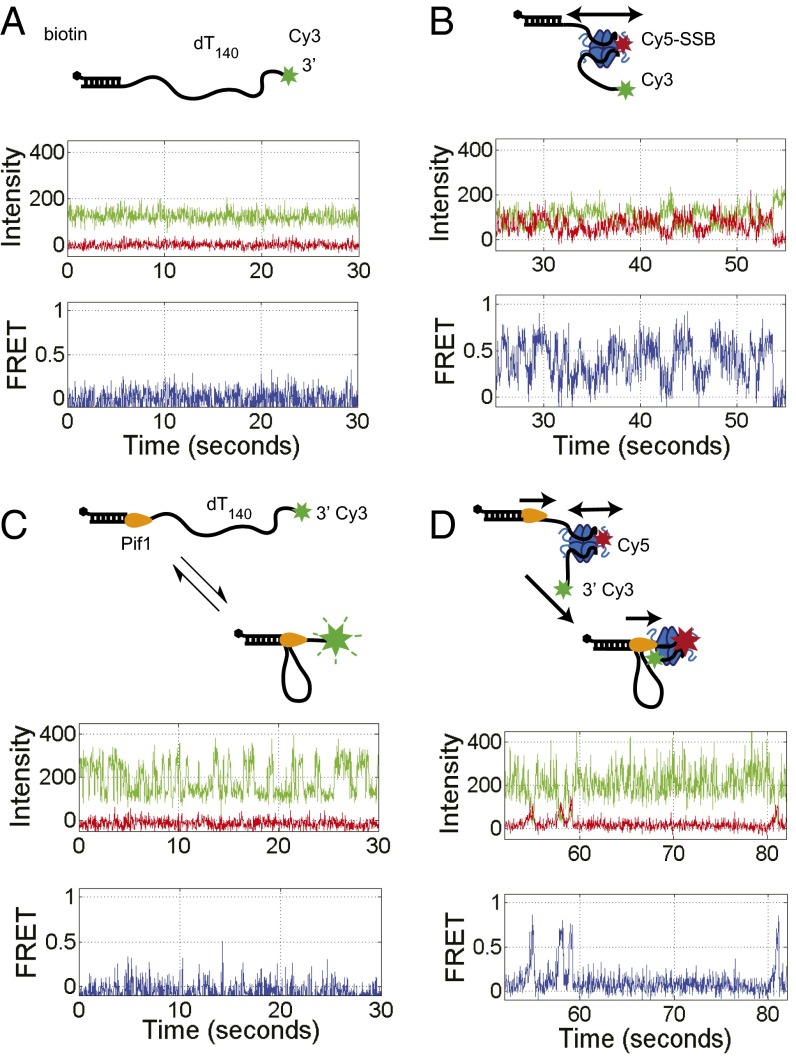
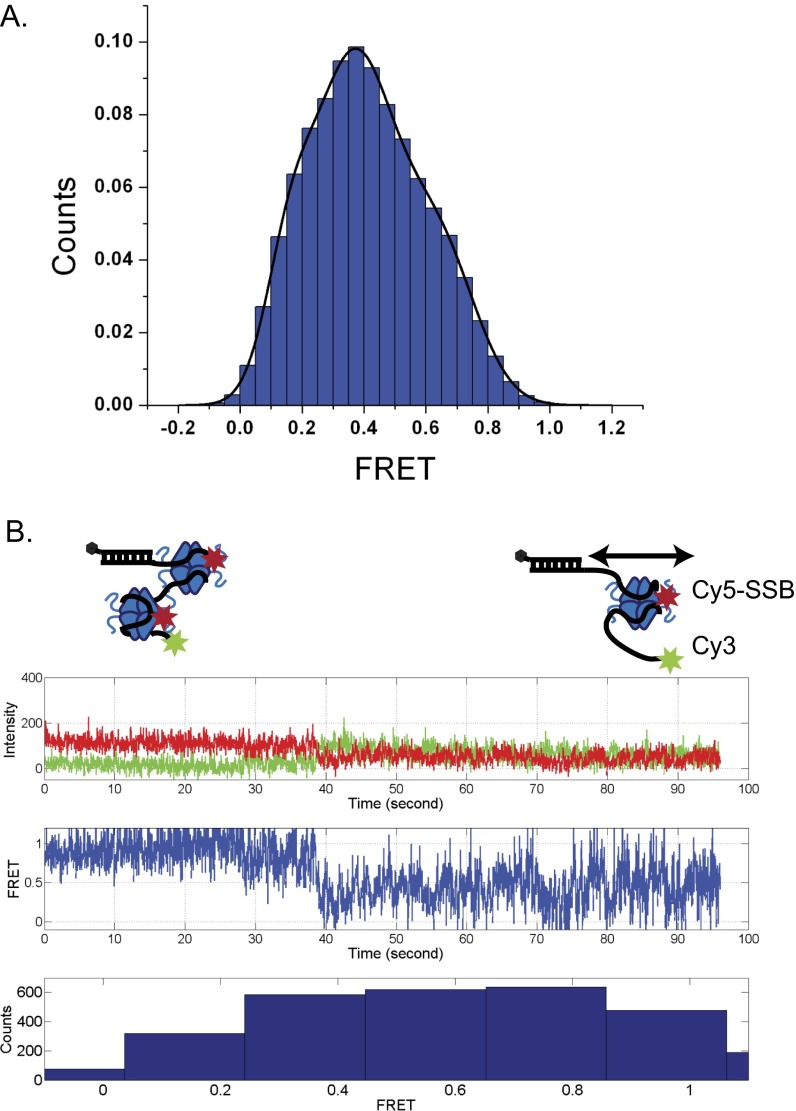
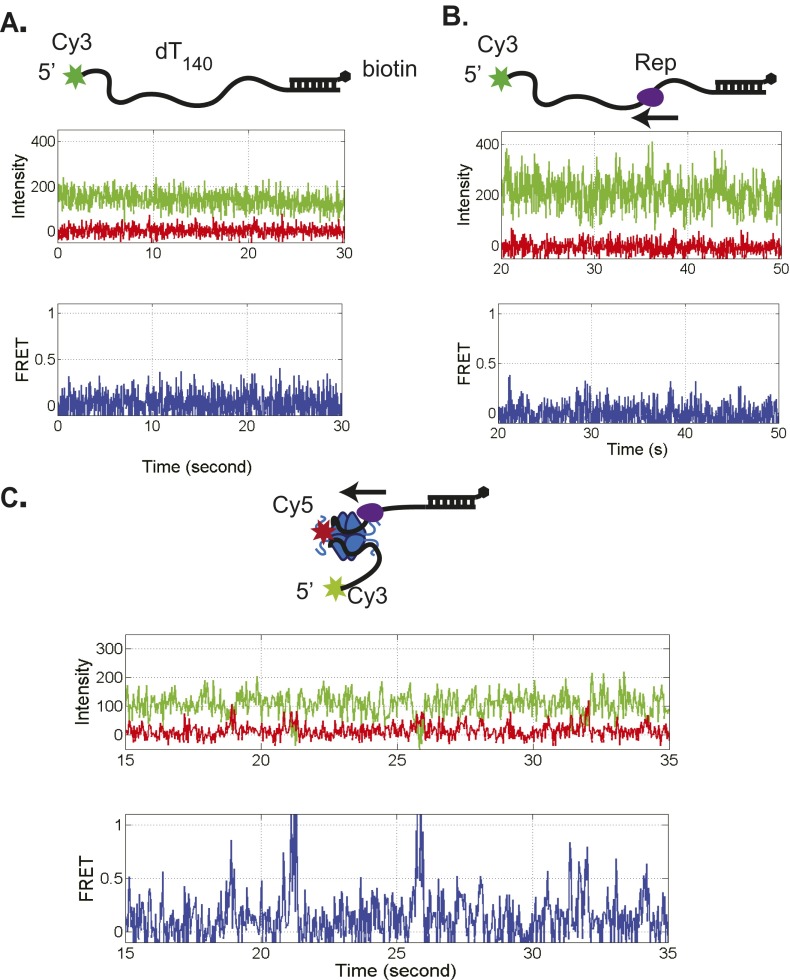
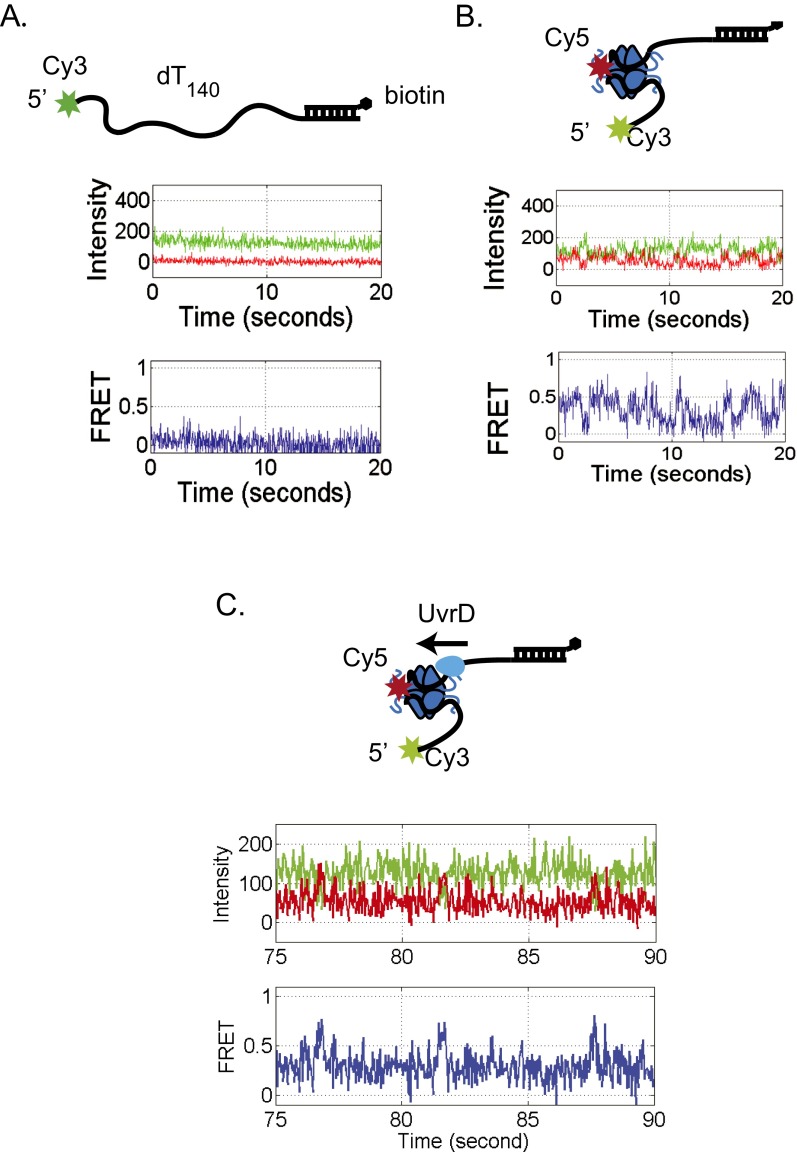
To examine the results of an encounter between a directional translocase and an EcSSB tetramer bound to ssDNA, we designed a single molecule total internal reflection fluorescence (smTIRF) microscopy assay. We used a 140-nt oligodeoxythymidylate [(dT)140] labeled with Cy3 at the 3′ end attached to an 18-bp mixed sequence duplex with a biotin on the 3′ end of the shorter strand (Fig. 1A). This DNA was immobilized on the surface of a slide coated with PEG via a biotin-neutravidin linkage (Materials and Methods). Experiments were conducted at 25 °C in 20 mM Tris⋅HCl, pH 8.1, 100 mM NaCl, and 5 mM MgCl2, conditions under which a single EcSSB tetramer binds in its fully wrapped (SSB)65 binding mode in which all four subunits interact with ssDNA (48). When excited with 532-nm laser light, the DNA alone displays a stable Cy3 fluorescence signal with no significant fluctuations (Fig. 1A). On addition of 1 nM Cy5-labeled SSB tetramer (labeled at A122C with an average of one Cy5 per tetramer), anticorrelated Cy3 and Cy5 fluorescence fluctuations are observed, indicating a fluctuating FRET signal (Fig. 1B) consistent with SSB diffusion along the ssDNA as previously described (2). This FRET signal persists after washing with 100 μL imaging buffer (∼10-fold slide volume), indicating that the fluctuating signal is due to a single bound SSB tetramer. For these solution conditions, the average half-life of an SSB tetramer bound to (dT)70 is at least 20 min (13). Hence, any loss of Cy5 fluorescence is due to photobleaching rather than SSB dissociation. The histogram of FRET efficiencies for Cy5-SSB bound to Cy3-(dT)140 ssDNA shows a broad distribution centered around E = 0.36 (Fig. S1A), indicating that the Cy5-SSB diffuses along the entire length of (dT)140. These fluctuations are consistent with only one Cy5-SSB being bound to the ssDNA under these low SSB concentrations. Experiments performed at much higher SSB concentrations (>400 nM) show time trajectories with a stable high FRET state (>0.9) for a long period (15 s or longer) as expected when two Cy5-SSB tetramers are bound to the same (dT)140 (Fig. S1B). Such stable high FRET signals are not detected at low SSB concentrations (<1 nM).
Fig. 1.
Single molecule TIRF time trajectories showing SSB pushing by Pif1. (A) 3′dT-Cy3-(dT)140 DNA immobilized on the slide surface via a biotin-Neutravidin-biotin linkage displays only Cy3 fluorescence. (B) On addition of Cy5-SSB(A122C) (1 mM) and washing out free protein, anticorrelated Cy3 and Cy5 fluorescence fluctuations are observed indicating SSB diffusion along the ssDNA. (C) Addition of Pif1 (100 nM) to the 3′dT-Cy3-(dT)140 DNA, followed by ATP (5 mM) and washing out free protein, results in repetitive Cy3 enhancement (PIFE) spikes. (D) Addition of Pif1 (100 nM) with ATP (5 mM) to the 3′dT-Cy3-(dT)140 DNA prebound with Cy5-SSB results in a replacement of SSB diffusing FRET signals with Pif1 translocating PIFE signals and intermittent asymmetric FRET spikes reflecting Pif1 pushing of SSB in a 5′ to 3′ direction. Green, Cy3 fluorescence; red, Cy5 fluorescence; blue, FRET efficiency calculated from the Cy3 and Cy5 signals. Solution conditions: 30 mM Tris⋅HCl, pH 8.1, 100 mM NaCl, 5 mM MgCl2, 1 mM DTT, 0.1 mg/mL BSA, 0.5% (wt/vol) dextrose, 3 mM Trolox, 1 mg/mL glucose oxidase, and 0.4 mg/mL catalase, 25 °C.
Fig. S1.
Characteristics of FRET trajectories when one vs. two Cy5-SSB tetramers are bound to 3′dT-Cy-(dT)140 DNA. (A) Histogram of FRET states from Cy3-DNA molecules bound with Cy5-SSB (n = 83). The DNA was incubated with 4 nM Cy5-SSB(A122C) tetramer for 5 min and then washed with 10 column volumes of buffer. (B) Example single molecule trace showing the transition from two Cy5-SSB tetramers bound to a single DNA to one Cy5-SSB tetramers bound. The first 38 s of the trace shows a persistent high FRET state with no fluctuations when two Cy5-SSB tetramers are bound, whereas the second half shows the expected fluctuating FRET signal when a single Cy5-SSB is bound and can diffuse. Solution conditions: 30 mM Tris⋅HCl, pH 8.1, 100 mM NaCl, 5 mM MgCl2, 1 mM DTT, 0.1 mg/mL BSA, 0.5% (wt/vol) dextrose, 3 mM Trolox, 1 mg/mL glucose oxidase, and 0.4 mg/mL catalase, 25 °C.
Pif1 Directional Translocation Along ssDNA.
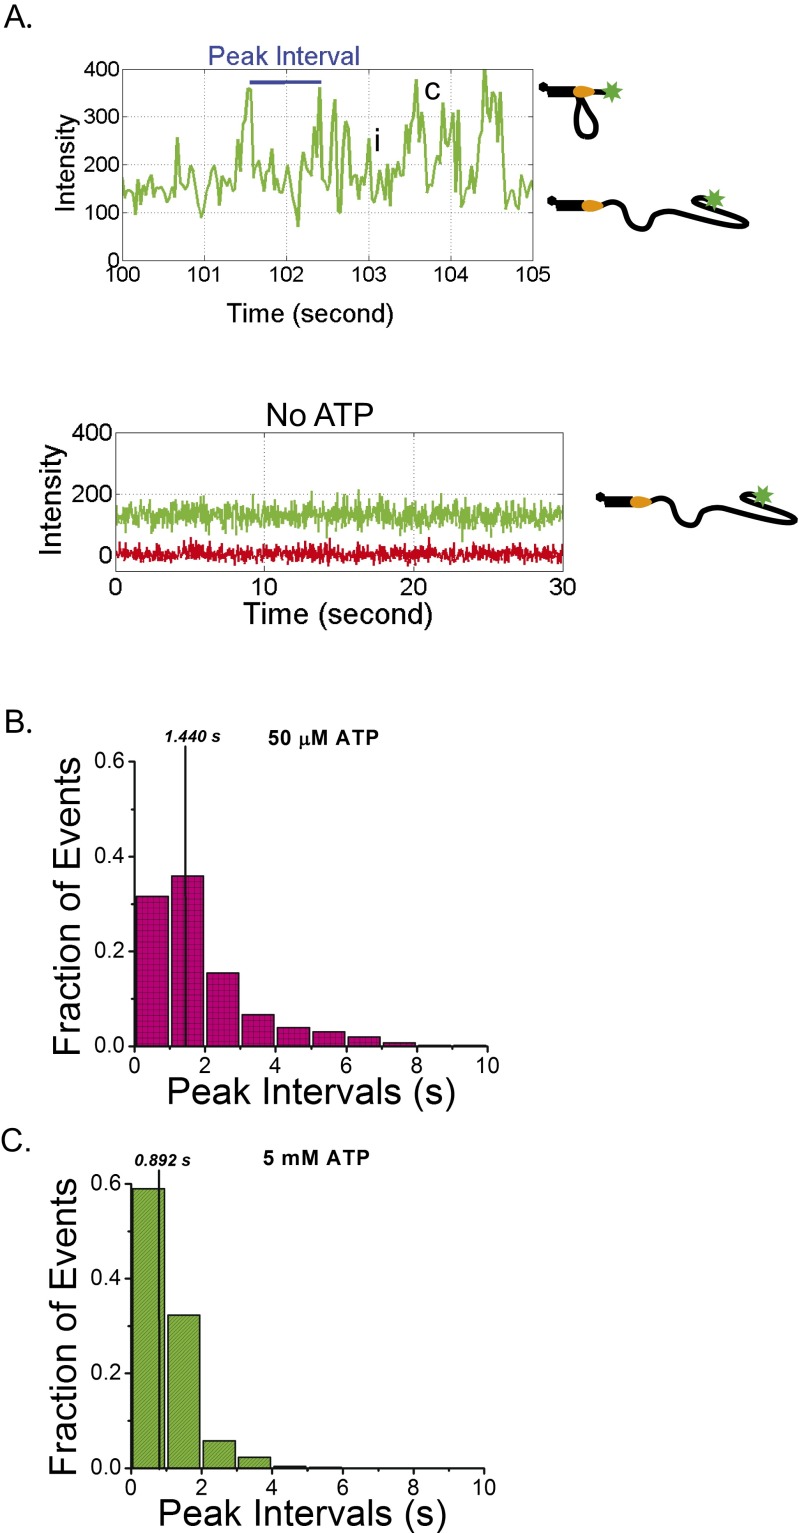
ScPif1 is an SF1B 5′ to 3′ ssDNA translocase that translocates with a rate of 81 ± 8 nt/s on a poly(dT) track at saturating [ATP] [50 mM Tris⋅HCl, pH 8.3, 100 mM NaCl, 5 mM MgCl2, 0.5 mM DTT, and 20% (wt/vol) glycerol, 22 °C] (28). The arrival of Pif1 at the 3′ end of the 3′-dT-Cy3-(dT)140 results in an enhancement of Cy3 fluorescence intensity that can be used to monitor ssDNA translocation (25, 28, 49) and has been referred to as PIFE (protein-induced fluorescence enhancement) (50, 51). Pif1 also binds preferentially to an ss/double-strand (ds)DNA junction and remains bound to the junction while undergoing ATP-dependent ssDNA translocation, resulting in the transient formation of an ssDNA loop (41). Once Pif1 reaches the 3′ end of the ssDNA, the end is released, whereas Pif1 remains bound to the ss/dsDNA junction, where it can reinitiate ssDNA translocation (41). Fig. 1C shows a representative time trajectory for a single Pif1 monomer bound to 3′-dT-Cy3-(dT)140. Pif1 (100 nM) was added to the surface tethered 3′-dT-Cy3-(dT)140, followed by washing the flow cell with a 10-fold buffer volume to ensure that no free Pif1 remains. On addition of ATP (5 mM), repetitive saw-tooth–shaped Cy3 fluorescence increases and decreases are observed reflecting repetitive translocation of a single Pif1 monomer in a 5′ to 3′ direction along the ssDNA (Fig. 1C). In the absence of ATP, Pif1 binding to the 3′-dT-Cy3-(dT)140 shows only a minor enhancement of Cy3 fluorescence with no repetitive saw-tooth character (Fig. S2). The spacing between Pif1 induced Cy3-PIFE events is dependent on both ATP concentration and ssDNA tail length (Fig. S2) as noted previously (41).
Fig. S2.
ScPif1 repetitive translocation on (dT)140. (A) A segment of the repetitive Cy3 enhancement (PIFE) signal observed when ATP is added to a surface immobilized 3′-dT-Cy3-(dT)140 DNA previously incubated with 100 nM Pif1 and subsequently washed with buffer to remove unbound Pif1. The peak interval is defined as the time between the maximum of two Cy3 emission peaks. An example of a complete translocation event where the Pif1 reaches the 3′ end of the ssDNA is marked by c. The Pif1 then releases the ssDNA while remaining bound at the junction so that it can undergo another translocation event. An example of an incomplete translocation event where the Pif1 does not reach the 3′ end before releasing the ssDNA is marked by i. In the absence of ATP, no repetitive Cy3 enhancement is observed. (B) Histogram of peak intervals for Pif1 translocation at 50 μM ATP. The average peak interval was 2.0 ± 1.7 s and the median peak interval was 1.440 s (567 events collected from 54 molecules). (C) Histogram of peak intervals for Pif1 translocation at 5 mM ATP. The average peak interval was 1.1 ± 0.7 s and the median peak interval was 0.892 s (517 events collected from 33 molecules). Solutions conditions: 30 mM Tris⋅HCl, pH 8.1, 100 mM NaCl, 5 mM MgCl2, 1 mM DTT, 0.1 mg/mL BSA, 0.5% (wt/vol) dextrose, 3 mM Trolox, 1 mg/mL glucose oxidase, and 0.4 mg/mL catalase, 25 °C.
Directional Pushing of SSB Along ssDNA by a Translocating Pif1 Monomer.
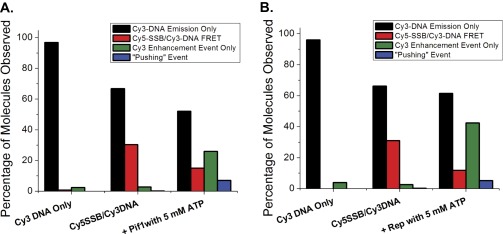
Surface immobilized 3′-dT-Cy3-(dT)140 prebound with no more than a single Cy5-SSB tetramer shows the FRET fluctuations characteristic of SSB diffusion (Fig. 1B). On addition of Pif1 (100 nM) and ATP (5 mM), the population of single molecule traces showing SSB diffusion rapidly diminished and was replaced by traces displaying repetitive Pif1 translocation (Fig. S3), indicating clearance of SSB from the ssDNA. Pif1 does not show clearance of SSB in the absence of ATP (Fig. S4). In 16.6% (55/332) of the DNA molecules showing Pif1 translocation activity, anticorrelated Cy3/Cy5 FRET spikes are also observed at irregularly spaced time intervals (Fig. 1D and Fig. S3A). These FRET spikes are asymmetric in shape with a gradual increase to a maximum FRET value followed by a sudden decrease to baseline. These intermittent FRET spikes are consistent with transient binding of a Cy5-SSB to the DNA followed by directional (5′ to 3′) pushing by the Pif1 motor of the Cy5-SSB toward the 3′-Cy3 end of the (dT)140. The frequency distributions shown in Fig. S3 suggest that many pushing events have occurred by the time recording was started, as indicated by the decrease in the number of time trajectories showing SSB diffusion behavior and the increase in the number of Pif1 repetitive translocation trajectories.
Fig. S3.
Observed signal distributions for each step in a translocase-SSB pushing assay. (A) Percentage of each type of single molecule behavior observed for each condition for Pif1 pushing and displacement of Cy5-SSB: surface immobilized 3′-Cy3-(dT)140 DNA: n = 419; 3′-Cy3-(dT)140 DNA postincubation with 1 nM Cy5-SSBtet, N = 1,124 ; 3′-Cy3-(dT)140 DNA/Cy5-SSB within 1 min of addition of 100 nM Pif1 and 50 μM ATP, n = 127. (B) Percentage of each type of single molecule behavior observed for each condition for Rep pushing and displacement of Cy5-SSB: surface immobilized 5′-Cy3-(dT)140 DNA, n = 281; 5′-Cy3 (dT)140 DNA postincubation with 1 nM Cy5-SSB, N = 466; 5′-Cy3-(dT)140 DNA/Cy5-SSB within 1 min of addition of 100 nM Rep and 5 mM ATP, n = 288. Cy3 DNA emission only (black columns) had only stable Cy3 emission with no enhancement spikes or Cy5 emission observed. Cy5-SSB/Cy3-DNA FRET (red columns) displayed anticorrelated Cy3 and Cy5 emission. The Cy3 enhancement event (green columns) exhibited saw-tooth spikes of enhanced Cy3 emission (PIFE). Pushing event (blue column) indicates molecules that show a high FRET signal that disappears in a near step function and is replaced by repetitive Cy3 enhancement (PIFE).
Fig. S4.
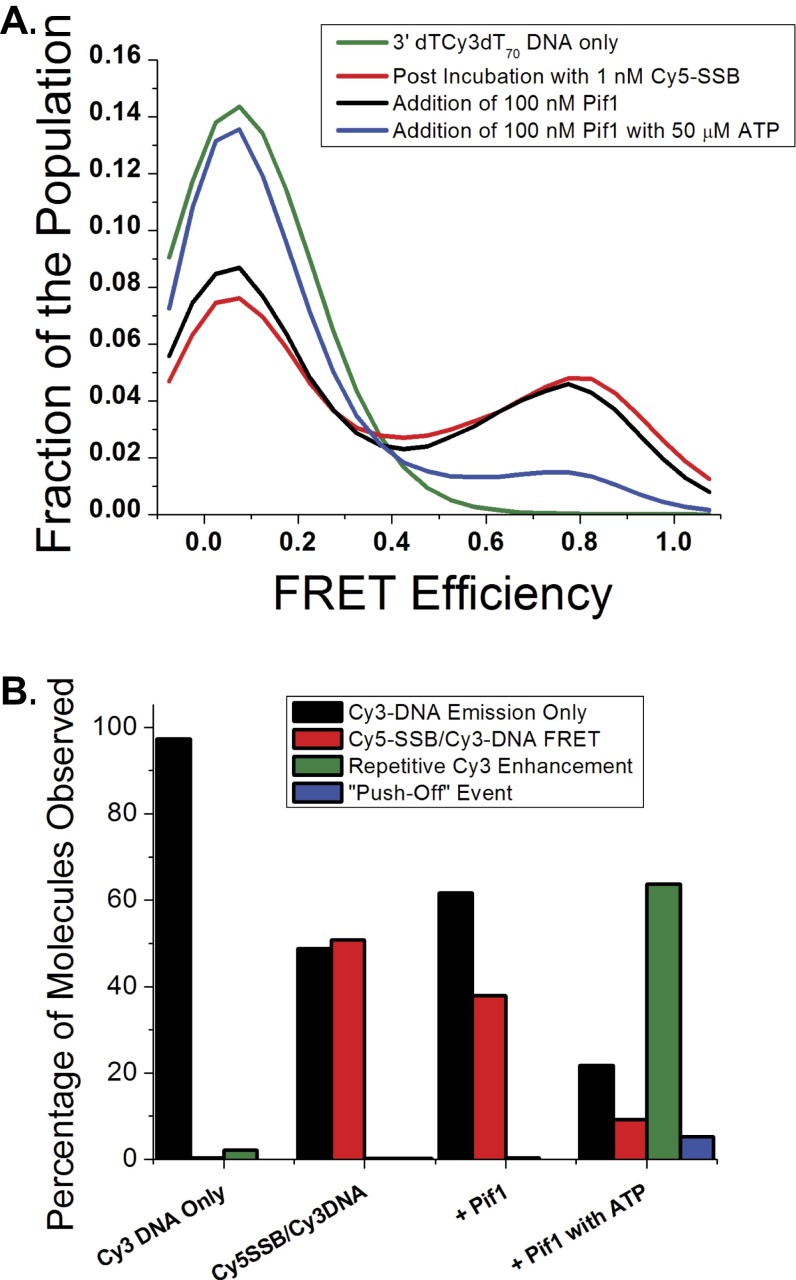
Pif1-induced displacement of Cy5-SSB from 3′-dT-Cy3-(dT)70 DNA is ATP dependent. (A) FRET histograms for 3′-dT-Cy3-(dT)70 DNA only (green line), after incubation with 1 nM Cy5-SSB and subsequent washing away of unbound protein (red line), addition of 100 nM ScPif1 to Cy5-SSB/3′-dT-Cy3-(dT)70 DNA (black line), and addition of 100 nM ScPif1 with 50 μM ATP to Cy5-SSB/3′-dT-Cy3-(dT)70 DNA (blue line). n = 200 molecules for each condition. (B) Percentage of each type of single molecule behavior observed for each condition described in A. Cy3 DNA emission only (black columns) had only stable Cy3 emission with no enhancement spikes or Cy5 emission observed. Cy5-SSB/Cy3-DNA FRET (red columns) displayed anticorrelated Cy3 and Cy5 emission. The repetitive Cy3 enhancement (green columns) exhibited regularly spaced saw-tooth spikes of enhanced Cy3 emission (PIFE). Push-off event (blue column) indicates molecules that show a high FRET signal that disappears in a near step function and is replaced by repetitive Cy3 enhancement (PIFE).
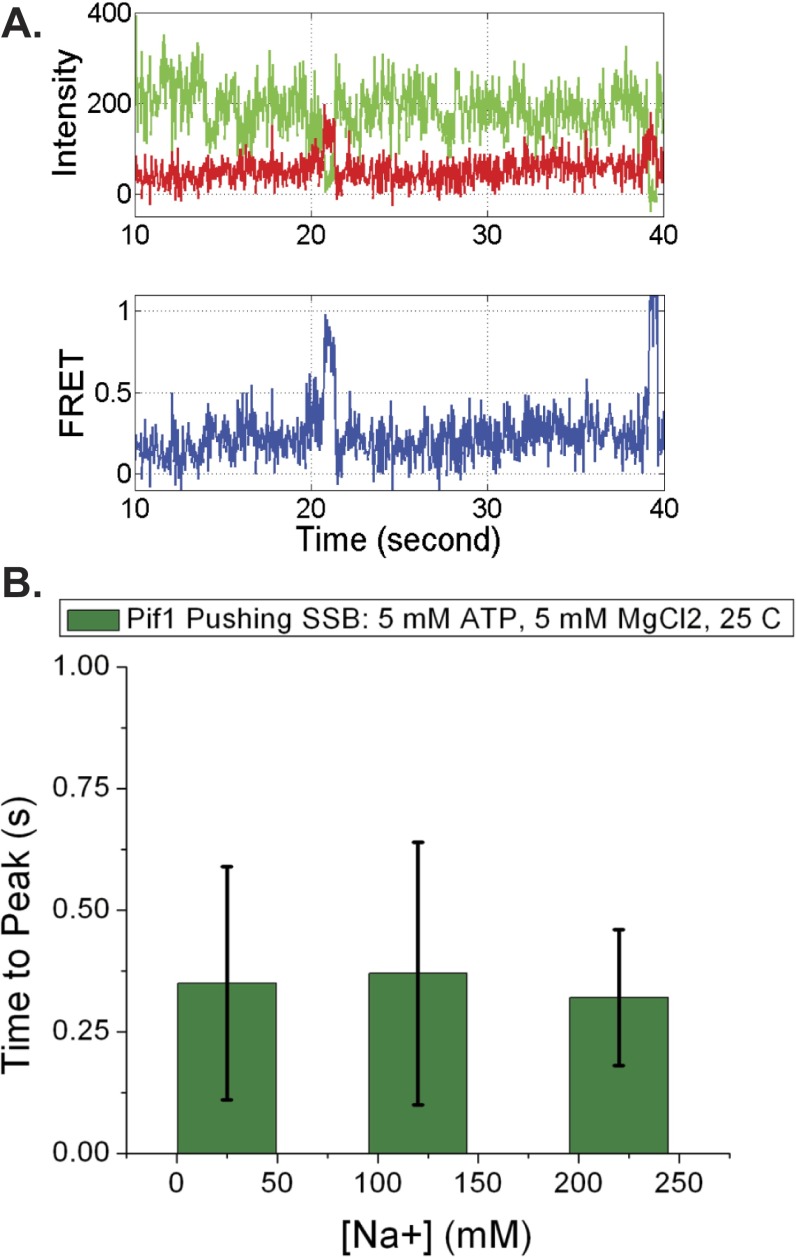
On reversing the order of addition by first adding Pif1 (100 nM) and then Cy5-SSB (1 nM) and ATP (50 μM or 5 mM), we observed similar asymmetric FRET spikes (Fig. S5A). Eventually, after ∼5 min of incubation, the repetitive Cy3 PIFE signals reflecting Pif1 translocation are replaced by fluctuating FRET signals reflecting Cy5-SSB diffusion on the Cy3 ssDNA. This behavior reflects loss of Pif1 from the DNA and replacement by SSB either due to direct dissociation of Pif1 or possibly a Pif1-SSB collision that results in Pif1 dissociation.
Fig. S5.
The observation of a FRET spike reflecting SSB pushing by Pif1 does not depend on order of addition or sodium chloride concentration. (A) Representative trace of SSB-Pif1 collisions resulting in SSB pushing that occurs when 0.8 nM SSB with 5 mM ATP is added to previously formed Pif1/ 3′-dT-Cy3-(dT)140 DNA complexes. (B) Comparison of time to peak values for Pif1 pushing of SSB at 25, 120, and 220 mM NaCl.
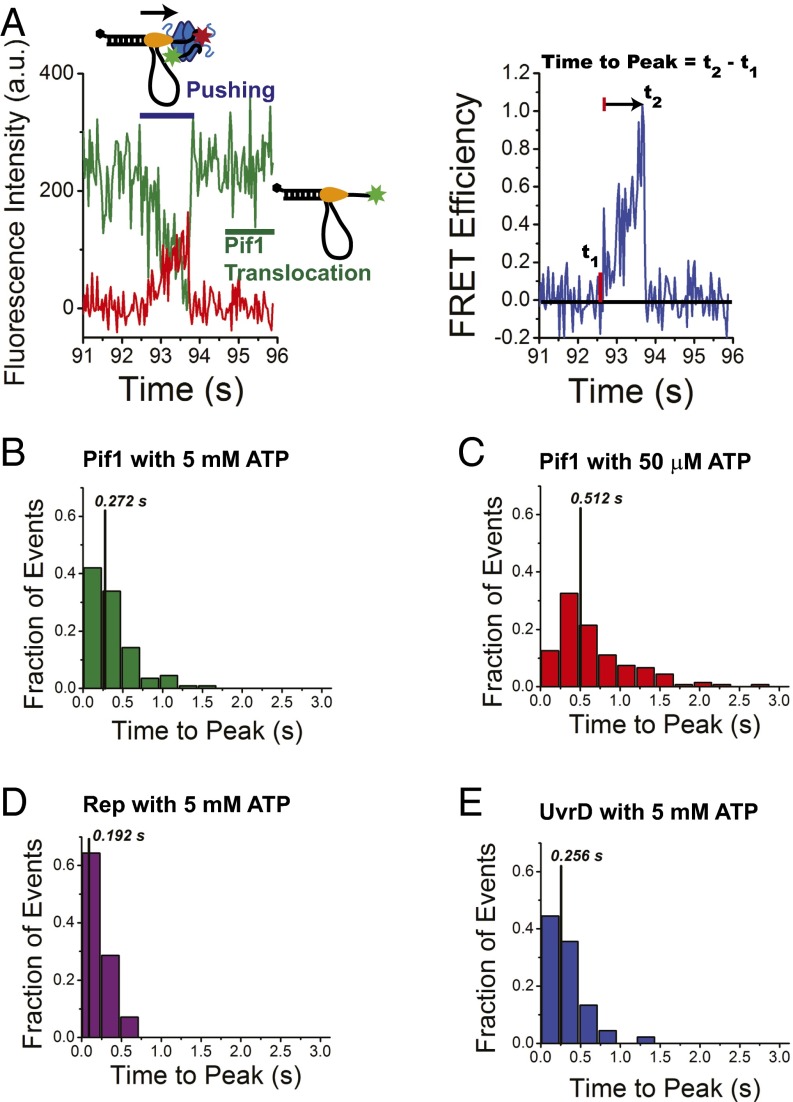
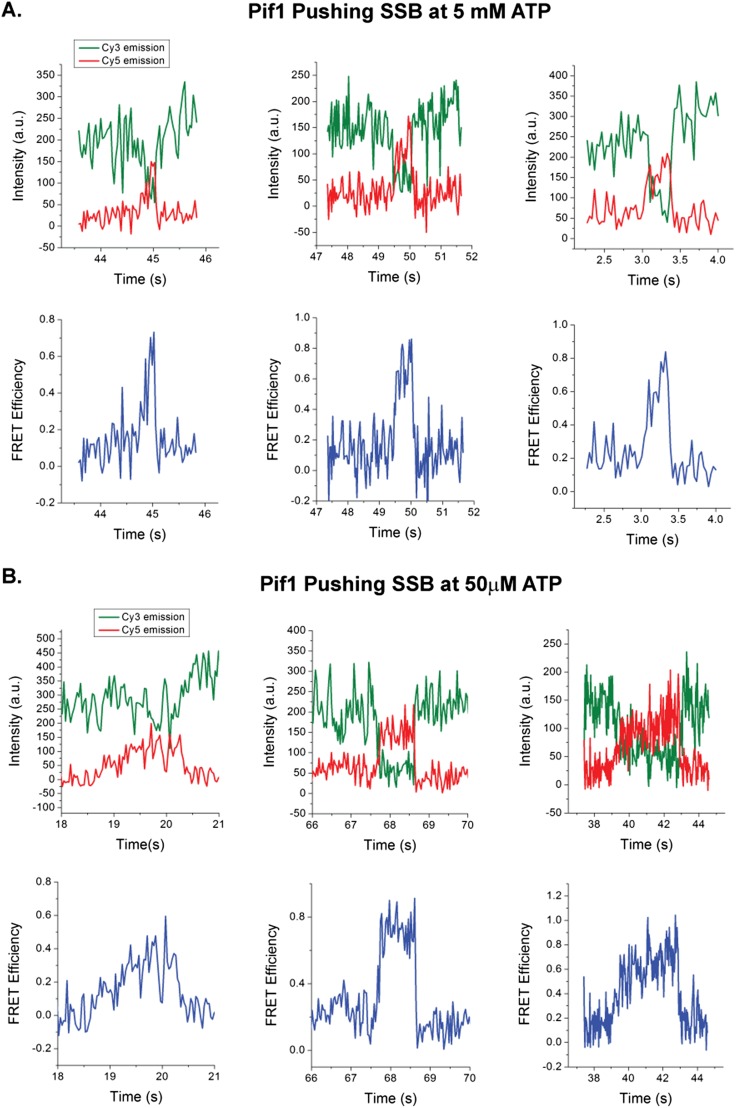
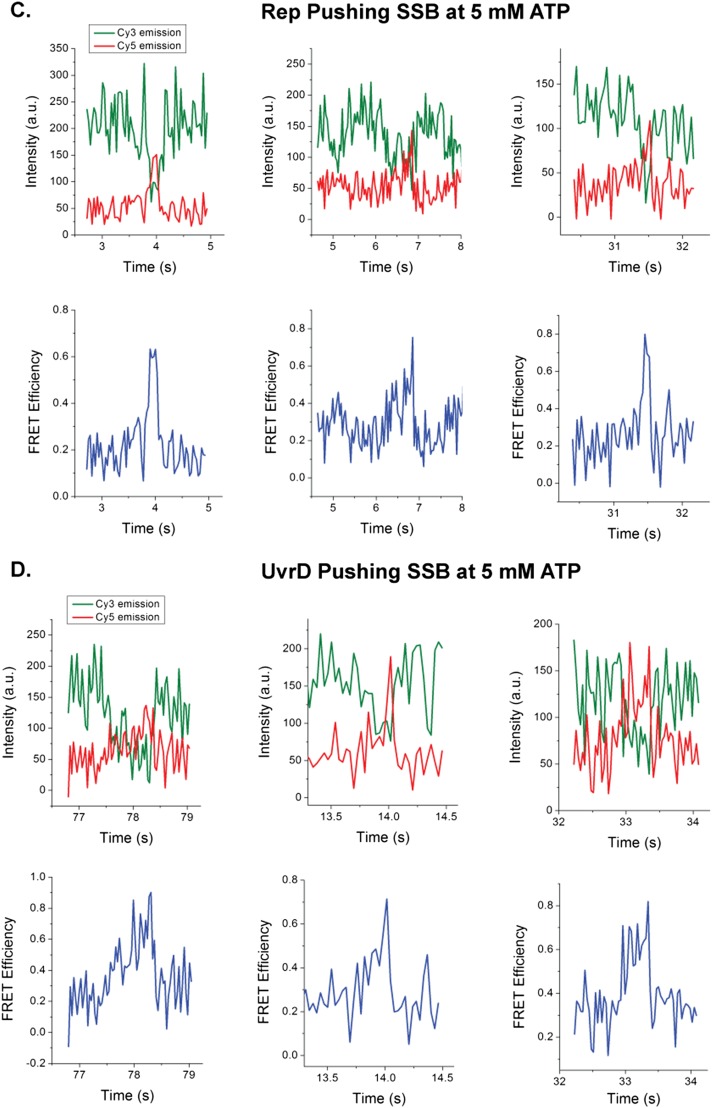
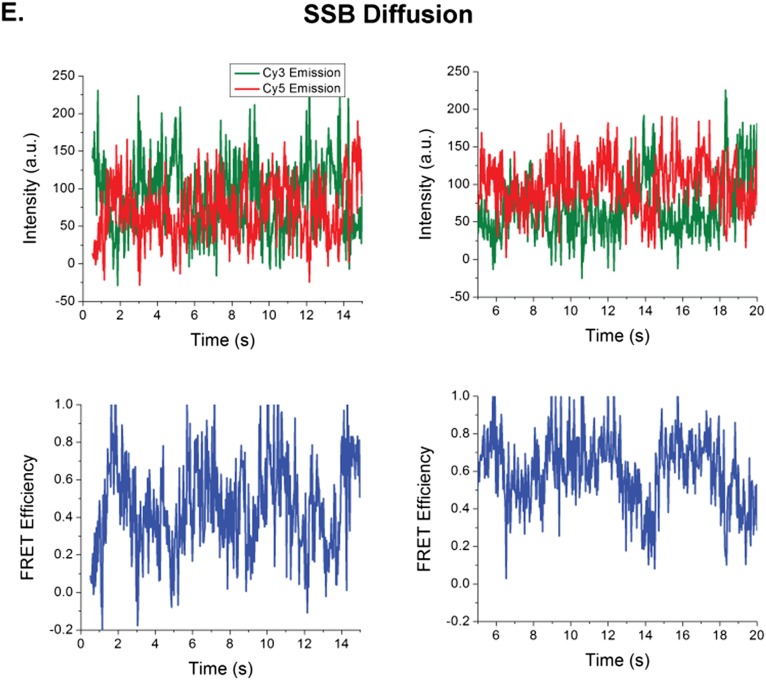
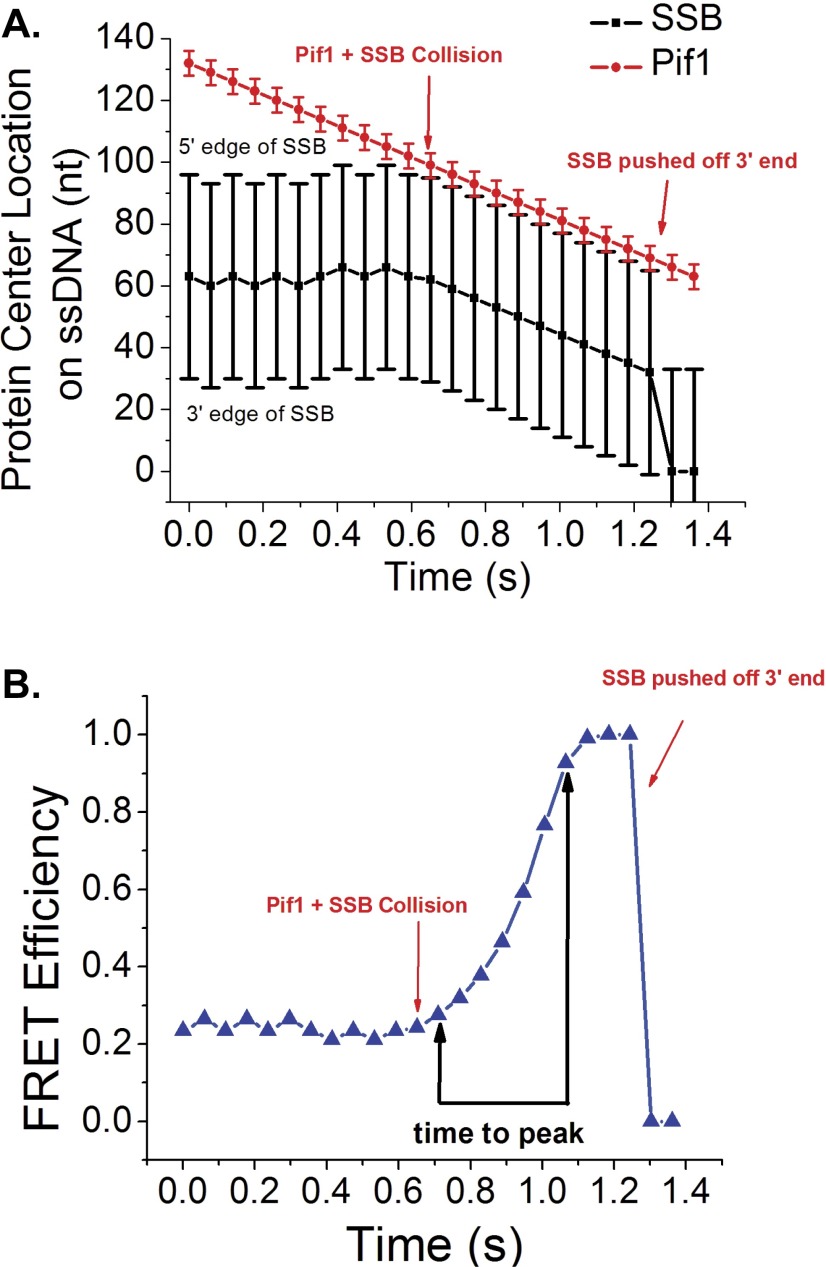
We used four criteria for scoring a Cy5 FRET spike as resulting from a Pif1 translocase-SSB collision: (i) The Cy5 fluorescence increase must be accompanied by an anticorrelated Cy3 fluorescence decrease; (ii) the FRET spike must be asymmetric with a gradual rise to a maximum followed by a sudden drop to zero FRET; (iii) the FRET spike must be preceded by and followed by the repetitive Cy3 PIFE spikes reflecting Pif1 translocation along ssDNA; and (iv) the FRET spikes must be isolated from other FRET events. Fig. 2A shows an example of the standard shape of a FRET spike resulting from a Pif1 collision with SSB. The gradual increase in FRET with time indicates a decrease in the distance between the Cy5-labeled SSB and the Cy3 at the 3′ end of the (dT)140, consistent with directional (5′ to 3′) pushing of SSB. The subsequent sharp loss of FRET reflects displacement of SSB from the DNA. Other examples of FRET spikes resulting from translocase-induced pushing of SSB are shown in Fig. S6. Note that these isolated, asymmetric FRET spikes differ significantly from the clustered, symmetric FRET fluctuations reflecting diffusion of Cy5-SSB on ssDNA (Fig. S6E). The use of these stringent criteria to identify pushing events likely underestimates the actual number of translocase–SSB collisions. For example, events where an SSB binds initially in the 3′-half of the ssDNA and is then pushed by the translocase would not meet these criteria because such events would start at a FRET value higher than baseline.
Fig. 2.
Analysis of the translocase-induced FRET spikes reflecting SSB pushing. (A) Asymmetric FRET spikes identified as a gradual increase in FRET followed by a sharp decrease in FRET. The spike is preceded and followed by spikes in Cy3 fluorescence due to Pif1 translocation. The time-to-peak is determined from the time, t1, at which the signal increases above the baseline average to the time, t2, where the FRET value reaches its maximum. (Left) Raw Cy3 and Cy5 fluorescence emission time trajectories. (Right) Corresponding FRET signal. (B) Histogram of time-to-peak values for Pif1-SSB collisions at 5 mM ATP. The median value for the distribution (vertical black line) is 0.272 s; mean value = 0.4 s; SD = 0.3 s (n = 112 events). (C) Histogram of time-to-peak values for Pif1-SSB collisions at 50 μM ATP. Median value for the distribution is 0.512 s; mean value = 0.7 s; SD = 0.6 s (n = 136 events). (D) Histogram of time-to-peak values for Rep-SSB collisions at 5 mM ATP. The median value for the distribution is 0.192 s; mean value = 0.2 s; SD = 0.1 s (n = 42 events). (E) Histogram for time-to-peak values for UvrD-SSB collisions at 5 mM ATP. The median value for the distribution is 0.256 s; mean value = 0.3 s; SD = 0.2 s (n = 45 events).
Fig. S6.
Examples of Cy5-SSB being pushed by ssDNA translocases and diffusing freely on (dT)140. (A) Sample pushing FRET peaks for Pif1 pushing Cy5-SSB on 3′dT-Cy3-(dT)140 at 5 mM ATP. (B) Sample pushing FRET peaks for Pif1 pushing Cy5-SSB on 3′dT-Cy3-(dT)140 at 50 μM ATP. (C) Sample pushing FRET peaks for Rep pushing Cy5-SSB on 5′dT-Cy3-(dT)140 at 5 mM ATP. (D) Sample pushing FRET peaks for UvrD pushing Cy5-SSB on 5′dT-Cy3-(dT)140 at 5 mM ATP. (E) Sample FRET fluctuations for Cy5-SSB diffusing on 3′dT-Cy3-(dT)140. Solution conditions: 30 mM Tris⋅HCl, pH 8.1, 100 mM NaCl, 5 mM MgCl2, 1 mM DTT, 0.1 mg/mL BSA, 0.5% (wt/vol) dextrose, 3 mM Trolox, 1 mg/mL glucose oxidase, and 0.4 mg/mL catalase, 25 °C. Green, Cy3 fluorescence; red, Cy5 fluorescence; blue, FRET efficiency calculated from Cy3 and Cy5 emission intensities.
The shapes of the FRET spikes suggest that Pif1 pushes the SSB uni-directionally along the ssDNA, eventually displacing SSB from the 3′ end of the DNA. Once displaced, it is difficult for SSB to rebind due to the constant repetitive ssDNA translocation of Pif1, explaining the long time intervals between FRET spikes. Once an SSB rebinds to the ssDNA, it is again pushed off the end of the DNA by Pif1. Most of the FRET spikes display a sharp drop in FRET after reaching its maximum value; however, some display a longer dwell time (pause) in the maximum FRET (typically less than 100 ms but sometimes as long as a second). These pauses could result from saturation of the FRET signal as the SSB approaches the Cy3, as we see in some of our simulations discussed below. However, the pauses may also result from the increased energy required to displace SSB from an ssDNA end compared with pushing SSB along the ssDNA, which is a near isoenergetic process. Multiple ATP hydrolysis cycles may be needed to displace SSB from the ssDNA end.
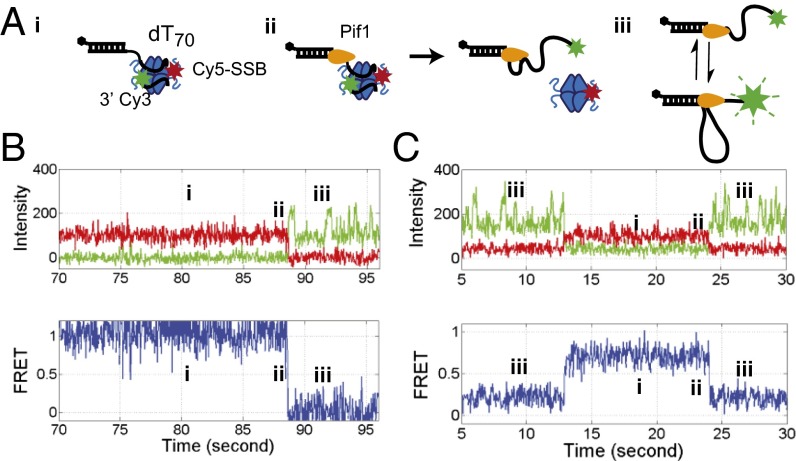
To more directly determine whether Pif1 can push an SSB from the end of ssDNA, we used a shorter 3′-dT-Cy3-(dT)70 DNA (Fig. 3). On this shorter ssDNA, the Cy5-SSB does not have room to undergo significant diffusion, so a bound Cy5-SSB results in a high stable FRET signal that does not exhibit the rapid large-scale fluctuations observed for Cy5-SSB on 5′-dT Cy3-(dT)140 DNA (Fig. 1B). Addition of ScPif1 (100 nM) with ATP (50 μM) results in loss of the bound Cy5-SSB FRET signal and replacement by the repetitive Cy3 enhancement spikes characteristic of Pif1 translocation, reflecting clearance of the SSB from the DNA (Fig. S4). Displacement of SSB by Pif1 is observed as a sudden drop in Cy5 emission and the coincident onset of a saw-tooth–shaped repetitive Cy3 fluorescence enhancement (Fig. 3 B and C). With this shorter ssDNA substrate, no saw-tooth–shaped FRET spikes are observed as each Pif1-SSB encounter results in SSB displacement because there is no free ssDNA along which to push the SSB. When a displaced Cy5-SSB rebinds ssDNA, this is accompanied by a sudden increase from no FRET to high FRET (Fig. 3C). The SSB remains bound until another Pif1 can establish a foothold and displace the SSB once again.
Fig. 3.
Pif1 can push SSB off the end of 3′-dT-Cy3-(dT)70 DNA. (A) Cartoons representing the three states of the DNA after Pif1 and ATP are added to 3′-dT-Cy3-(dT)70 DNA prebound with Cy5-SSB: (i) Cy5-SSB bound to 3′-dT-Cy3-(dT)70. (ii) Pif1 binds at the ss/dsDNA junction and pushes SSB off the 3′-DNA end using its ATP driven 5′ to 3′ translocation. (iii) Repetitive 5′ to 3′ translocation of Pif1 along the ssDNA. (B) Representative time trajectory showing the Cy3, Cy5 and FRET signals resulting from each of the three states depicted in A. The region marked ii shows the ATP-dependent displacement of Cy5-SSB from the ssDNA end by Pif1 translocation indicated by a stable, high FRET signal that is replaced by repetitive Cy3 enhancement with no Cy5 emission. (C) Representative time trajectory showing (iii) repetitive Pif1 translocation along 3′-dT-Cy3-(dT)70 DNA, followed by (i) binding of Cy5-SSB to the DNA and (ii) subsequent displacement of Cy5-SSB from the DNA by another Pif1. Green, Cy3 fluorescence; red, Cy5 fluorescence; blue, FRET efficiency. Solution conditions as in Fig. 1.
We also examined whether the 3′ to 5′ SF1A ssDNA translocases, E. coli Rep and E. coli UvrD can push SSB along ssDNA. As a monomer, Rep is a 3′ to 5′ processive ssDNA translocase with an average translocation rate of 280 ± 50 nt/s on a poly(dT) track at saturating [ATP] (25). A UvrD monomer is a slower 3′ to 5′ ssDNA translocase with a rate of 190 ± 5 nt/s on a poly(dT) track at saturating [ATP] (21, 22, 24). When added to a 5′-Cy3–labeled (dT)140 bound with Cy5-SSB, both of these enzymes show the characteristic FRET spikes, indicating that they can also push SSB, but in the opposite 3′ to 5′ direction (Figs. S7 and S8). Hence, ssDNA translocases from two different organisms with opposite directionalities and different rates display chemo-mechanical pushing of SSB along ssDNA.
Fig. S7.
Representative smTIRF time trajectories for SSB pushing by Rep. (A) 5′-Cy3-dT140 DNA immobilized on the slide surface via a biotin-Neutravidin-biotin linkage displays only Cy3 fluorescence similar to the 3′-Cy3 DNA substrate. (B) Introduction of 100 nM Rep and 5 mM ATP results in repetitive Cy3 PIFE fluctuations. (C) Introduction of 100 nM Rep with 5 mM ATP to a surface with Cy5-SSB bound to 5′-Cy3-dT140 DNA results in the loss of fluctuating FRET signals reflecting random SSB diffusion with only fluctuating Cy3 PIFE signals reflecting Rep translocation. Asymmetric saw-toothed anticorrelated FRET spikes are observed in 22% of molecules still displaying Cy5 emission. Green, Cy3 fluorescence; red, Cy5 fluorescence; blue, FRET efficiency calculated from the Cy3 and Cy5 signals. Solution conditions: 30 mM Tris⋅HCl, pH 8.1, 20 mM NaCl, 5 mM MgCl2, 1 mM DTT, 0.1 mg/mL BSA, 0.5% (wt/vol) dextrose, 3 mM Trolox, 1 mg/mL glucose oxidase, and 0.4 mg/mL catalase, 25 °C.
Fig. S8.
UvrD induced pushing of Cy5-SSB on 5′dT-Cy3-(dT)140. (A) Representative smTIRF time trajectory for 5′-Cy3-dT140 immobilized on the slide surface shows only Cy3 fluorescence (green). (B) Addition of 2.5 nM Cy5-labeled SSB, incubated for 5 min, followed by washing out of free protein results in the appearance of fluctuating Cy5 fluorescence (red) reflecting bound and diffusing SSB. (C) Addition of 100 nM UvrD with 1 mM ATP results in the appearance of saw-tooth-shaped FRET spikes (blue). Solution conditions: 10 mM Tris, pH 8.1,10% glycerol, 100 mM NaCl, and 5 mM MgCl2, 25 °C.
Quantitative Analysis of Pushing Events.
We quantified the translocase-induced SSB pushing events by measuring the time for the asymmetric FRET signal to increase from baseline to its peak value (Fig. 2A). These times-to-peak were measured for Pif1 at several ATP concentrations, as well as for Rep and UvrD to evaluate the role of translocation rate on the kinetics of SSB pushing. Ensemble studies have shown that Pif1 translocates on poly(dT) with an average rate of ∼81 ± 8 nt/s at 5 mM ATP, but decreases to ∼15 nt/s at 50 μM ATP under similar buffer conditions used in our assay (50 mM Tris⋅HCl, pH 8.3, 100 mM NaCl, 5 mM MgCl2) (28). At 5 mM ATP, the mean time-to-peak was 0.4 ± 0.3 s with a median value of 0.272 s (n = 112 events; Fig. 2B), increasing slightly at 500 μM ATP to a mean time-to-peak of 0.4 ± 0.2 s with a median of 0.352 s (n = 85), and increasing significantly at 50 μM ATP where the mean time-to-peak was 0.7 ± 0.6 s, with a median value of 0.512 s (N = 136 events; Fig. 2C). This increase in median time-to-peak at lower ATP concentration indicates that the rate of SSB pushing is dependent on the rate of Pif1 translocation along ssDNA. The time-to-peak values did not depend on [NaCl] (Fig. S5B). SSB pushing by Rep (Fig. 2D) and UvrD (Fig. 2E) at 5 mM ATP both show shorter times-to-peak than Pif1 at 5 mM ATP, consistent with their faster translocation rates [280 ± 50 for Rep (25) and 190 ± 5 for UvrD (23, 52)], a further indication that the rate of pushing is dependent on the rate of translocation of the motor.
Mechanism for Translocase-Induced Pushing of SSB.
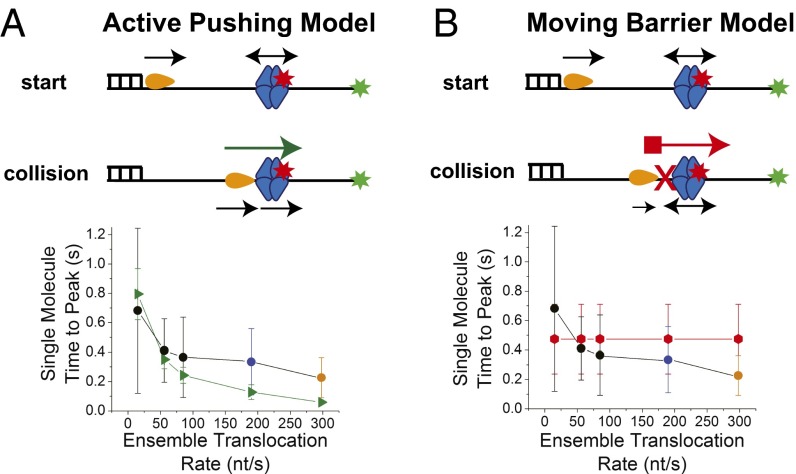
Because ssDNA translocation by these motors is tightly coupled to ATP hydrolysis (1 ATP/nt translocated even at low [ATP]) (23, 52), these motors operate as “power stroke” motors rather than as Brownian ratchets (53). However, this does not necessarily mean that these motors push SSB using a power stroke mechanism. We considered two limiting mechanisms for how a translocating motor could push an SSB protein directionally along ssDNA (Fig. 4). The first case, the active pushing (power stroke) model, considers that, on collision, the translocating motor directly exerts a chemo-mechanical force and pushes the SSB along ssDNA as one unit at the same rate as on ssDNA alone (Fig. 4A). The second case, the moving barrier to diffusion (Brownian ratchet) model, assumes that the translocase is unable to push the SSB but serves as a barrier to SSB diffusion (Fig. 4B). In this model, collision of the translocase with SSB prevents motor translocation. The motor can only resume translocation if the SSB diffuses away from the motor (in the 5′ to 3′ direction in the case of Pif1). As SSB diffuses, Pif1 then follows, gradually decreasing the length of ssDNA accessible for SSB diffusion. Eventually the Cy5-SSB will end up at the 3′-Cy3 end of the DNA. To compare these two models, we performed Monte Carlo simulations of pushing trajectories as a function of the translocation rate of the motor as described in SI Text and Fig. S9, and the results are shown in Fig. 4 A and B. The simulated times-to-peak for the moving barrier to diffusion model are independent of ATP concentration (Fig. 4B) due to the fact that the average stepping rate of SSB diffusion [0.0592 s/step on average with D1 = 76 nt2/s at 25 °C and a 3-nt step size (2)] is always slower than the motor translocation rate in the range studied, and thus diffusion will limit the apparent rate of SSB pushing. However, for the active pushing model, the simulated times-to-peak show a clear increase with decreasing motor translocation rate (decreasing ATP concentration) in agreement with our experimental observations (Fig. 4A). Thus, our experiments and simulations support a mechanism in which the translocase can use its chemo-mechanical motor to actively push SSB along ssDNA.
Fig. 4.
Translocases actively push SSB along ssDNA. (A) Active pushing model: The translocase initiates at the ds/ss DNA junction, whereas the SSB can bind randomly between the translocase and the DNA end-labeled with the Cy3 donor. On collision, the translocase can push the SSB along the ssDNA. Comparison of time-to-peak values as a function of translocation rate obtained from active pushing simulations (green triangles) with experimental single molecule median time-to-peak values: black circles, Pif1 pushing SSB at 5 mM, 500 μM, and 50 μM ATP; blue circle, UvrD pushing SSB at 5 mM ATP; orange circle, Rep pushing SSB at saturating 5 mM ATP. (B) Moving barrier model: On collision, the translocase cannot push the SSB, but presents a continuously advancing barrier only allowing SSB diffusion toward the Cy3 DNA end. Comparison of time-to-peak values as a function of translocation rate obtained from moving barrier simulations (red octagons) with experimental single molecule median time-to-peak values: black circles, Pif1 pushing SSB at 5 mM, 500 μM, and 50 μM ATP; blue circle, UvrD pushing SSB at 5 mM ATP; orange circle, Rep pushing SSB at saturating 5 mM ATP.
Fig. S9.
Results of a simulation of Pif1 pushing SSB along ssDNA via active pushing. (A) Simulated protein positions on the ssDNA lattice during a single simulation. Black squares represent the center of mass position for EcSSB and the bars represent the position of the 5′ and 3′ edges of the bound protein. Red circles represent the center of mass position for ScPif1 and the bars represent the 5′ and 3′ edges of the translocase. In the simulation, the Pif1 translocase motor starts at the extreme 5′ end of the DNA lattice and advances in the 3′ direction, whereas the SSB undergoes a random walk along the DNA. A collision occurs when the 3′ edge of the Pif1 overlaps with the 5′ edge of the SSB. After the collision, the Pif1 and SSB move as a single unit toward the 3′ end of the DNA. The active displacement of SSB from the DNA end is represented as the SSB position going to 0. (B) The corresponding FRET efficiency predicted for the simulation in A determined from the distance between the 3′ edge of the SSB and the 3′ end of the DNA. The 3D distance was estimated by modeling the ssDNA between the SSB edge and the 3′ end as a modified worm-like chain and the FRET efficiency was calculated using a Fӧrster distance of 56 Å.
Discussion
SF1 helicases/translocases can displace proteins from ssDNA (20, 32–36, 38, 40, 54) and this ability is thought to be important in overcoming barriers to replication (40). We show here that translocases are also able to push a heterologous ssDNA binding protein along ssDNA. Three different SF1 translocases, ScPif1, EcRep, and EcUvrD, can push a tightly bound EcSSB tetramer along ssDNA [poly(dT)] with the directionality and rate of pushing determined by the translocase. Moreover, each pushing event, monitored by a FRET increase as the Cy5-SSB is pushed toward the Cy3-labeled end of ssDNA, is always followed by a sudden loss of FRET signal, suggesting that the translocase can force the SSB off the ssDNA end. This interpretation is supported by simulations that predict the same asymmetric FRET spikes (Fig. S9B). The random nature and large time period between FRET spikes suggest that the displaced SSB proteins have difficulty rebinding to the ssDNA in the presence of repetitive translocase movement. When an SSB protein is occasionally able to rebind the ssDNA, it is rapidly pushed off the ssDNA end.
The translocase-induced pushing of SSB can be quantified by measuring the time it takes for the rising FRET spike to reach its maximum. At saturating [ATP], the three translocases in our studies display different ensemble translocation rates: EcRep (280 ± 50 nt/s) (25), EcUvrD (190 ± 5 nt/s) (21, 23, 52), and ScPif1 (81 ± 8 nt/s) (28). The time-to-peak values of the single molecule FRET spikes are inversely correlated with these translocation rates indicating that the rate of SSB pushing is controlled by the rate of motor translocation. This conclusion is further supported by comparing at two [ATP] the relative rates of Pif1 pushing of SSB to the relative rates of Pif1 translocation in the absence of SSB. The ratio of the median time-to-peak for Pif1 pushing of SSB at 50 μM and 5 mM ATP (0.512 s/0.272 s) is 1.88, whereas the ratio of the median PIFE peak intervals reflecting repetitive Pif1 translocation in the absence of SSB at the same ATP concentrations is 1.61 (1.440 s/0.892 s). This comparison also indicates that SSB pushing is dominated by motor protein translocation rate rather than SSB protein diffusion. We considered two models for how a translocase might move an SSB protein directionally along ssDNA, active pushing by the translocase or a moving barrier to SSB diffusion. Our simulations show that only the active pushing model predicts the dependence of SSB pushing rate on [ATP] that we observe experimentally. Although we cannot unambiguously determine the number of SF1 translocases required to push an SSB, our results suggest that a single monomeric translocase is sufficient to push an SSB tetramer. We cannot assess from our data whether the motor translocation rate is slowed by SSB pushing. However, the general agreement between the experiments and the simulations, that assume no change in motor translocation rate, suggests no major reduction in rate (less than a factor of 2) when the translocase is pushing the SSB load.
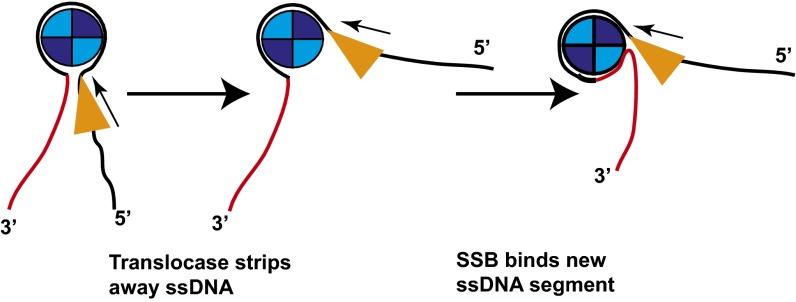
Our finding that SF1 translocases can actively push EcSSB along ssDNA is somewhat surprising. Under the solution conditions of our experiments, a single EcSSB tetramer binds to (dT)140 in its (SSB)65 mode in which the ssDNA interacts with all four SSB subunits (55, 56) with a wrapping topology resembling that of the seams on a baseball (8, 57). The affinity of EcSSB for poly(dT) in this mode is less than picomolar under our solution conditions, with a half-life greater than 20 min. However, all three SF1 ssDNA translocases are able to push EcSSB at rates that are not distinguishably different from their translocation rates on isolated ssDNA. One possibility for how this might be accomplished is outlined in Fig. 5 for a 5′ to 3′ translocase such as Pif1. When the translocase encounters the SSB tetramer, it may partially peel the 5′-sided ssDNA away from a region of the tetramer as it continues to translocate. The now unoccupied DNA binding site of the tetramer could then be rapidly occupied by the 3′-sided ssDNA. By this mechanism, only a subset of the ssDNA-SSB contacts are broken at any time and the SSB is “rolled” along the ssDNA. An isolated SSB tetramer will not bind stably in its (SSB)35 binding mode on ssDNA of lengths ≥70 nucleotides or in the presence of 5 mM Mg2+, as we use in this study (48, 58); hence, we are unable to examine whether SSB can be pushed when bound in this mode.
Fig. 5.
Rolling model for motor-induced pushing of SSB. The translocating motor (triangle) collides with the SSB (blue circle) (in this case from the 5′ side) and strips a portion of the ssDNA from the SSB creating an unoccupied ssDNA binding site. The newly available ssDNA binding site is then bound by ssDNA from the 3′ side, replacing the ssDNA displaced by the translocase. This results in a net directional movement of the SSB toward the 3′ end of the ssDNA by a rolling mechanism.
Our experiments and simulations indicate that the chemo-mechanical pushing of SSB is only dependent on the rate and directionality of the translocase motor with no need for a specific interaction between the translocase and SSB protein. Hence, such pushing events could occur whenever any ssDNA translocase encounters an SSB protein. Translocase-induced directed motion of SSB proteins offers an additional mechanism by which SSB proteins could be reorganized along ssDNA during replication, repair, and recombination. Our results also indicate that SF1 translocases can continue to translocate even after colliding with a tightly bound SSB protein. It has previously been shown that RecBCD helicase can push DNA binding proteins along dsDNA (47). One difference is that as RecBCD translocates, it also unwinds the dsDNA, thus eliminating the dsDNA binding site for the protein. Another difference is that the model proposed for RecBCD-induced pushing suggested transient dissociation of the protein during pushing (47), whereas in the SSB–ssDNA case the tightly bound SSB maintains contact with the ssDNA throughout the pushing process.
What may be the functional consequences of translocase-induced SSB reorganization? SSB pushing may play a role in replication–transcription conflicts (59) as the two machineries collide either head-on on the lagging strand or codirectionally on the leading strand. The consequences of a joint translocase–SSB entity moving along ssDNA could also be functional. It is well established that monomeric SF1 helicases, such as Rep, UvrD, and Pif1, are rapid translocases, but very poor helicases on their own that must be activated either by self-assembly or through interactions with an accessory protein (60–62). However, SSB proteins can use their ability to diffuse along ssDNA to transiently destabilize short duplex hairpins (2, 11). Our results suggest that a translocase pushing an SSB could apply a directed force on an SSB at a ss/dsDNA junction to promote helicase activity beyond the ∼8-bp limit previously observed for a diffusing SSB (2, 11). The chemo-mechanical pushing of SSBs by SF1 translocases adds to the growing list of functions for this class of motor proteins, including the recent demonstration that UvrD is able to use its motor activity to cause backtracking of an RNA polymerase elongation complex stalled at a DNA lesion (63).
Materials and Methods
Oligodeoxynucleotide Synthesis.
All oligodeoxynucleotides were synthesized on a MerMade 4 synthesizer (Bioautomation) using phosphoramidate reagents from Glen Research and purified as described (11). Sequences used in this study are shown in Table S1. DNA concentrations were determined as described (11). DNA duplexes were annealed in a buffer containing 10 mM Tris⋅HCl, pH 8.1, 50 mM sodium chloride, and 0.1 mM disodium EDTA.
Table S1.
Sequences of oligodeoxynucleotides used in smTIRF
| Strand | Sequence |
| 3′ Biotinylated handle strand | 5′ d(GCC TCG CTG CCG TCG CCA)–biotin 3′ |
| 3′ (dT)140 strand | 5′ d(TGG CGA CGG CAG CGA GGC)–(dT)140–Cy3–dT3′ |
| 3′ (dT)70 strand | 5′ d(TGG CGA CGG CAG CGA GGC)–(dT)70–Cy3–dT3′ |
| 5′ Biotinylated handle strand | 5′Biotin–d(TGG CGA CGG CAG CGA GGC) 3′ |
| 5′ (dT)140 strand | 5′ dT–Cy3–(dT)140–d(GCC TCG CTG CCG TCG CCA) 3′ |
Protein Purification.
E. coli SSB A122C was purified as described (2, 14). Labeling with Cy5 maleimide was performed using underlabeling conditions (6). EcSSB concentrations were determined spectrophotometrically (2, 14). The ratio of Cy5 dye to SSB tetramer was 1.1. ScPif1 was purified and concentrations determined as described (64). EcRep and EcUvrD were purified as described (25, 62, 65).
smTIRF Microscopy.
An objective-type TIRF microscope (IX71 inverted microscope, model IX2_MPITIRTL; Olympus) with an oil immersion objective (60×/1.45 NA PlanApo N; Olympus) was used for the smTIRF experiments as described (11, 66). The sample slide was illuminated with a 532-nm laser (CrystaLaser) fiber-optically coupled to the TIR microscope. The temperature of the slide was maintained at 25 °C using both a temperature-controlled stage (BC-110 Bionomic controller; 20/20 Technology) and an objective heater (Bioptechs). The TIRF signal was observed using an Andor iXon EMCCD camera (Model DU897E). Data were collected using SINGLE, a custom program provided by the laboratory of Taekjip Ha (Johns Hopkins University). Raw data files were processed with IDL (Exelis VIS) and individual intensity vs. time trajectories were analyzed with MATLAB (Mathworks) as described (11). Details on the simulations of translocase/SSB collisions resulting in SSB pushing can be found in SI Text.
All smTIRF experiments with ScPif1 were conducted in 30 mM Tris buffer (pH 8.1), 100 mM sodium chloride (total concentration of NaCl from all components, including protein dilution buffers and oxygen scavenger solutions, ranged from 110 to 120 mM depending of disodium ATP concentration), 5 mM magnesium chloride, 0.1 mM disodium EDTA, 1 mM DTT, 0.5% (wt/vol) dextrose, 0.1 mg/mL BSA, and 3 mM 6-hydroxy-2,5,7,8-tetramethylchroman-2-carboxylic acid (Trolox). The smTIRF experiments with EcRep were conducted in the buffer above but with the presence of 10% (vol/vol) glycerol and the absence of added sodium chloride (total concentration of NaCl from all components ranged from 10 to 20 mM depending on disodium ATP concentration). EcUvrD smTIRF experiments were done in the same buffer as the ScPif1 experiments but with the addition of 10% (vol/vol) glycerol. Immediately before all TIRF measurements, glucose oxidase (1 mg/mL final concentration) and catalase (0.4 mg/mL final concentration) were added to the samples to serve as an oxygen scavenging system.
SI Text
Simulations of Time Courses of Translocase-induced Pushing of SSB.
The pushing of SSB along ssDNA by an ssDNA translocase motor was modeled using a custom MATLAB program in which an EcSSB tetramer with a 66-nt occluded site size was bound randomly to a 140-nt homogeneous ssDNA lattice. In the case of Pif1, a 5′ to 3′ translocating motor, the motor was assumed to start at the 5′ end of this 140-nt lattice in every simulation. The translocating motor, with an 8-nt site size, was considered as a moving 5′ barrier. At the start of each simulation, SSB diffusion along the ssDNA lattice was modeled as a random walk with a diffusion coefficient of D1D = 76 nt2/s and a step size of 3 nt (2, 14). The SSB was allowed to occupy any position on the lattice between the 5′ and 3′ barriers. These barriers were reflective: if the next random step would take the SSB beyond any of the barriers, the SSB would instead have to take a step in the opposite direction. The 5′ barrier representing the translocase had its position advance in the 3′ direction with every SSB step a distance equal to the input translocation rate multiplied by the time between SSB steps. The length of the simulation varied with the translocation rate of the motor: the time of each simulation was limited to the time it would take the motor to traverse the DNA lattice. Two scenarios were considered for the result of a collision between the 5′ edge of the diffusing SSB and the 3′ edge of the advancing translocase. In the “active pushing” model (Fig. 4A and Fig. S8), on a collision between the motor and SSB, the two proteins were treated as one unit and assumed to move together toward the 3′ end at the same translocation rate of the model translocase alone. These simulations did not specify a mechanism for pushing. The same results would be obtained from either a perfectly inelastic collision between solid bodies with zero friction or a load from the pushed SSB or from the continuous stripping model depicted in Fig. 5. In the moving barrier model (Fig. 5B), the translocase was not allowed to move once it collided with the SSB; rather, it acted as a barrier preventing the SSB from diffusing toward the 5′ end. The translocase was only allowed to move once the SSB took a random step in the 3′ direction. These simulations assumed no backsliding or dissociation by the translocase during the repeated collisions between it and the SSB.
To convert the SSB position on the DNA to a FRET efficiency, the Cy5 acceptor was assumed to be located at the 3′ edge of the SSB and the through-space distance between it and the Cy3 donor at the 3′ end of the ssDNA was estimated by modeling the ssDNA using a modified worm-like chain to calculate the end to end distance of the ssDNA (67, 68). Thus, the nucleotide position distance was converted to a 3D distance, which in turn was converted into a FRET efficiency by the equation
| [S1] |
This simple model only takes into account the simulated distances between the SSB and the Cy3 end of the DNA and does not include any distance dependent effects on Cy3 due to changing proximity of SSB or Pif1. Nevertheless, the simulated results parallel the experimental results well and are sufficient to draw our qualitative conclusions. To mimic the analysis of the smTIRF data, the simulated time-to-peak was determined as the time from when the FRET event rose above Esim = 0.3 to when it reached Esim = 0.9, values chosen based on the average values seen in the experimental data. Because the initial binding site of the SSB is random along the (dT)140, in some simulations the SSB remained near the 3′ half of the ssDNA for the entire duration of the simulation and hence the FRET efficiency never dropped below 0.5. These collision events did not display the asymmetric peak shape observed in the single molecule time trajectories and thus no time-to-peak could be calculated for these particular simulations (39% of the simulations for a particular set of conditions on average fell into this category). For simulations with a translocase with a fast translocation rate such as EcRep (298 ± 50 nt/s), the time for the motor to push the SSB from Esim = 0.3–0.9 was faster than the time it takes on average for an SSB to take a single step, further supporting our active pushing interpretation of the experimental results.
Acknowledgments
We thank Thang Ho for synthesis and purification of the oligodeoxynucleotides. This work was supported by National Institutes of Health Grants GM030498 and GM045948 (to T.M.L.) and GM098509 (to R.G.) and American Cancer Society Grant PF-15-040-01-DMC (to J.E.S.).
Footnotes
The authors declare no conflict of interest.
This article is a PNAS Direct Submission.
This article contains supporting information online at www.pnas.org/lookup/suppl/doi:10.1073/pnas.1602878113/-/DCSupplemental.
References
- 1.Shereda RD, Kozlov AG, Lohman TM, Cox MM, Keck JL. SSB as an organizer/mobilizer of genome maintenance complexes. Crit Rev Biochem Mol Biol. 2008;43(5):289–318. doi: 10.1080/10409230802341296. [DOI] [PMC free article] [PubMed] [Google Scholar]
- 2.Roy R, Kozlov AG, Lohman TM, Ha T. SSB protein diffusion on single-stranded DNA stimulates RecA filament formation. Nature. 2009;461(7267):1092–1097. doi: 10.1038/nature08442. [DOI] [PMC free article] [PubMed] [Google Scholar]
- 3.Hobbs MD, Sakai A, Cox MM. SSB protein limits RecOR binding onto single-stranded DNA. J Biol Chem. 2007;282(15):11058–11067. doi: 10.1074/jbc.M611007200. [DOI] [PubMed] [Google Scholar]
- 4.Shereda RD, Bernstein DA, Keck JL. A central role for SSB in Escherichia coli RecQ DNA helicase function. J Biol Chem. 2007;282(26):19247–19258. doi: 10.1074/jbc.M608011200. [DOI] [PubMed] [Google Scholar]
- 5.Kozlov AG, Jezewska MJ, Bujalowski W, Lohman TM. Binding specificity of Escherichia coli single-stranded DNA binding protein for the chi subunit of DNA pol III holoenzyme and PriA helicase. Biochemistry. 2010;49(17):3555–3566. doi: 10.1021/bi100069s. [DOI] [PMC free article] [PubMed] [Google Scholar]
- 6.Bhattacharyya B, et al. Structural mechanisms of PriA-mediated DNA replication restart. Proc Natl Acad Sci USA. 2014;111(4):1373–1378. doi: 10.1073/pnas.1318001111. [DOI] [PMC free article] [PubMed] [Google Scholar]
- 7.Shereda RD, Reiter NJ, Butcher SE, Keck JL. Identification of the SSB binding site on E. coli RecQ reveals a conserved surface for binding SSB’s C terminus. J Mol Biol. 2009;386(3):612–625. doi: 10.1016/j.jmb.2008.12.065. [DOI] [PMC free article] [PubMed] [Google Scholar]
- 8.Raghunathan S, Kozlov AG, Lohman TM, Waksman G. Structure of the DNA binding domain of E. coli SSB bound to ssDNA. Nat Struct Biol. 2000;7(8):648–652. doi: 10.1038/77943. [DOI] [PubMed] [Google Scholar]
- 9.Raghunathan S, Ricard CS, Lohman TM, Waksman G. Crystal structure of the homo-tetrameric DNA binding domain of Escherichia coli single-stranded DNA-binding protein determined by multiwavelength x-ray diffraction on the selenomethionyl protein at 2.9-A resolution. Proc Natl Acad Sci USA. 1997;94(13):6652–6657. doi: 10.1073/pnas.94.13.6652. [DOI] [PMC free article] [PubMed] [Google Scholar]
- 10.Lohman TM, Ferrari ME. Escherichia coli single-stranded DNA-binding protein: Multiple DNA-binding modes and cooperativities. Annu Rev Biochem. 1994;63:527–570. doi: 10.1146/annurev.bi.63.070194.002523. [DOI] [PubMed] [Google Scholar]
- 11.Nguyen B, et al. Diffusion of human replication protein A along single-stranded DNA. J Mol Biol. 2014;426(19):3246–3261. doi: 10.1016/j.jmb.2014.07.014. [DOI] [PMC free article] [PubMed] [Google Scholar]
- 12.Kozlov AG, Lohman TM. Stopped-flow studies of the kinetics of single-stranded DNA binding and wrapping around the Escherichia coli SSB tetramer. Biochemistry. 2002;41(19):6032–6044. doi: 10.1021/bi020122z. [DOI] [PubMed] [Google Scholar]
- 13.Kozlov AG, Lohman TM. Kinetic mechanism of direct transfer of Escherichia coli SSB tetramers between single-stranded DNA molecules. Biochemistry. 2002;41(39):11611–11627. doi: 10.1021/bi020361m. [DOI] [PubMed] [Google Scholar]
- 14.Zhou R, et al. SSB functions as a sliding platform that migrates on DNA via reptation. Cell. 2011;146(2):222–232. doi: 10.1016/j.cell.2011.06.036. [DOI] [PMC free article] [PubMed] [Google Scholar]
- 15.Schneider RJ, Wetmur JG. Kinetics of transfer of E. coli single strand deoxyribonucleic acid binding protein between single-stranded DNA molecules. Biochemistry. 1982;21:608–615. doi: 10.1021/bi00533a002. [DOI] [PubMed] [Google Scholar]
- 16.Lee KS, et al. Ultrafast redistribution of E. coli SSB along long single-stranded DNA via intersegment transfer. J Mol Biol. 2014;426(13):2413–2421. doi: 10.1016/j.jmb.2014.04.023. [DOI] [PMC free article] [PubMed] [Google Scholar]
- 17.Lohman TM, Tomko EJ, Wu CG. Non-hexameric DNA helicases and translocases: Mechanisms and regulation. Nat Rev Mol Cell Biol. 2008;9(5):391–401. doi: 10.1038/nrm2394. [DOI] [PubMed] [Google Scholar]
- 18.Dillingham MS, Wigley DB, Webb MR. Demonstration of unidirectional single-stranded DNA translocation by PcrA helicase: Measurement of step size and translocation speed. Biochemistry. 2000;39(1):205–212. doi: 10.1021/bi992105o. [DOI] [PubMed] [Google Scholar]
- 19.Niedziela-Majka A, Chesnik MA, Tomko EJ, Lohman TM. Bacillus stearothermophilus PcrA monomer is a single-stranded DNA translocase but not a processive helicase in vitro. J Biol Chem. 2007;282(37):27076–27085. doi: 10.1074/jbc.M704399200. [DOI] [PubMed] [Google Scholar]
- 20.Park J, et al. PcrA helicase dismantles RecA filaments by reeling in DNA in uniform steps. Cell. 2010;142(4):544–555. doi: 10.1016/j.cell.2010.07.016. [DOI] [PMC free article] [PubMed] [Google Scholar]
- 21.Fischer CJ, Maluf NK, Lohman TM. Mechanism of ATP-dependent translocation of E.coli UvrD monomers along single-stranded DNA. J Mol Biol. 2004;344(5):1287–1309. doi: 10.1016/j.jmb.2004.10.005. [DOI] [PubMed] [Google Scholar]
- 22.Tomko EJ, et al. 5′-Single-stranded/duplex DNA junctions are loading sites for E. coli UvrD translocase. EMBO J. 2010;29(22):3826–3839. doi: 10.1038/emboj.2010.242. [DOI] [PMC free article] [PubMed] [Google Scholar]
- 23.Tomko EJ, Fischer CJ, Niedziela-Majka A, Lohman TM. A nonuniform stepping mechanism for E. coli UvrD monomer translocation along single-stranded DNA. Mol Cell. 2007;26(3):335–347. doi: 10.1016/j.molcel.2007.03.024. [DOI] [PMC free article] [PubMed] [Google Scholar]
- 24.Lee KS, Balci H, Jia H, Lohman TM, Ha T. Direct imaging of single UvrD helicase dynamics on long single-stranded DNA. Nat Commun. 2013;4:1878. doi: 10.1038/ncomms2882. [DOI] [PMC free article] [PubMed] [Google Scholar]
- 25.Brendza KM, et al. Autoinhibition of Escherichia coli Rep monomer helicase activity by its 2B subdomain. Proc Natl Acad Sci USA. 2005;102(29):10076–10081. doi: 10.1073/pnas.0502886102. [DOI] [PMC free article] [PubMed] [Google Scholar]
- 26.Myong S, Rasnik I, Joo C, Lohman TM, Ha T. Repetitive shuttling of a motor protein on DNA. Nature. 2005;437(7063):1321–1325. doi: 10.1038/nature04049. [DOI] [PubMed] [Google Scholar]
- 27.Antony E, et al. Srs2 disassembles Rad51 filaments by a protein-protein interaction triggering ATP turnover and dissociation of Rad51 from DNA. Mol Cell. 2009;35(1):105–115. doi: 10.1016/j.molcel.2009.05.026. [DOI] [PMC free article] [PubMed] [Google Scholar]
- 28.Galletto R, Tomko EJ. Translocation of Saccharomyces cerevisiae Pif1 helicase monomers on single-stranded DNA. Nucleic Acids Res. 2013;41(8):4613–4627. doi: 10.1093/nar/gkt117. [DOI] [PMC free article] [PubMed] [Google Scholar]
- 29.Singleton MR, Dillingham MS, Wigley DB. Structure and mechanism of helicases and nucleic acid translocases. Annu Rev Biochem. 2007;76:23–50. doi: 10.1146/annurev.biochem.76.052305.115300. [DOI] [PubMed] [Google Scholar]
- 30.Bochman ML, Sabouri N, Zakian VA. Unwinding the functions of the Pif1 family helicases. DNA Repair (Amst) 2010;9(3):237–249. doi: 10.1016/j.dnarep.2010.01.008. [DOI] [PMC free article] [PubMed] [Google Scholar]
- 31.Mackintosh SG, Raney KD. DNA unwinding and protein displacement by superfamily 1 and superfamily 2 helicases. Nucleic Acids Res. 2006;34(15):4154–4159. doi: 10.1093/nar/gkl501. [DOI] [PMC free article] [PubMed] [Google Scholar]
- 32.Petrova V, et al. Active displacement of RecA filaments by UvrD translocase activity. Nucleic Acids Res. 2015;43(8):4133–4149. doi: 10.1093/nar/gkv186. [DOI] [PMC free article] [PubMed] [Google Scholar]
- 33.Byrd AK, Raney KD. Displacement of a DNA binding protein by Dda helicase. Nucleic Acids Res. 2006;34(10):3020–3029. doi: 10.1093/nar/gkl369. [DOI] [PMC free article] [PubMed] [Google Scholar]
- 34.Veaute X, et al. UvrD helicase, unlike Rep helicase, dismantles RecA nucleoprotein filaments in Escherichia coli. EMBO J. 2005;24(1):180–189. doi: 10.1038/sj.emboj.7600485. [DOI] [PMC free article] [PubMed] [Google Scholar]
- 35.Anand SP, Zheng H, Bianco PR, Leuba SH, Khan SA. DNA helicase activity of PcrA is not required for the displacement of RecA protein from DNA or inhibition of RecA-mediated strand exchange. J Bacteriol. 2007;189(12):4502–4509. doi: 10.1128/JB.00376-07. [DOI] [PMC free article] [PubMed] [Google Scholar]
- 36.Fagerburg MV, et al. PcrA-mediated disruption of RecA nucleoprotein filaments--essential role of the ATPase activity of RecA. Nucleic Acids Res. 2012;40(17):8416–8424. doi: 10.1093/nar/gks641. [DOI] [PMC free article] [PubMed] [Google Scholar]
- 37.Veaute X, et al. The Srs2 helicase prevents recombination by disrupting Rad51 nucleoprotein filaments. Nature. 2003;423(6937):309–312. doi: 10.1038/nature01585. [DOI] [PubMed] [Google Scholar]
- 38.Qiu Y, et al. Srs2 prevents Rad51 filament formation by repetitive motion on DNA. Nat Commun. 2013;4:2281. doi: 10.1038/ncomms3281. [DOI] [PMC free article] [PubMed] [Google Scholar]
- 39.Yancey-Wrona JE, Matson SW. Bound Lac repressor protein differentially inhibits the unwinding reactions catalyzed by DNA helicases. Nucleic Acids Res. 1992;20(24):6713–6721. doi: 10.1093/nar/20.24.6713. [DOI] [PMC free article] [PubMed] [Google Scholar]
- 40.Brüning JG, Howard JL, McGlynn P. Accessory replicative helicases and the replication of protein-bound DNA. J Mol Biol. 2014;426(24):3917–3928. doi: 10.1016/j.jmb.2014.10.001. [DOI] [PubMed] [Google Scholar]
- 41.Zhou R, Zhang J, Bochman ML, Zakian VA, Ha T. Periodic DNA patrolling underlies diverse functions of Pif1 on R-loops and G-rich DNA. eLife. 2014;3:e02190. doi: 10.7554/eLife.02190. [DOI] [PMC free article] [PubMed] [Google Scholar]
- 42.Li JR, et al. Pif1 regulates telomere length by preferentially removing telomerase from long telomere ends. Nucleic Acids Res. 2014;42(13):8527–8536. doi: 10.1093/nar/gku541. [DOI] [PMC free article] [PubMed] [Google Scholar]
- 43.Phillips JA, Chan A, Paeschke K, Zakian VA. The pif1 helicase, a negative regulator of telomerase, acts preferentially at long telomeres. PLoS Genet. 2015;11(4):e1005186. doi: 10.1371/journal.pgen.1005186. [DOI] [PMC free article] [PubMed] [Google Scholar]
- 44.Singh SP, Koc KN, Stodola JL, Galletto R. A monomer of Pif1 unwinds double-stranded DNA and it is regulated by the nature of the non-translocating strand at the 3′-end. J Mol Biol. 2016;428(6):1053–1067. doi: 10.1016/j.jmb.2016.02.017. [DOI] [PMC free article] [PubMed] [Google Scholar]
- 45.Eggleston AK, O’Neill TE, Bradbury EM, Kowalczykowski SC. Unwinding of nucleosomal DNA by a DNA helicase. J Biol Chem. 1995;270(5):2024–2031. doi: 10.1074/jbc.270.5.2024. [DOI] [PubMed] [Google Scholar]
- 46.Finkelstein IJ, Greene EC. Molecular traffic jams on DNA. Annu Rev Biophys. 2013;42:241–263. doi: 10.1146/annurev-biophys-083012-130304. [DOI] [PMC free article] [PubMed] [Google Scholar]
- 47.Finkelstein IJ, Visnapuu ML, Greene EC. Single-molecule imaging reveals mechanisms of protein disruption by a DNA translocase. Nature. 2010;468(7326):983–987. doi: 10.1038/nature09561. [DOI] [PMC free article] [PubMed] [Google Scholar]
- 48.Bujalowski W, Lohman TM. Escherichia coli single-strand binding protein forms multiple, distinct complexes with single-stranded DNA. Biochemistry. 1986;25(24):7799–7802. doi: 10.1021/bi00372a003. [DOI] [PubMed] [Google Scholar]
- 49.Fischer CJ, Lohman TM. ATP-dependent translocation of proteins along single-stranded DNA: Models and methods of analysis of pre-steady state kinetics. J Mol Biol. 2004;344(5):1265–1286. doi: 10.1016/j.jmb.2004.10.004. [DOI] [PubMed] [Google Scholar]
- 50.Hwang H, Myong S. Protein induced fluorescence enhancement (PIFE) for probing protein-nucleic acid interactions. Chem Soc Rev. 2014;43(4):1221–1229. doi: 10.1039/c3cs60201j. [DOI] [PMC free article] [PubMed] [Google Scholar]
- 51.Stennett EM, Ciuba MA, Levitus M. Photophysical processes in single molecule organic fluorescent probes. Chem Soc Rev. 2014;43(4):1057–1075. doi: 10.1039/c3cs60211g. [DOI] [PubMed] [Google Scholar]
- 52.Tomko EJ, Fischer CJ, Lohman TM. Single-stranded DNA translocation of E. coli UvrD monomer is tightly coupled to ATP hydrolysis. J Mol Biol. 2012;418(1-2):32–46. doi: 10.1016/j.jmb.2012.02.013. [DOI] [PMC free article] [PubMed] [Google Scholar]
- 53.Wang H, Oster G. Ratchets, power strokes, and molecular motors. Appl Phys, A Mater Sci Process. 2002;75:315–323. [Google Scholar]
- 54.Byrd AK, Raney KD. Protein displacement by an assembly of helicase molecules aligned along single-stranded DNA. Nat Struct Mol Biol. 2004;11(6):531–538. doi: 10.1038/nsmb774. [DOI] [PubMed] [Google Scholar]
- 55.Chrysogelos S, Griffith J. Escherichia coli single-strand binding protein organizes single-stranded DNA in nucleosome-like units. Proc Natl Acad Sci USA. 1982;79(19):5803–5807. doi: 10.1073/pnas.79.19.5803. [DOI] [PMC free article] [PubMed] [Google Scholar]
- 56.Lohman TM, Overman LB. Two binding modes in Escherichia coli single strand binding protein-single stranded DNA complexes. Modulation by NaCl concentration. J Biol Chem. 1985;260(6):3594–3603. [PubMed] [Google Scholar]
- 57.Suksombat S, Khafizov R, Kozlov AG, Lohman TM, Chemla YR. Structural dynamics of E. coli single-stranded DNA binding protein reveal DNA wrapping and unwrapping pathways. eLife. 2015;4:4. doi: 10.7554/eLife.08193. [DOI] [PMC free article] [PubMed] [Google Scholar]
- 58.Roy R, Kozlov AG, Lohman TM, Ha T. Dynamic structural rearrangements between DNA binding modes of E. coli SSB protein. J Mol Biol. 2007;369(5):1244–1257. doi: 10.1016/j.jmb.2007.03.079. [DOI] [PMC free article] [PubMed] [Google Scholar]
- 59.Merrikh CN, Brewer BJ, Merrikh H. The B. subtilis accessory helicase PcrA facilitates DNA replication through transcription units. PLoS Genet. 2015;11(6):e1005289. doi: 10.1371/journal.pgen.1005289. [DOI] [PMC free article] [PubMed] [Google Scholar]
- 60.Comstock MJ, et al. Protein structure. Direct observation of structure-function relationship in a nucleic acid-processing enzyme. Science. 2015;348(6232):352–354. doi: 10.1126/science.aaa0130. [DOI] [PMC free article] [PubMed] [Google Scholar]
- 61.Maluf NK, Fischer CJ, Lohman TM. A dimer of Escherichia coli UvrD is the active form of the helicase in vitro. J Mol Biol. 2003;325(5):913–935. doi: 10.1016/s0022-2836(02)01277-9. [DOI] [PubMed] [Google Scholar]
- 62.Cheng W, Hsieh J, Brendza KM, Lohman TM. E. coli Rep oligomers are required to initiate DNA unwinding in vitro. J Mol Biol. 2001;310(2):327–350. doi: 10.1006/jmbi.2001.4758. [DOI] [PubMed] [Google Scholar]
- 63.Epshtein V, et al. UvrD facilitates DNA repair by pulling RNA polymerase backwards. Nature. 2014;505(7483):372–377. doi: 10.1038/nature12928. [DOI] [PMC free article] [PubMed] [Google Scholar]
- 64.Barranco-Medina S, Galletto R. DNA binding induces dimerization of Saccharomyces cerevisiae Pif1. Biochemistry. 2010;49(39):8445–8454. doi: 10.1021/bi100984j. [DOI] [PubMed] [Google Scholar]
- 65.Runyon GT, Wong I, Lohman TM. Overexpression, purification, DNA binding, and dimerization of the Escherichia coli uvrD gene product (helicase II) Biochemistry. 1993;32(2):602–612. doi: 10.1021/bi00053a028. [DOI] [PubMed] [Google Scholar]
- 66.Antony E, Kozlov AG, Nguyen B, Lohman TM. Plasmodium falciparum SSB tetramer binds single-stranded DNA only in a fully wrapped mode. J Mol Biol. 2012;420(4-5):284–295. doi: 10.1016/j.jmb.2012.04.022. [DOI] [PMC free article] [PubMed] [Google Scholar]
- 67.Murphy MC, Rasnik I, Cheng W, Lohman TM, Ha T. Probing single-stranded DNA conformational flexibility using fluorescence spectroscopy. Biophys J. 2004;86(4):2530–2537. doi: 10.1016/S0006-3495(04)74308-8. [DOI] [PMC free article] [PubMed] [Google Scholar]
- 68.Thirumalai D, Ha BY. Statistical mechanics of semi-flexible chains. In: Grosberg A, editor. Theoretical and Mathematical Models in Polymer Research. Academic Press; San Diego: 1998. pp. 1–35. [Google Scholar]


