Significance
Much of our knowledge about the role of dopamine (DA) during learning comes from studying the ventral tegmental area (VTA)-to-striatum pathway, and considerably less is known about the function of phasic DA release in other regions, such as the medial prefrontal cortex (mPFC). By pairing auditory conditioned stimuli (CSs) with optogenetically activated VTA-to-mPFC projections, we show that mice learn faster a subsequent task that involves discrimination of the same CSs against unpaired stimuli. During and after CS-DA pairing, mPFC neurons specifically increase firing in response to the paired CSs, and blocking DA receptors in mPFC during learning impairs stimulus discrimination. Thus, phasic DA acts in mPFC to enhance discrimination of behaviorally relevant stimuli during learning.
Keywords: learning, attention, dopamine
Abstract
Phasic dopamine (DA) release is believed to guide associative learning. Most studies have focused on projections from the ventral tegmental area (VTA) to the striatum, and the action of DA in other VTA target regions remains unclear. Using optogenetic activation of VTA projections, we examined DA function in the medial prefrontal cortex (mPFC). We found that mice perceived optogenetically induced DA release in mPFC as neither rewarding nor aversive, and did not change their previously learned behavior in response to DA transients. However, repetitive temporal pairing of an auditory conditioned stimulus (CS) with mPFC DA release resulted in faster learning of a subsequent task involving discrimination of the same CS against unpaired stimuli. Similar results were obtained using both appetitive and aversive unconditioned stimuli, supporting the notion that DA transients in mPFC do not represent valence. Using extracellular recordings, we found that CS-DA pairings increased firing of mPFC neurons in response to CSs, and administration of D1 or D2 DA-receptor antagonists in mPFC during learning impaired stimulus discrimination. We conclude that DA transients tune mPFC neurons for the recognition of behaviorally relevant events during learning.
The firing activity of dopamine (DA) neurons in the ventral tegmental area (VTA) is consistent with a role of reward prediction error signal, which is believed to guide behavioral adaptation through DA release in target brain regions (1–7). Experiments using optogenetic manipulations have established a causal link between the activity of DA neurons in VTA and the reinforcing signal that mediates learning and conditioning (8–10). Stimulation of VTA, however, results in transient DA release in many target areas, and it is unclear how each of these regions contributes to learning. For example, compared with the striatum, the medial prefrontal cortex (mPFC) receives fewer DA projections (11), expresses fewer DA reuptake transporters (12), and exhibits an overall lower level of DA (13, 14). Nevertheless, pharmacological studies have implicated DA as a powerful neuromodulator of mPFC, able to influence many cognitive functions that support learning (15–21). Furthermore, DA neurons in VTA projecting to either the striatum or mPFC have distinct intrinsic neuronal properties and receive distinct inputs (22–24); thus, they are likely to serve different roles. It remains unclear what function phasic DA release might have in mPFC, whether it carries any valence, or how it affects stimulus-specific learning.
In this study, we addressed specifically the role of phasic DA release in stimulus–response association. Using optogenetically timed release of DA from VTA neuronal projections in mPFC, we found that DA transients enhance the firing of mPFC neurons in response to the paired conditioned stimuli (CSs), whereas blocking DA receptors in mPFC during learning impairs stimulus discrimination. Furthermore, pairing a CS with optogenetic stimulation of DA fibers in mPFC facilitates the subsequent discrimination of this CS against other, unpaired stimuli. This effect was observed in learning tasks using either an appetitive or aversive unconditioned stimulus (US), suggesting a valence-independent DA effect in mPFC. We conclude that DA transients enhance the ability of mPFC neurons to discriminate behaviorally relevant events during learning.
Results
Phasic DA Release in mPFC Did Not Have Immediate Behavioral Effects.
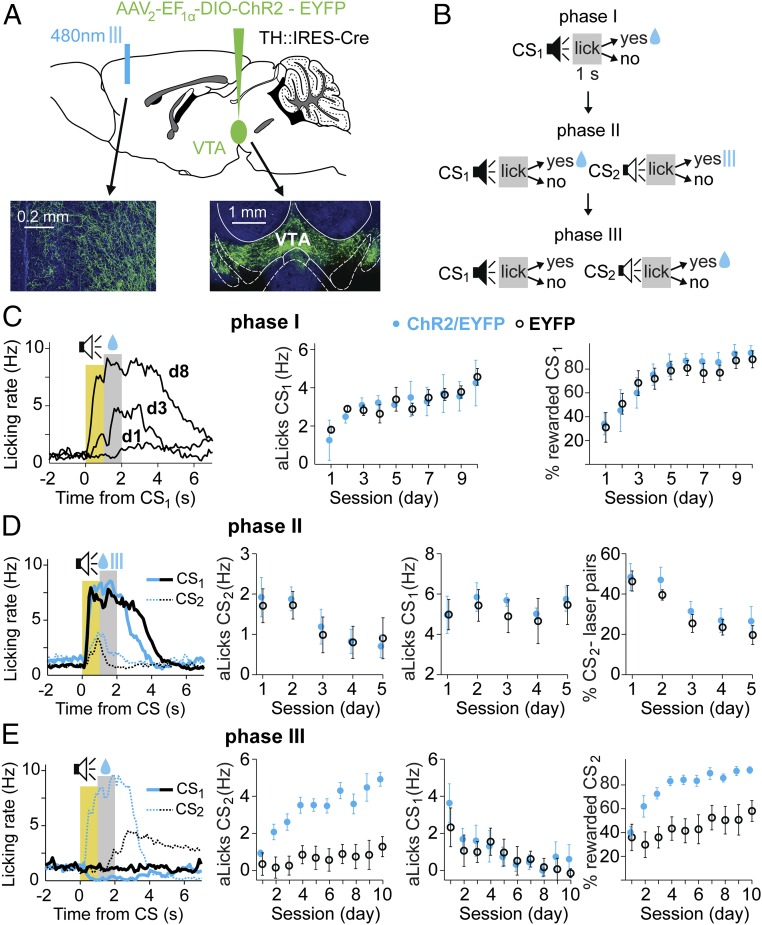
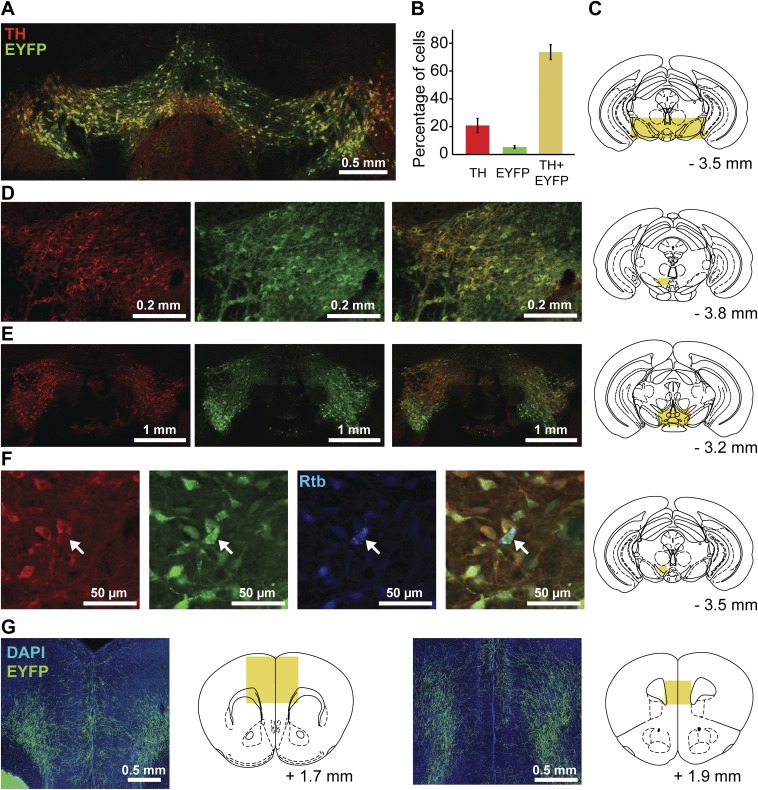
To determine the effects of phasic DA release in mPFC, we combined optogenetic control of DA VTA neurons with targeted stimulation of their axons. Channel rhodopsin-2 (ChR2) and enhanced yellow fluorescent protein (EYFP) were expressed in DA neurons by injecting a double-inverted orientation adenoassociated construct into VTA of mice that express Cre under the tyrosine hydroxylase (TH) promoter (TH-Cre; Fig. 1A). We typically found good viral expression in the VTA area and robust TH immunostaining in the majority of EYFP-expressing neurons (Fig. S1 A–E). Furthermore, all EYFP-expressing VTA neurons retrogradely labeled by fluorescent beads injected in mPFC also showed costaining with TH (Fig. S1F). Thus, EYFP-expressing axons in mPFC were projections from DA VTA neurons.
Fig. 1.
Optogenetic stimulation of DA axons in mPFC had no immediate effect on licking, but facilitated subsequent learning for the DA-paired stimulus. (A) Schematic diagram showing injection of TH-Cre mice with either DIO-ChR2-EYFP or DIO-EYFP constructs in VTA, and bilateral placement of optic fibers in mPFC. (Insets) Coronal sections with DAPI nuclear staining (blue) and EYFP expression (green). VTA axons in mPFC (Left) and VTA (Right) are shown. (B) Three-phase training protocol. Phase I: Mice were conditioned to lick at the end of a tone for water rewards (CS1, 1 s; reward period, 1 s). Phase II: A new tone (CS2) was introduced, and licking within the 1-s period following CS2 resulted in optical stimulation of VTA fibers in mPFC. Phase III: The tone and water association was switched from CS1 to CS2. (C, Left) Learning in phase I: progression of licking rate in response to CS1 on d1, d3, and d8 in the same mouse. The yellow area is the duration of CS1 and anticipatory behavior (aLicks), and the gray area is the reward period. Progression of aLicks (C, Middle) and the percentage of rewarded CS1 (C, Right) are shown, plotted as mean ± SEM for the experimental (ChR2/EYFP, solid blue circles; n = 5 mice) and control (EYFP, black circles; n = 7 mice) groups. No significant difference was found between the two groups [percentage of rewarded CS1, F(1,10) = 1.8, P = 0.4; aLicks F(1,10) = 4.2, P = 0.2]. (D) Data from phase II in the same mice as in phase I. (Left to Right) Example of licking responses to CS1 (thick lines) and CS2 (thin dotted lines) for experimental (blue) and control (black) mice; development of aLicks for CS2, CS1, and percentage of CS2-laser pairs across sessions (mean ± SEM). Note similar extinction of CS2 aLicks, and percentage of CS2-laser pairs in the two groups [F(1,10) = 4.1 and 1.2, P = 0.2 and P = 0.3, respectively]. (E) Data from phase III. (Left to Right) Example of licking behavior for experimental and control mice (same as in D); aLicks for CS2, CS1, and percentage of rewarded CS2 (mean ± SEM across days, color-coded as in D). Note the faster acquisition of aLicks and higher percentage of rewarded CS2 in the ChR2/EYFP group.
Fig. S1.
Expression of Cre-dependent EYFP in TH neurons and their mPFC projections. Expression of Cre enzyme in DA neurons was verified by injecting the AAV2-DIO-ChR2-EYFP construct in TH-Cre mice (n = 4) and performing immunostaining for TH in brain slices containing VTA. (A) Representative example of superimposed fluorescent channels (EYFP, green; TH, red). (B) Cell bodies expressing fluorescent markers (EYFP and/or Alexa 647) were counted (30 nonoverlapping images around the injection site from 16 slices, four slices from each mouse), and results were expressed as the percentage of total cells averaged across mice (n = 1,296). A small percentage of cells (5.3%) expressed the EYFP marker only, whereas the majority of cells (74%) were double-labeled. Limited viral diffusion from the injection site resulted in reduced recruitment of TH neurons from the lateral regions (A), with ∼21% of cells expressing the TH marker only. (C) Schematic drawing illustrating the location of the area displayed in A. (D and E) Additional histological examples from different mice showing TH staining (red), EYFP staining (green), overlay, and sampling location. (F) A different set of mice (n = 3) was injected with both AAV2-DIO-ChR2-EYFP in VTA and fluorescent retrograde beads (Rtb, blue) in mPFC, and then immunostained for TH. A representative example is shown. (Left to Right) TH, EYFP, Rtb, overlay, and sampling location. A total of 18 cell bodies were found expressing Rtb (25 nonoverlapping images from six slices, two from each mouse). Of these cell bodies, seven (39%) did not have either EYFP or TH fluorescence, three (17%) colocalized with TH staining, eight (44%) colocalized with both EYFP and TH, and none (0%) expressed Rtb and EYFP exclusively. (G) Examples showing a predominantly deep-layer distribution of EYFP-expressing axons in mPFC.
To determine whether the ChR2 expression itself affects the animals’ behavior, we trained both experimental (expressing ChR2/EYFP, n = 5) and control (expressing EYFP, n = 7) mice on the same auditory task. Water-restricted mice learned to lick at the end of a brief tone (CS1) to receive a water reward (US; Fig. 1B, phase I). There was a progressive development of anticipatory licks (aLicks; tone-induced licks before reward) and an increased percentage of rewarded CS1, indicating learning of the stimulus-reward association. We observed no difference in behavior between ChR2/EYFP and EYFP mice (Fig. 1C), indicating that expression of ChR2 did not affect the CS-US association or the acquisition of aLicks.
Once all animals maintained a high level of performance (rewarded CS1 ≥ 85%) for 3 consecutive days, we examined whether phasic DA release in mPFC had a rewarding or aversive effect on the licking behavior (phase II). A second conditioned tone (CS2) was introduced and, instead of water, licking at the end of CS2 triggered a brief optical stimulation of DA axons in mPFC (Fig. 1B, phase II, 5 d). If DA release in mPFC were rewarding (or aversive), one would expect the mice to lick more (or less) in response to CS2, and the number of CS2-laser pairs to extinguish at a slower (or faster) rate in the ChR2/EYFP group, compared with control mice. Surprisingly, we found that licking activity in response to CS2 was similar in the two groups: both aLicks and the number of CS2-laser pairs extinguished at a similar rate over the 5-d training period (Fig. 1D), suggesting that optogenetic stimulation of DA axons in mPFC does not influence licking behavior. We noted that these mice maintained their conditioned responses to CS1, with similar aLicks and percentage of rewarded CS1 during phase II.
Pairing of CS and DA in mPFC Disrupted Latent Inhibition.
The results from phase II in the above experiment suggest that pairing optogenetic stimulation of DA axons in mPFC with CSs had no direct behavioral consequence, or that the task was not sensitive to its effects. Previous evidence suggests that DA can modulate latent inhibition: the ability to ignore a stimulus previously presented without reinforcement (25–28). We thus further explored the possibility that CS2-DA pairing could bias the animal’s subsequent learning, by performing additional tests on the same mice.
We switched the CS-reward contingency from CS1 to CS2, the tone previously paired with optogenetic stimulation of DA axons during phase II. Over the next 10 d, licking at the end of only CS2 triggered water delivery (Fig. 1B, phase III). Control mice displayed typical latent inhibition: the CS2-reward association during phase III developed significantly slower than the association of CS1 with reward during phase I, as measured by the daily percentage of rewarded CSs [two-way, randomized ANOVA (29), F(1,12) = 26.46, P = 0.026]. Interestingly, this phenomenon was not observed in the experimental group: ChR2/EYFP mice acquired the association for CS1 (in phase I) and CS2 (in phase III) at similar rates [F(1,8) = 1.56, P = 0.68]. Compared to controls, the ChR2/EYFP group developed aLicks to CS2 faster [F(1,10) = 183.1, P < 0.0001] and consistently displayed a higher percentage of rewarded CS2 [F(1,10) = 188.7, P < 0.0001; Fig. 1E]. These results showed that although CS2-paired DA transients in mPFC did not modulate the behavior immediately, they facilitated the subsequent learning of a CS2-US association.
Optogenetic DA Release Induced CS-Specific Plasticity in mPFC Neurons.
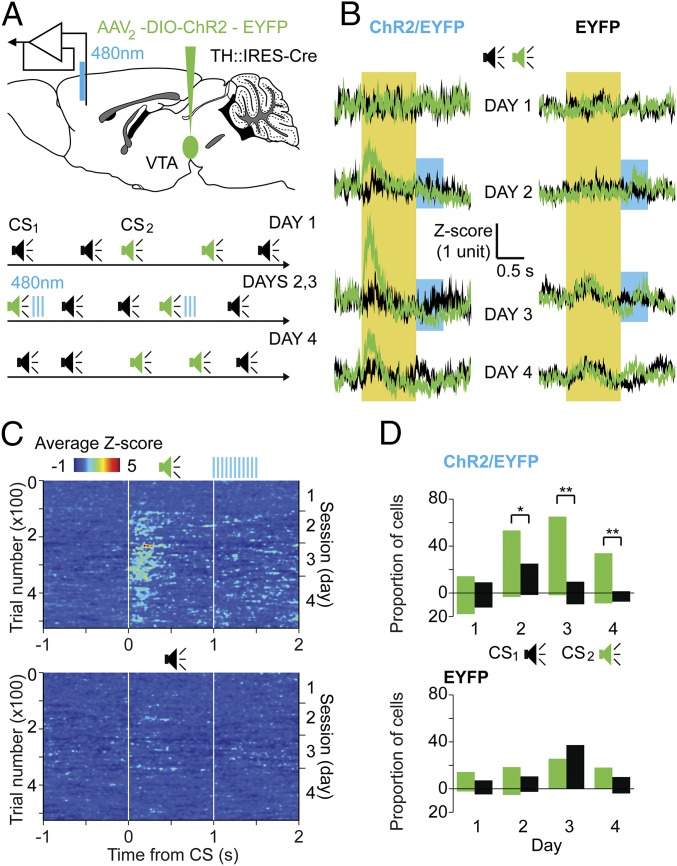
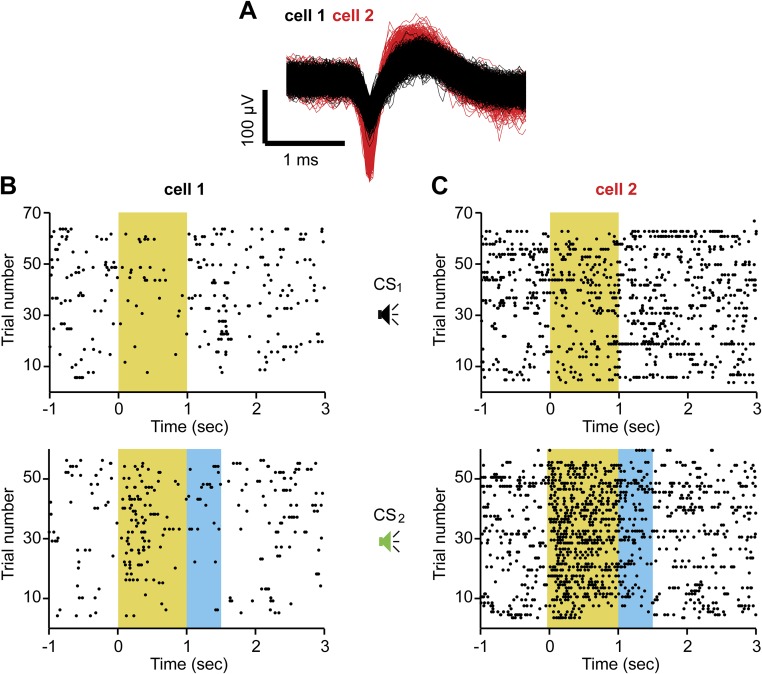
Extracellular DA affects synaptic plasticity (30–32), and temporal proximity of CS2 and DA transients in phase II of the above experiments might have facilitated neural circuit modifications that enhanced mPFC’s representation of CS2. To test this hypothesis, we recorded single-unit neuronal activity with optrodes placed in mPFC of mice expressing ChR2/EYFP in VTA DA neurons (n = 4). During randomly interspersed presentations of two different tones, one of them (CS2) was consistently followed by brief laser pulses that activated ChR2-expressing axons in mPFC (Fig. 2A). Before pairing [day 1 (d1)], the average firing of single units in mPFC showed no tone-induced responses to either CS1 or CS2 (Fig. 2B, population average across mice and tones for each session). During the following 2 d (d2 and d3), pairing CS2 with optogenetic DA release in mPFC resulted in a significant increase in the average firing rate of mPFC neurons in response to CS2 but not to CS1 (population responses in Fig. 2B and individual examples in Fig. S2). Interestingly, these responses appeared gradually during the first pairing session (d2) and persisted during d4, after the pairing was terminated (Fig. 2C).
Fig. 2.
Optogenetic stimulation of DA axons in mPFC enhanced neuronal responses to the temporally paired CSs. (A, Upper) Schematic diagram showing the site of injection for viral-mediated expression of ChR2/EYFP (or EYFP only for controls) in DA neurons of TH-Cre mice and optrode placement in mPFC for extracellular recordings and local stimulation of DA axons. (A, Lower) Experimental protocol: two tones (CS1, black; CS2, green; 1-s duration) were randomly interspersed during daily 1-h sessions. During d2 and d3, CS2 was followed by laser stimulation of local DA axons (20-ms pulses, 0.5 s, 30 Hz). (B) Population average of single-unit recordings in the experimental group (ChR2/EYFP, Left) vs. control group (EYFP, Right) are shown as neuronal firing responses to CS2 (green traces) and CS1 (black traces). Data are presented as mean ± SEM of peristimulus histograms of all individual units converted to Z-scores for each session (52–68 units per day from four ChR2/EYFP and three EYFP mice). The yellow area is the time of the CS (CS1 or CS2), and the blue area is the period of laser stimulation following CS2. (C) Population neuronal firing responses evoked by individual CS1 (Bottom) and CS2 (Top, left side y axis) over the 4 d of recording (right side y axis) in ChR2/EYFP-injected mice. Data were converted to Z-scores and averaged across all units and mice (z axis, color-coded). White lines represent the beginning and end of each CS, and blue lines at the top represent the laser stimulation period. (D) Percentage of recorded neurons that significantly increased (upward bars) or decreased (downward bars) their firing rates in response to CS1 (black) and CS2 (green) across days, for ChR2/EYFP (Top) or EYFP (Bottom) mice. A significant difference between responses to CS1 and CS2 distributions was found in the ChR2/EYFP group on d2, d3, and d4 [χ2 tests: d2, χ2(2) = 11.1, *P = 0.004; d3, χ2(2) = 34.8, **P < 0.001; d4, χ2(2) = 20.38, **P < 0.001].
Fig. S2.
Single units in mPFC responding to tones either paired or unpaired with local stimulation of DA axons. (A) Spike shapes of two units (cell 1 and cell 2, color-coded) simultaneously recorded on the same electrode during d2 (main text and Fig. 2A). Responses of cell 1 (B) and cell 2 (C) to the two tones [CS1 (Top), not laser-paired; CS2 (Bottom), laser-paired] are presented as raster plots, with action potentials in response to each CS occurrence (trial number, y axis) relative to the beginning of the CS (x axis). The yellow area marks the duration of the CS, and the blue area marks the period of laser stimulation following CS2.
Closer inspection of firing rates in individual units on d2–d3 revealed that 59% (66 of 112) and 3% (three of 112) of recorded neurons showed, respectively, transient elevation and reduction of firing rates in response to CS2, and about 42% (29 of 68) of neurons still responded on d4. There was a significant difference in the number of neurons responding to CS1 vs. CS2 during and after the pairing (Fig. 2D). When the same experiment was performed on control mice (EYFP injected, n = 3), we found no significant difference in mPFC neuronal firing rates evoked by CS1 vs. CS2 (Fig. 2 B and D). These findings support the notion that optogenetic stimulation of DA axons facilitates mPFC circuit modification, leading to enhanced responses to the predictive CS. This enhancement could account for the reduction in latent inhibition observed in phase III of the first set of experiments.
Prior Pairing of CS with DA Release Facilitated Subsequent Learning.
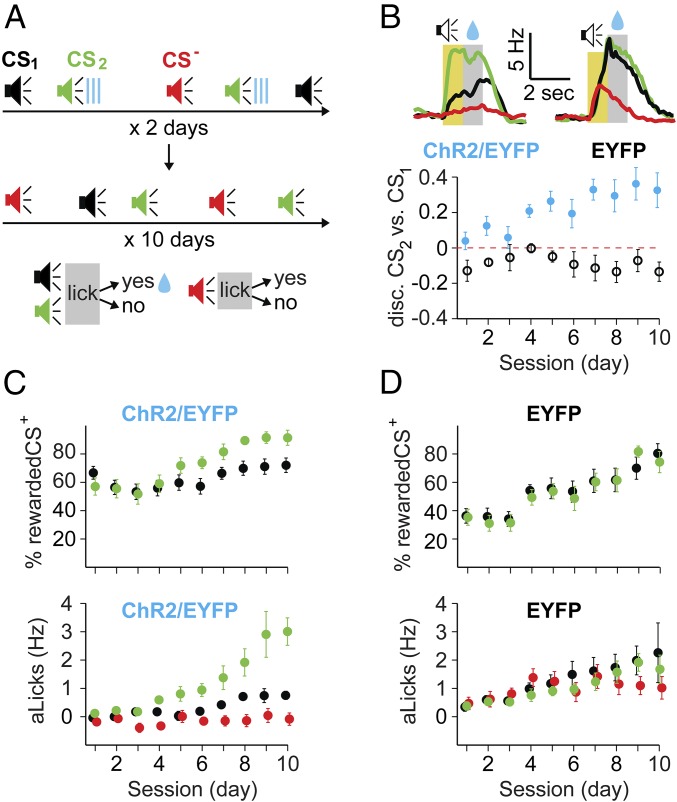
We further tested the hypothesis that stimulus-specific DA priming in mPFC could facilitate subsequent reward-associated learning. Mice with bilateral expression of ChR2/EYFP (or EYFP alone) in DA VTA neurons were implanted with optical fibers in mPFC and exposed for 2 d to three randomly interspersed tones of different frequencies, one of them (CS2) immediately followed by optical activation of DA axons (Fig. 3A). Over the next 10 d, mice learned that licking at the end of both CS1 and CS2, but not CS−, was rewarded with a drop of water. We used this three-tone protocol to control for the specificity of VTA priming of mPFC (CS2 vs. CS1), as well as to assess the mouse’s ability to discriminate the tones, rather than simply responding to any auditory cue (CS2, CS1 vs. CS−).
Fig. 3.
Pairing of CSs with DA release in mPFC was sufficient to bias subsequent stimulus discrimination learning. (A) Diagram depicting the experimental protocol: TH-Cre mice, expressing ChR2/EYFP or EYFP-only in DA neurons and optic-fiber implants in mPFC were exposed for 2 d to three randomly interspersed tones (CS1, black; CS2, green; CS−, red; 1 s; different frequencies), and CS2 was immediately followed by laser stimulation of DA axons in mPFC. Mice were then trained to lick for reward at the end of CS1 and CS2 over the next 10 d, whereas CS− remained unrewarded. (B) Different licking behavior in the experimental (ChR2/EYFP) and control (EYFP) groups. (Top) Representative examples of licking during d8 are presented as the average licking rate in response to various CSs for the two groups. The yellow area is the duration of the CS, and the gray area is the reward period. (Bottom) Average CS2 vs. CS1 discrimination score (normalized difference in aLicks) for the ChR2/EYFP (blue) and EYFP (black) groups across sessions (x axis). The red dotted line represents a score of 0 (no preference); error bars are SEM. (C and D, Top) Progression of the percentage of rewarded CSs (y axis; CS1, black; CS2, green) across sessions (x axis). (C and D, Bottom) aLicks in response to CSs (y axis) across sessions (x axis) for ChR2/EYFP (C) and EYFP (D) mice. Data are color-coded for the three tones (CS1, black; CS2, green; CS−, red) and presented as mean (circles) ± SEM (error bars). Note the higher starting point for the percentage of rewarded CS2 in experimental vs. control groups (54.6 ± 4.3% vs. 34.4 ± 3.1%, respectively).
During the 10 d of training, both groups (DA-paired: ChR2/EYFP, n = 5; control: EYFP only, n = 6) became proficient in obtaining the reward, but their licking behavior was markedly different (examples in Fig. 3B). Looking at the percentage of rewarded CSs, a three-way ANOVA analysis for tone, day, and group revealed significant effects for group [F(1,8) = 6.2, P = 0.037], day [F(1,8) = 71.7, P < 0.001], and group–day interaction [F(1,8) = 6.843, P = 0.031]. The CHR2/EYFP group had a clear preference for CS2 compared with CS1, in terms of both the percentage of rewarded presentations [F(1,8) = 15.3, P = 0.01] and aLicks [F(1,8) = 10.18, P = 0.002], whereas no such preference was observed in the control group [rewarded CS presentations F(1,10) = 0.11, P = 0.87; aLicks F(1,10) = 3.56, P = 0.46; Fig. 3 C and D]. A score for discrimination between CS2 and CS1 based on aLicks revealed a significant difference between the ChR2 and EYFP groups, with control mice exhibiting larger degrees of stimulus generalization [F(1,8) = 51.7, P < 0.0001; Fig. 3B].
We also found that following CS2-DA pairing, mice exhibited higher percentages of rewarded CS2 compared with EYFP controls on d1 [t test: t(9) = 3.8, P = 0.002], further indicating that the DA priming facilitated subsequent learning. Thus, optogenetically induced DA release in mPFC improved the subsequent stimulus discrimination and biased behavioral choices toward the paired stimulus (CS2), even though both CS1 and CS2 were reward-associated.
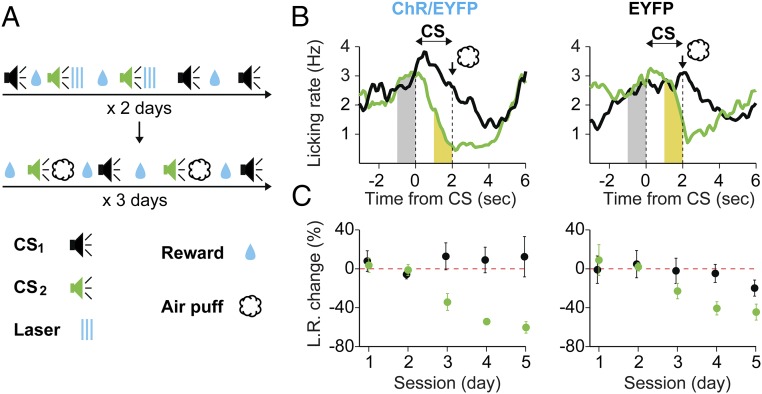
To test whether DA priming of mPFC can also facilitate associative learning with an aversive US, we trained a separate set of mice (ChR2/EYFP group: n = 6, EYFP group: n = 6) to consume randomly available water. Following a 2-d pairing of CS2 with optogenetic stimulation of DA axons in mPFC, we replaced the laser stimulation with an eye-targeted air puff coinciding with the end of CS2 (Fig. 4A), while monitoring the licking behavior. Compared to the control group, DA-primed mice showed better CS2 discrimination against CS1, as evidenced by the voluntary suppression of licking behavior in anticipation of the air puff (examples in Fig. 4B, group summary in Fig. 4C). A three-way ANOVA analysis revealed significant effects for tone [F(1,10) = 53.69, P < 0.001] and group–tone interaction [F(1,10) = 12.91, P = 0.005]. These results were mainly due to a greater suppression of licking toward the end of CS2 in the ChR2/EYFP group, compared to the EYFP group [two-way ANOVA, effect of group: F(1,10) = 37.08, P < 0.001]. These results, together with the findings using an appetitive US, suggest that pairing a CS with optogenetic DA release in mPFC facilitates CS discrimination regardless of the valence of the US. This discrimination is achieved by enhancing responses to CS+ and suppressing inappropriate responses to CS−.
Fig. 4.
Pairing CSs with optogenetic stimulation of DA fibers in mPFC facilitates subsequent associative learning using an aversive US. (A) Behavioral paradigm: control (EYFP, n = 6) and experimental (ChR2-EYFP, n = 6) mice were exposed for 2 d to two tones (CS1, green; CS2, black; 2-s duration; different frequencies), the end of CS2 coinciding with laser stimulation of DA fibers in mPFC (blue lines). Over the next 3 d, CS2 presentations were immediately followed by brief, eye-targeted air puffs. For the whole duration of the experiment (5 d) mice had access to randomly available water. (B) Examples of licking on d4 for an experimental (Left) and control (Right) mouse. The average licking rate (L.R., y axis) is presented around CS1 (black traces) and CS2 (green traces) as a function of time (x axis) relative to CS onset. Shaded areas under the L.R. traces (gray, 1 s before CS onset; yellow, 1 s after CS onset) were used for calculating the L.R. change. (C) Average L.R. changes following CS1 (black) and CS2 (green) presentations (y axis) as a function of session (x axis), for experimental (Left) and control (Right) mice. Data are presented as mean (circles) ± SEM (error bars). The red dotted line at 0 indicates no change. Note the higher reduction of licking in response to the optogenetically DA-paired CS2.
Role of D1 and D2 Receptors in Stimulus Discrimination Learning.
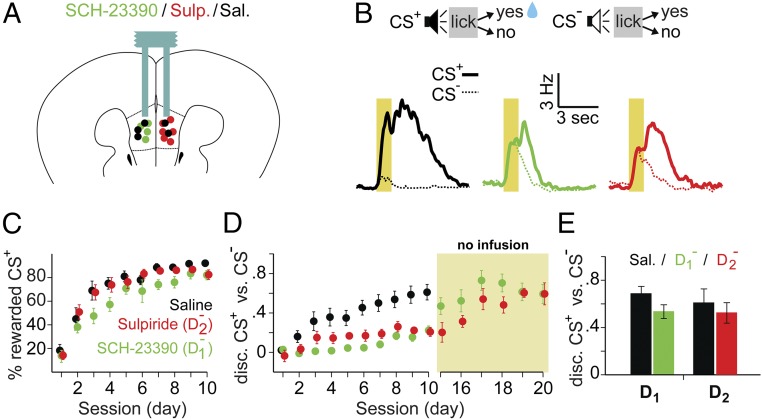
To further determine whether endogenous DA activity in mPFC plays a role in stimulus discrimination learning, we locally infused saline (Sal), D1, or D2 receptor antagonists (Fig. 5A; D1− and D2−) during the learning of a two-tone discrimination task with an appetitive US (Fig. 5B; CS+, rewarded; CS−, unrewarded). Over 10 d of training, all mice successfully learned the task, as indicated by the emergence of aLicks (Fig. 5B, example traces) and high percentage of rewarded trials on d10 (Fig. 5C). However, compared to control mice, both D1− and D2− groups were impaired in discriminating between CS+ and CS− (Fig. 5D and Fig. S3).
Fig. 5.
Blocking D1 or D2 receptors in mPFC impaired stimulus discrimination. (A) Schematic diagram showing bilateral cannula placement for mice receiving injections of Sal (n = 6), D1− (n = 8), or D2− (n = 9) in mPFC (black, green, and red, respectively). (B) Mice learned a two-tone discrimination task (CS+, rewarded; CS−, unrewarded). (Bottom) Traces show typical licking behavior on d8 for a mouse in each group (CS+, thick lines; CS−, thin dotted lines), using the same color code as in A. (C and D) Progression of learning is shown across sessions (x axis) as the average percentage of rewarded CS+ presentations (C) and CS+ vs. CS− discrimination score (D). Data are presented as mean (solid circles) ± SEM (error bars), with the same color code as in A. Note that although the percentages of rewarded CS+ were similar between groups, discrimination (disc.) scores were significantly different [F(2,19) = 6.924, P = 0.015; Sal 0.59 ± 0.09 vs. D1− 0.22 ± 0.04, t(12) = 3.53, P = 0.008; vs. D2− 0.19 ± 0.04, t(13) = 3.99, P = 0.003; Bonferroni corrected post hoc t tests on d10]. Several mice receiving D1− or D2− receptor antagonists (n = 4 and n = 6, respectively) were further trained without drug infusion (yellow shaded area in D) until they reached the same discrimination level as controls (D1−, 0.59 ± 0.11; D2−, 0.59 ± 0.09). (E) CS+ vs. CS− discrimination scores for sessions where these mice received alternating injections of Sal and D1− or D2−. No difference was observed between treatments [Sal vs. D1−: 0.62 ± 0.05 and 0.61 ± 0.04, t(14) = 0.04, P = 0.49; Sal vs. D2−: 0.58 ± 0.04 and 0.54 ± 0.05, t(22) = 0.87, P = 0.21]. Data are presented as mean ± SEM across mice and sessions.
Fig. S3.
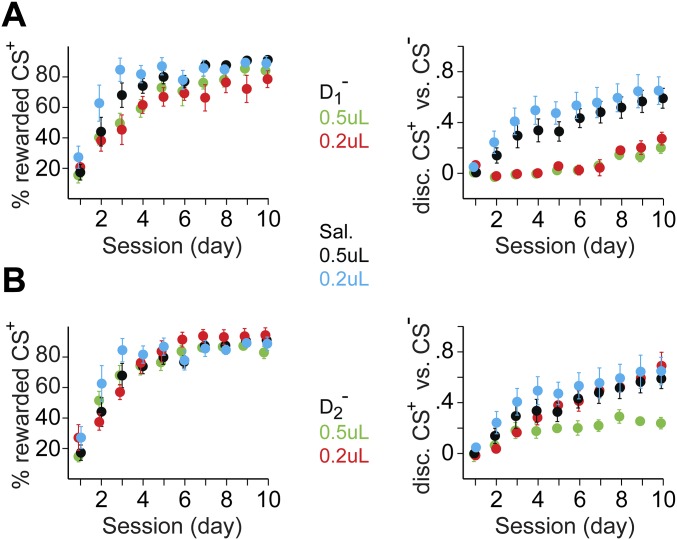
Behavioral effects of mPFC DA receptors’ inactivation: volume/dose comparison. Two injection volumes (0.2 and 0.5 μL per hemisphere) corresponding to two drug concentrations (D1−: SCH-23390, 0.2 μg, n = 4 and 0.5 μg, n = 8; D2−: sulpiride, 0.4 μg, n = 4 and 1 μg, n = 9) were tested against Sal injections in mPFC (0.2 μL, n = 6 and 0.5 μL, n = 6). (A) Progression of the percentage of rewarded CS+ presentations (Left, y axis) and CS+ vs. CS− discrimination score (Right, y axis) as a function of training session number (x axis) for mice receiving 0.2 μL of Sal (blue lines), 0.5 μL of Sal (black, same data as in Fig. 5 C and D), 0.2 μL of D1− (red), and 0.5 μL of D1− (green, same data as in Fig. 5 C and D). (B) Similar presentation for injections of 0.2 μL of Sal (blue), 0.5 μL of Sal (black, same data as in Fig. 5 C and D), 0.2 μL of D2− (red), and 0.5 μL of D2− (green, same data as in Fig. 5 C and D). Data in both A and B are presented as the group average (solid circles) ± SEM (error bars).
Additional training, after the termination of D1− or D2− infusions, revealed that the same mice were able to reach discrimination levels similar to controls (Fig. 5D). Furthermore, once these mice acquired a good CS+ vs. CS− discrimination, alternating infusions of D1−, D2−, or vehicle had no effect on performance (Fig. 5E). These results are consistent with previous findings (33), and further indicate that DA acts in mPFC during learning to facilitate the recognition of reward-associated stimuli, but is not required for performing the task itself.
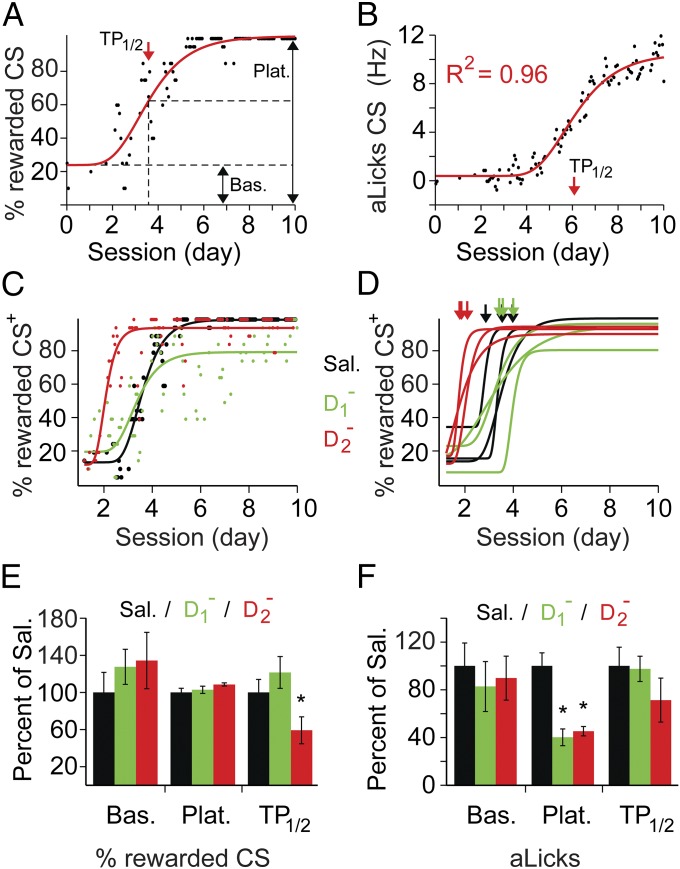
Group averaging can sometimes mask learning dynamics (34). To better understand the role of D1 and D2 mPFC receptors during discrimination learning, we fit the data from each mouse in the above experiment with a sigmoidal curve (examples in Fig. 6 A–C and Fig. S4) and analyzed three parameters of the fit: baseline (percentage of rewarded CS+ at the beginning of training), plateau (maximal percentage of rewarded CS+), and time point of half-amplitude between baseline and plateau (TP1/2, Fig. 6A). Comparing these learning curves for the experiments in which our model was a good fit (Sal, n = 6; D1−, n = 5; D2−, n = 7; see Materials and Methods and Fig. S4), we found that D2− infusion accelerated the stimulus–response acquisition compared to Sal and D1− infusions: TP1/2 occurred after 103.8 ± 28.3 trials vs. 175.2 ± 27.8 trials in control mice [Bonferroni corrected t test: t(11) = 2.6 P = 0.05]. A similar analysis on the progression of aLicks revealed that both D1− and D2− groups had lower plateau values compared with controls (Fig. 6F). These experiments indicate that normal activity of D1 and D2 mPFC receptors is required for the acquisition of stimulus discrimination, and proper development of aLicks.
Fig. 6.
Analysis of individual learning curves reveals differential roles for D1 and D2 mPFC receptors in stimulus-discrimination learning. Examples of fit and parameter extraction for percentage of rewarded CS+ (A) and aLicks (B) from one mouse: individual data points (black dots, moving average of 20 CS+ presentations) were fitted with a sigmoid function (red lines). The baseline (Bas.), plateau (Plat.), TP1/2 (red arrows), and goodness of fit (R2) were extracted for between-group comparisons. (C) Example of sigmoidal fit (solid lines) to the percentage of rewarded CS+ vs. time (individual data points) for one mouse in each group (color code on the right). (D) Examples of color-coded sigmoidal fits (three for each: Sal, black; D1−, green; D2−, red); arrows indicate TP1/2. Note the leftward shift of TP1/2 in the D2− group. (E and F) Comparison of fit parameters between the three groups for the progression of percentage of rewarded CS+ (E) and aLicks (F). Data are presented as the mean (±SEM error bars) normalized to Sal values (*P ≤ 0.05, corrected t tests). (F) A significant reduction in plateau values was found for D1− and D2− groups [Sal: 7.87 ± 0.9; D1−: 3.16 ± 0.6, t(9) = 3.8, P = 0.004; D2− : 3.56 ± 0.31, t(11) = 4.24, P = 0.001; Bonferroni corrected t tests].
Fig. S4.
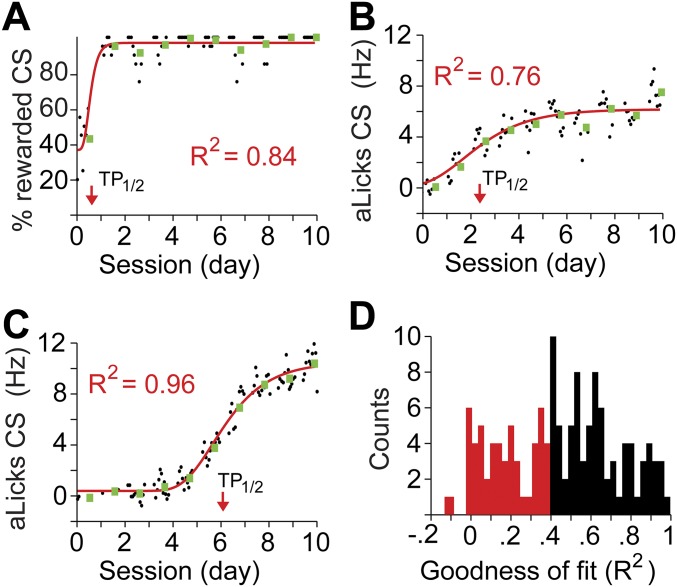
Sigmoidal fits to the learning curves revealed transition points in behavior. Examples of sigmoidal fit: Individual data points (black circles, moving average of 20 CS+ presentations) representing the percentage of rewarded CS+ across time (A, x axis) or aLicks (B and C) were fit with a sigmoid function (red lines). The baseline (Bas.), plateau (Plat.), TP1/2 (red arrows), and goodness of fit (R2) were extracted for each case. Green squares represent the average values within a full, daily session. (D) Histogram of R2 values for the sigmoidal fits of all animals used in this study (percentage of rewarded CS+ and aLicks). Red bars correspond to data that were not used in the analysis due to “poor” fit (R2 < 0.4).
Discussion
We used optogenetic manipulation of VTA projections in mPFC to show that pairing a neutral stimulus with phasic DA release enhances its ability to become a CS during subsequent learning. The DA’s effect in mPFC was valence-independent: this facilitation effect was observed both when the associated US was appetitive and when it was aversive. These results were surprising, particularly because similar optogenetic experiments found that cell body stimulation of DA neurons in VTA was sufficient for appetitive conditioning (8–10, 35), whereas others reported that stimulation of habenular inputs to mPFC-projecting DA neurons had an aversive effect (23). Together with our results, these findings indicate that the effects of phasic DA release from VTA axons are target-specific and can have different behavioral consequences. Because the striatum is by far the densest innervated region, it is conceivable that the immediate behavioral effects of stimulating DA cell bodies in VTA are due to striatal DA release. By contrast, we found that phasic DA release from VTA projections in mPFC had no immediate effect on behavior. Instead, it facilitated subsequent learning, during which the DA-paired stimulus predicted either an appetitive or an aversive event. Local mPFC stimulation of DA axons (rather than their cell bodies) allowed us to address the role of DA neurons along the VTA-mPFC projection pathway specifically.
There has been concern regarding the specificity of Cre expression in the TH-Cre mouse line (36). We have indeed observed expression of EYFP in a small subset of non-TH cells following injection of the Cre-dependent viral construct ChR2/EYFP in VTA (Fig. S1). We therefore retrogradely labeled mPFC-projecting VTA neurons by injecting fluorescent beads into mPFC, and performed TH immunostaining to show that all retrogradely labeled EYFP-expressing neurons were TH-positive (Fig. S1F). We found no evidence for mPFC projections of EYFP-positive neurons that were nondopaminergic. Nevertheless, we cannot exclude the possibility that other neurotransmitters besides DA, possibly coreleased from TH-expressing axons, could explain our behavioral results. However, our observations following inhibition of D1 and D2 receptors do support the notion that phasic DA release represents the main mechanism by which our optogenetic stimulations altered the animal’s behavior in associative learning.
In this study, we found that pharmacological inhibition of DA receptors was only effective when the drug infusion was done during, but not after, associative learning (Fig. 5 D and E). These findings suggest that endogenous DA release in mPFC triggers progressive changes in the local circuit that, together with VTA adaptations, allow the animal to elicit stimulus-specific responses, including aLicks. The progressive change of mPFC circuits was also reflected in the increase of CS-evoked firing of mPFC neurons during and after the period of pairing CSs with optogenetic stimulation of DA inputs (Fig. 2). Given the reciprocal connections between mPFC and VTA (37), it is possible that CS-evoked neuronal responses in mPFC activate DA neurons in VTA, effectively creating a positive feedback loop that progressively shifts the DA transients earlier in time. This form of plasticity could explain the CS’s ability to evoke firing of DA neurons before reward. Once the association is learned, DA release in mPFC is not required for stimulus discrimination or performance, but might be used for other cortical functions. Further studies are required to test this model and to elucidate the underlying circuit and synaptic mechanisms.
By analyzing the learning curve of each subject separately, we were able to identify that D2− mPFC infusions during learning accelerated the stimulus–response acquisition compared to Sal or D1− infusions (Fig. 6E). This effect was not obvious when looking at the group average (Fig. 5C). In addition to the higher accuracy of the sigmoidal fit in detecting TP1/2, we identified a subset of mice (two of nine) that learned the task slower than the other D2−-treated subjects. These mice had a poor learning curve fit (R2 < 0.4; Materials and Methods and Fig. S4D) and were not included in the summary (data in Fig. 6E). However, we had no a priori reason to eliminate these mice from our group averaging analysis.
Our results are consistent with the notion that phasic DA release in mPFC has a role of stimulus “stamping-in,” involving a long-lasting enhancement of CS-induced neuronal responses in mPFC. In turn, this enhancement may exert top-down behavioral modulation resembling selective attention (17, 21, 28, 38). Our results support a model of reward-associated learning in which mPFC acts as a filter for stimuli that are relevant to the animal’s needs and DA transients in mPFC represent the instructive, possibly saliency, signal. Previous studies have shown that DA neurons respond to positive and negative, as well as nonconditioned stimuli (39–41). Although different groups of neurons with distinct properties and projections (22, 33, 42) are probably involved, our results suggest that phasic DA release in mPFC carries a “value without valence” signal, similar to saliency. Further studies using more demanding tasks may, however, reveal additional information about DA transients in mPFC.
Materials and Methods
Subjects.
TH-IRES-Cre mice (EM:00254) were obtained from the European Mouse Mutant Archive. Colonies were maintained by mating carriers of the gene (TH-Cre) with C57BL/6 wild-type mice. Subjects were housed in standard cages (three to five animals per cage) on a 12-h dark/light cycle. Adult mice (10–14 wk old) were used in all experiments. All procedures were approved by the Animal Care and Use Committee at the University of California, Berkeley.
Surgical Procedures.
Mice were anesthetized with ketamine (75 mg/kg, i.p.) and maintained with a mixture of isoflurane and oxygen [1.5% (vol/vol)]. The analgesic buprenorphine (0.03 mg/kg, s.c.) was administered at the end of the procedure. For viral injections, a craniotomy was made above VTA (bregma −3.5 mm, 0.6 mm lateral) and 1 μL of adeno-associated virus (AAV) (> 1 × 10⁹ viral particles) was deposited in each hemisphere at a depth of 4.0 mm. All viral constructs used a double-inverted-orientation (DIO), were acquired from the University of North Carolina Gene Therapy Center, and were of AAV2 serotype: EF1α-DIO-hChR2(H134R)-EYFP, EF1α-DIO-EYFP. An additional craniotomy was made above mPFC (bregma +1.97 mm, lateral 0.4 mm). For subsequent electrophysiology recordings, the skull was then covered with a silicon sealant (Kwik-Cast; WPI); otherwise, optic fibers (200-μm multimode, 0.39 N.A.; Thorlabs) coupled to ceramic ferrules (Precision Fiber Products, Inc.) were placed bilaterally at a depth of 1.6 mm and then fixed with dental acrylic (Teets; AM Systems). Alternatively, custom-made bilateral cannula guides (PlasticOne) were lowered into mPFC (depth of 1.7 mm) for subsequent local drug infusion. Mice were also fitted with small screws (McMaster–Carr) for head-fixing in custom-made setups. To identify the location of optic fibers and optrodes, a DiI coating (Sigma) was applied on the tip of the implants. For retrograde labeling of mPFC-projecting VTA neurons, fluorescent retrobeads (Red Retrobeads; Lumafluor, Inc.) were injected in mPFC at the same coordinates as above (0.5 μL). All mice were allowed to recover for 5–7 d before behavioral procedures.
Behavioral Setups and Procedure.
The behavioral setup consisted of a custom-made head-fixing piece (eMachineShop) that was able to accommodate the screws implanted during surgery and was connected to a breadboard through post holders (Thorlabs). The body of the mouse was placed in an acrylic tube (McMaster–Carr) while a water spout positioned in front of its mouth allowed the animal to drink. Licks were monitored with a custom-made infrared beam detector, and water delivery was controlled with a solenoid valve (Sizto Tech Corporation). The entire setup was placed in a closed, sound-attenuating chamber fitted with a fan and speakers for sound delivery. The equipment was controlled by a computer with a PCI-DAQ board (National Instruments) and custom software developed in MATLAB (MathWorks).
Mice were gradually adapted to handling, head restraining, and water drinking while head-fixed. For cannula-implanted mice, handling began 5–7 d postsurgery; mice receiving ChR2/EYFP or EYFP injections in VTA were allowed an extra 3 wk of recovery. After the accommodation phase, mice were exposed to daily 1-h training sessions consisting of interspersed tone (CS) presentations and conditioned water rewards. The CSs were 1-s tones of different frequencies (4, 10, and 16 kHz) tapered over the initial and final 50 ms, and delivered every 10–20 s at 70 dB. The CS sequence was randomized, with the same CS presented no more than three consecutive times. At the end of CS+, the mice had 1 s to respond by licking the spout to receive a drop of water (5 μL). A similar procedure was used for optical stimulation experiments (Fig. 1), where the first lick encountered during a 1-s window at the end of CS2 triggered the laser pulses. For procedures requiring two CSs, the extreme frequencies (4 and 16 kHz) were used, and for three CSs, the 10-kHz tone was always chosen as CS− (unrewarded). Tones were counterbalanced such that ∼50% of the mice in each group received the same frequency tone paired with reward and/or laser stimulation. If necessary, mice were supplemented with water at the end of training sessions to maintain ∼90% of their initial body weight. All water-restricted mice were assessed daily; animals dropping more than 15% of their initial body weight were taken out of the study.
Behavioral performance was measured with two parameters: the percentage of Hits (CS+ presentations followed by licks and water delivery during the reward period) expressed as 100 * (number of Hits)/(number of CS+), and the development of aLicks that occurred during the CS presentation (average licking rate during the CS minus average licking rate in the second before the CS). Discrimination scores were computed as the difference in licking during two CSs, normalized to their sum. In all cases, only the “active” periods of each session were analyzed, with an active CS defined as a presentation preceded and/or followed by at least one lick in a 1-min window.
For aversive conditioning, an air-puff delivery system was positioned in proximity to the right eye. The system was controlled by a solenoid valve able to deliver brief puffs (50-ms duration pulses), and the pressure was set such that air puffs could be gently felt on the skin of the experimenter. Experiments began as described above, with adapting water-restricted mice to being head-fixed and drinking water in the setup. To encourage a higher level of background licking, water was made available at random intervals: periods of 5 s (during which the first detected lick was followed by 5 μL of water) were interspersed with time-outs of random duration (8–16 s). Two tones were used (CS1 and CS2, 2-s duration, 4 and 16 kHz randomly assigned), and for 2 d, one of them (CS2) was immediately followed by bilateral laser stimulation in mPFC. The air-puff system was positioned (but not activated) during all phases of the experiment, allowing mice to accustom to it. For the following 3 d mice continued to consume water in the same fashion and, instead of laser stimulation, an air puff was delivered at the end of CS2. We observed eye-blinking in response to the puffs, but were unable to use this measurement, because all mice quickly adapted by closing their eyes for extended periods of time. Learning was instead assessed by monitoring the reward consumption around CS presentations, and expressed as the percentage of licking rate change during the last second of the CS (before puff) relative to the second before the CS.
To characterize the temporal aspect of learning in individual mice, a sigmoidal function (Gompertz model) was used to fit the data. Each data and corresponding time point was the average value (percentage of rewarded CSs or aLicks) of 20 consecutive, active CSs. The fit had four coefficients, and we used the R2 value to assess the goodness of fit:
where t is time and a, b, c, and d are coefficients of the fit. For between-group comparison of learning curves, we calculated three parameters: baseline, defined as F(0); plateau, defined as a + b; and TP1/2, defined as the number of CS presentations required to reach half of maximal performance: the t value, where F(t) = a + b/2. In all comparisons, we included only parameters from fits that yielded R2 ≥ 0.4 (histogram of R2 values in Fig. S4D).
Optical Stimulation.
Optical fibers implanted in mPFC were connected to 473-nm lasers (Shanghai Laser & Optics Century Co.) controlled by a computer. Activation of ChR2-expressing axons in mPFC was achieved with brief light pulses: 0.5-s duration, 20 ms on at 30 Hz, and 15 mW of total power. Similar parameters were previously shown to elicit maximal DA release in target structures (40).
Extracellular Recordings.
Once the animals habituated to the setup, single-wire electrodes (California Fine Wire) coupled with an optic fiber were implanted in mPFC. The construct was fixed with dental acrylic, and recordings began 48 h later. Spikes were recorded with a 32-channel TDT RZ5 (Tucker–Davis Technologies), digitized at 25 kHz, and stored on a computer. Single units (examples in Fig. S2) were identified offline using principal component analysis with custom software written in MATLAB. The population responses to specific CSs (Fig. 2B) were calculated by first converting the peri-CS histogram of each single unit to a Z-score, then averaging all available units. Similarly, the response of each unit to each CS presentation (1 s before and 2 s after) was converted to a Z-score and then averaged for all recorded units (data in Fig. 2C).
Drug Infusion.
Blockade of D1/D2 receptors was done with the mice head-fixed, before each training session. A double 33-gauge cannula (PlasticOne) coupled to Hamilton syringes and a dual-syringe infusion pump (Cole–Parmer) was inserted in the guides previously placed in mPFC, extending 0.2 mm below the guides. Drugs or vehicle were injected at a rate of 0.5 μL⋅min−1, and the cannulas were left in place for an additional 2 min to allow passive diffusion before removal. Doses were 0.5 μg of SCH-23390 (D1−) and 1 μg of sulpiride (D2−) in 0.5 μL per hemisphere. In a subset of mice, a smaller dose and volume (0.2 μg of D1− or 0.5 μg of D2− in 0.2 μL per hemisphere) were tested. We observed similar results for D1− but not for D2− injections (Fig. S3). Data presented in the figures and main text were obtained with the 0.5-μL volumes. Unless stated otherwise, each injection procedure was performed twice for each mouse.
Histology.
At the end of each experiment, mice were euthanized with CO2 and brains were extracted for histological verification of viral construct expression and location of implants. Following perfusion with ice-cold 0.1 M phosphate buffer (PB; pH 7.4), brains were fixed and then stored in a 4% formaldehyde solution for 24 h before slicing and inspection under a fluorescent microscope. All mice included in the study had confirmed expression of EYFP/mCitrine and successful targeting of the implants based on the DiI staining of the tissue.
Immunohistochemistry.
Unless stated, all reagents were procured from Sigma and antibodies were purchased from Life Technologies/Invitrogen. Brain slices (50 μm thick) were washed several times in PB (0.1 M Na2HPO4, 0.1 M NaH2PO4, pH 7.4), incubated for 30 min in a blocking solution (PB containing 3% BSA, 3% donkey serum, and 0.5% Triton X-100), and left overnight with the primary antibody (goat anti-TH, 1:100 dilution) at 4 °C. The tissue was then washed with PB (three times, 10 min each) and incubated for 2 h at room temperature with the fluorescent secondary antibody (donkey anti-goat Alexa 647, 1:500 dilution in blocking solution). In the case of triple-fluorescent markers (TH stain, EYFP, and Red Retrobeads), the secondary antibody was donkey anti-goat Alexa 350 (1:500 dilution). Sections were then washed with PB, mounted on microscope slides with media containing 4′, 6-diamidino-2-phenylindole (DAPI; Vectashield Hard Set Mounting medium with DAPI, Vector Laboratories; Vectashield without DAPI staining when Alexa 350 secondary antibodies were used) and imaged with a Zeiss confocal microscope. For visual consistency, the colors in Fig. S1F were changed to: Alexa 350 (TH staining) shown in red, Red Retrobeads shown in blue.
Statistical Analysis.
Group data were tested for normality using the Lilliefors test and analyzed accordingly (t or χ2 test). For single-unit recordings, we assessed the significance of increase or decrease in firing rate in response to each CS: the average firing rate during the first 0.5 s of tone presentation was compared with the equivalent value calculated using shuffled spike times (1,000 repeats). A unit was considered as significantly modulated by CS if its average responses were higher (or lower) than 990 shuffled values.
Unless otherwise stated, data from factorial designs (time vs. experimental manipulations) were analyzed with a randomized ANOVA procedure (29). A bootstrapping method was used to calculate the F value of two-way ANOVA after randomly redistributing mice across the various groups (at least 1,000 cases). The null hypothesis was rejected if the nonrandomized F value was larger than the others in at least 95% of cases. The F values in the text are the nonrandomized results, and the P values refer to the percentage of instances where randomized F values were higher than the nonrandomized F values. We chose this method to minimize type I errors usually associated with the use of ANOVA procedures on nonnormally distributed data, as in this case (29).
Where stated, three-way ANOVA tests with between- and within-subject variables were performed in RStudio (version 0.99.467; RStudio, Inc.) using standard libraries.
Acknowledgments
We thank Prof. Yang Dan for comments on the manuscript. This work was supported by NIH Grant NS 36999, and by Grant and Chinese Academy of Sciences Strategic Priority Research Program XDB02020001.
Footnotes
The authors declare no conflict of interest.
This article contains supporting information online at www.pnas.org/lookup/suppl/doi:10.1073/pnas.1606098113/-/DCSupplemental.
References
- 1.Schultz W. Behavioral dopamine signals. Trends Neurosci. 2007;30(5):203–210. doi: 10.1016/j.tins.2007.03.007. [DOI] [PubMed] [Google Scholar]
- 2.Lapish CC, Kroener S, Durstewitz D, Lavin A, Seamans JK. The ability of the mesocortical dopamine system to operate in distinct temporal modes. Psychopharmacology (Berl) 2007;191(3):609–625. doi: 10.1007/s00213-006-0527-8. [DOI] [PMC free article] [PubMed] [Google Scholar]
- 3.Dayan P, Niv Y. Reinforcement learning: The good, the bad and the ugly. Curr Opin Neurobiol. 2008;18(2):185–196. doi: 10.1016/j.conb.2008.08.003. [DOI] [PubMed] [Google Scholar]
- 4.Berridge KC, Robinson TE, Aldridge JW. Dissecting components of reward: ‘Liking’, ‘wanting’, and learning. Curr Opin Pharmacol. 2009;9(1):65–73. doi: 10.1016/j.coph.2008.12.014. [DOI] [PMC free article] [PubMed] [Google Scholar]
- 5.Aragona BJ, et al. Regional specificity in the real-time development of phasic dopamine transmission patterns during acquisition of a cue-cocaine association in rats. Eur J Neurosci. 2009;30(10):1889–1899. doi: 10.1111/j.1460-9568.2009.07027.x. [DOI] [PMC free article] [PubMed] [Google Scholar]
- 6.Flagel SB, et al. A selective role for dopamine in stimulus-reward learning. Nature. 2011;469(7328):53–57. doi: 10.1038/nature09588. [DOI] [PMC free article] [PubMed] [Google Scholar]
- 7.Schultz W. Updating dopamine reward signals. Curr Opin Neurobiol. 2013;23(2):229–238. doi: 10.1016/j.conb.2012.11.012. [DOI] [PMC free article] [PubMed] [Google Scholar]
- 8.Tsai HC, et al. Phasic firing in dopaminergic neurons is sufficient for behavioral conditioning. Science. 2009;324(5930):1080–1084. doi: 10.1126/science.1168878. [DOI] [PMC free article] [PubMed] [Google Scholar]
- 9.Domingos AI, et al. Leptin regulates the reward value of nutrient. Nat Neurosci. 2011;14(12):1562–1568. doi: 10.1038/nn.2977. [DOI] [PMC free article] [PubMed] [Google Scholar]
- 10.Steinberg EE, et al. A causal link between prediction errors, dopamine neurons and learning. Nat Neurosci. 2013;16(7):966–973. doi: 10.1038/nn.3413. [DOI] [PMC free article] [PubMed] [Google Scholar]
- 11.Descarries L, Lemay B, Doucet G, Berger B. Regional and laminar density of the dopamine innervation in adult rat cerebral cortex. Neuroscience. 1987;21(3):807–824. doi: 10.1016/0306-4522(87)90038-8. [DOI] [PubMed] [Google Scholar]
- 12.Sesack SR, Hawrylak VA, Matus C, Guido MA, Levey AI. Dopamine axon varicosities in the prelimbic division of the rat prefrontal cortex exhibit sparse immunoreactivity for the dopamine transporter. J Neurosci. 1998;18(7):2697–2708. doi: 10.1523/JNEUROSCI.18-07-02697.1998. [DOI] [PMC free article] [PubMed] [Google Scholar]
- 13.Bassareo V, Di Chiara G. Differential influence of associative and nonassociative learning mechanisms on the responsiveness of prefrontal and accumbal dopamine transmission to food stimuli in rats fed ad libitum. J Neurosci. 1997;17(2):851–861. doi: 10.1523/JNEUROSCI.17-02-00851.1997. [DOI] [PMC free article] [PubMed] [Google Scholar]
- 14.Ahn S, Phillips AG. Dopaminergic correlates of sensory-specific satiety in the medial prefrontal cortex and nucleus accumbens of the rat. J Neurosci. 1999;19(19):RC29. doi: 10.1523/JNEUROSCI.19-19-j0003.1999. [DOI] [PMC free article] [PubMed] [Google Scholar]
- 15.Seamans JK, Yang CR. The principal features and mechanisms of dopamine modulation in the prefrontal cortex. Prog Neurobiol. 2004;74(1):1–58. doi: 10.1016/j.pneurobio.2004.05.006. [DOI] [PubMed] [Google Scholar]
- 16.Robbins TW, Roberts AC. Differential regulation of fronto-executive function by the monoamines and acetylcholine. Cereb Cortex. 2007;17(Suppl 1):i151–i160. doi: 10.1093/cercor/bhm066. [DOI] [PubMed] [Google Scholar]
- 17.Robbins TW, Arnsten AF. The neuropsychopharmacology of fronto-executive function: Monoaminergic modulation. Annu Rev Neurosci. 2009;32:267–287. doi: 10.1146/annurev.neuro.051508.135535. [DOI] [PMC free article] [PubMed] [Google Scholar]
- 18.St Onge JR, Ahn S, Phillips AG, Floresco SB. Dynamic fluctuations in dopamine efflux in the prefrontal cortex and nucleus accumbens during risk-based decision making. J Neurosci. 2012;32(47):16880–16891. doi: 10.1523/JNEUROSCI.3807-12.2012. [DOI] [PMC free article] [PubMed] [Google Scholar]
- 19.Floresco SB. Prefrontal dopamine and behavioral flexibility: Shifting from an “inverted-U” toward a family of functions. Front Neurosci. 2013;7:62. doi: 10.3389/fnins.2013.00062. [DOI] [PMC free article] [PubMed] [Google Scholar]
- 20.Cassaday HJ, Nelson AJ, Pezze MA. From attention to memory along the dorsal-ventral axis of the medial prefrontal cortex: Some methodological considerations. Front Syst Neurosci. 2014;8:160. doi: 10.3389/fnsys.2014.00160. [DOI] [PMC free article] [PubMed] [Google Scholar]
- 21.Clark KL, Noudoost B. The role of prefrontal catecholamines in attention and working memory. Front Neural Circuits. 2014;8:33. doi: 10.3389/fncir.2014.00033. [DOI] [PMC free article] [PubMed] [Google Scholar]
- 22.Lammel S, Ion DI, Roeper J, Malenka RC. Projection-specific modulation of dopamine neuron synapses by aversive and rewarding stimuli. Neuron. 2011;70(5):855–862. doi: 10.1016/j.neuron.2011.03.025. [DOI] [PMC free article] [PubMed] [Google Scholar]
- 23.Lammel S, et al. Input-specific control of reward and aversion in the ventral tegmental area. Nature. 2012;491(7423):212–217. doi: 10.1038/nature11527. [DOI] [PMC free article] [PubMed] [Google Scholar]
- 24.Walsh JJ, Han MH. The heterogeneity of ventral tegmental area neurons: Projection functions in a mood-related context. Neuroscience. 2014;282C:101–108. doi: 10.1016/j.neuroscience.2014.06.006. [DOI] [PMC free article] [PubMed] [Google Scholar]
- 25.Joseph MH, et al. Modulation of latent inhibition in the rat by altered dopamine transmission in the nucleus accumbens at the time of conditioning. Neuroscience. 2000;101(4):921–930. doi: 10.1016/s0306-4522(00)00437-1. [DOI] [PubMed] [Google Scholar]
- 26.Nelson AJ, Thur KE, Cassaday HJ. Dopamine D1 receptor involvement in latent inhibition and overshadowing. Int J Neuropsychopharmacol. 2012;15(10):1513–1523. doi: 10.1017/S1461145711001751. [DOI] [PMC free article] [PubMed] [Google Scholar]
- 27.Nelson AJ, et al. Reduced dopamine function within the medial shell of the nucleus accumbens enhances latent inhibition. Pharmacol Biochem Behav. 2011;98(1):1–7. doi: 10.1016/j.pbb.2010.11.025. [DOI] [PMC free article] [PubMed] [Google Scholar]
- 28.Nelson AJ, Thur KE, Marsden CA, Cassaday HJ. Catecholaminergic depletion within the prelimbic medial prefrontal cortex enhances latent inhibition. Neuroscience. 2010;170(1):99–106. doi: 10.1016/j.neuroscience.2010.06.066. [DOI] [PMC free article] [PubMed] [Google Scholar]
- 29.Piater JH, Cohen PR, Zhang X, Michael A. A randomized ANOVA procedure for comparing performance curves. In: Shavlik J, editor. Machine Learning: Proceedings of the Fifteenth International Conference. Morgan Kaufmann; San Francisco: 1999. pp. 430–438. [Google Scholar]
- 30.Lisman J, Grace AA, Duzel E. A neoHebbian framework for episodic memory; role of dopamine-dependent late LTP. Trends Neurosci. 2011;34(10):536–547. doi: 10.1016/j.tins.2011.07.006. [DOI] [PMC free article] [PubMed] [Google Scholar]
- 31.Otani S, Daniel H, Roisin MP, Crepel F. Dopaminergic modulation of long-term synaptic plasticity in rat prefrontal neurons. Cereb Cortex. 2003;13(11):1251–1256. doi: 10.1093/cercor/bhg092. [DOI] [PubMed] [Google Scholar]
- 32.Wolf ME, Mangiavacchi S, Sun X. Mechanisms by which dopamine receptors may influence synaptic plasticity. Ann N Y Acad Sci. 2003;1003:241–249. doi: 10.1196/annals.1300.015. [DOI] [PubMed] [Google Scholar]
- 33.Puig MV, Miller EK. The role of prefrontal dopamine D1 receptors in the neural mechanisms of associative learning. Neuron. 2012;74(5):874–886. doi: 10.1016/j.neuron.2012.04.018. [DOI] [PMC free article] [PubMed] [Google Scholar]
- 34.Gallistel CR, Fairhurst S, Balsam P. The learning curve: Implications of a quantitative analysis. Proc Natl Acad Sci USA. 2004;101(36):13124–13131. doi: 10.1073/pnas.0404965101. [DOI] [PMC free article] [PubMed] [Google Scholar]
- 35.Adamantidis AR, et al. Optogenetic interrogation of dopaminergic modulation of the multiple phases of reward-seeking behavior. J Neurosci. 2011;31(30):10829–10835. doi: 10.1523/JNEUROSCI.2246-11.2011. [DOI] [PMC free article] [PubMed] [Google Scholar]
- 36.Lammel S, et al. Diversity of transgenic mouse models for selective targeting of midbrain dopamine neurons. Neuron. 2015;85(2):429–438. doi: 10.1016/j.neuron.2014.12.036. [DOI] [PMC free article] [PubMed] [Google Scholar]
- 37.Carr DB, Sesack SR. Projections from the rat prefrontal cortex to the ventral tegmental area: Target specificity in the synaptic associations with mesoaccumbens and mesocortical neurons. J Neurosci. 2000;20(10):3864–3873. doi: 10.1523/JNEUROSCI.20-10-03864.2000. [DOI] [PMC free article] [PubMed] [Google Scholar]
- 38.Arnsten AF, Pliszka SR. Catecholamine influences on prefrontal cortical function: Relevance to treatment of attention deficit/hyperactivity disorder and related disorders. Pharmacol Biochem Behav. 2011;99(2):211–216. doi: 10.1016/j.pbb.2011.01.020. [DOI] [PMC free article] [PubMed] [Google Scholar]
- 39.Ljungberg T, Apicella P, Schultz W. Responses of monkey dopamine neurons during learning of behavioral reactions. J Neurophysiol. 1992;67(1):145–163. doi: 10.1152/jn.1992.67.1.145. [DOI] [PubMed] [Google Scholar]
- 40.Horvitz JC, Stewart T, Jacobs BL. Burst activity of ventral tegmental dopamine neurons is elicited by sensory stimuli in the awake cat. Brain Res. 1997;759(2):251–258. doi: 10.1016/s0006-8993(97)00265-5. [DOI] [PubMed] [Google Scholar]
- 41.Matsumoto M, Hikosaka O. Two types of dopamine neuron distinctly convey positive and negative motivational signals. Nature. 2009;459(7248):837–841. doi: 10.1038/nature08028. [DOI] [PMC free article] [PubMed] [Google Scholar]
- 42.Chandler DJ, Waterhouse BD, Gao WJ. New perspectives on catecholaminergic regulation of executive circuits: Evidence for independent modulation of prefrontal functions by midbrain dopaminergic and noradrenergic neurons. Front Neural Circuits. 2014;8:53. doi: 10.3389/fncir.2014.00053. [DOI] [PMC free article] [PubMed] [Google Scholar]


