Significance
Rapid response to extracellular signals is promoted by the maintenance of the transcription factor NF-κB in resting cells in a stable complex with its inhibitor IκBα. Upon receipt of a signal, IκBα is degraded, allowing NF-κB to enter the nucleus. One of the downstream genes that is frequently transcribed in response to signals is that of IκBα. Newly synthesized IκBα enters the nucleus and strips NF-κB from the DNA, terminating the signal response by an unknown mechanism. Previous experiments provided evidence for formation of a ternary complex between DNA, NF-κB, and IκBα. Here we characterize this ternary complex by NMR and cryoelectron microscopy and show that it is a feasible intermediate in the termination process.
Keywords: transcriptional activation, NMR, negative stain electron microscopy, protein–DNA complex, protein–protein complex
Abstract
The transcription factor NF-κB is used in many systems for the transduction of extracellular signals into the expression of signal-responsive genes. Published structural data explain the activation of NF-κB through degradation of its dedicated inhibitor IκBα, but the mechanism by which NF-κB–mediated signaling is turned off by its removal from the DNA in the presence of newly synthesized IκBα (termed stripping) is unknown. Previous kinetic studies showed that IκBα accelerates NF-κB dissociation from DNA, and a transient ternary complex between NF-κB, its cognate DNA sequence, and IκBα was observed. Here we structurally characterize the >100-kDa ternary complex by NMR and negative stain EM and show a modeled structure that is consistent with the measurements. These data provide a structural basis for previously unidentified insights into the molecular mechanism of stripping.
Cellular responses to extracellular signals depend on a complex array of protein–protein interactions, including signaling cascades within the cytoplasm involving different types of posttranslational modification, ultimately leading to the activation of factors that mediate transcription of the appropriate response genes. One of the best-understood signaling molecules is NF-κB, a family of inducible transcription factors that is present in almost all cell types in higher eukaryotes. Its activation through various stimuli elicits variable responses, leading to transcription of target genes necessary for the immune response, inflammation, cellular growth, differentiation, cell adhesion, and cell survival (1). In mammals, the NF-κB family comprises a set of homo- or heterodimers of five monomer units, termed RelA (also known as p65), RelB, c-Rel, p50, and p52. The most abundant and best-known NF-κB is the heterodimer of RelA and p50, present in the cytoplasm of resting cells in complex with its inhibitor IκBα, which masks the nuclear localization signal (NLS) of RelA. Upon receipt of a stimulus, a signaling cascade results in the phosphorylation, ubiquitination, and degradation of the bound IκBα; the RelA NLS is released; and the NF-κB enters the nucleus. Signal-responsive genes are regulated by the binding of NF-κB to the appropriate promoter. The activated NF-κB response is terminated through various mechanisms, including resynthesis of IκBα; the corresponding gene, nfkbia, is a strongly induced target gene of NF-κB. Newly synthesized IκBα enters the nucleus, recombines with the DNA-bound NF-κB, and the complex reverts to the resting state in the cytoplasm. The newly synthesized IκBα acts as an important component of the negative feedback loop that is one of the mechanisms for termination of NF-κB activation (2).
A number of studies have illuminated the structural basis for the protein–protein interactions that NF-κB undergoes during the activation process. The X-ray crystal structure of the complex of RelA–p50 with a cognate DNA sequence derived from the κB DNA of the intronic enhancer of the Ig light-chain gene (3) shows close contact between the DNA and the N-terminal domains of RelA and p50, whereas the C-terminal dimerization domains (DDs) make intimate contact primarily with each other. By contrast, the interaction between IκBα and the RelA–p50 heterodimer is primarily between the ankyrin repeats of IκBα and the dimerized C-terminal domains and NLS of NF-κB (4, 5). These X-ray crystal structures are consistent with a mechanism for the activation of NF-κB and its subsequent translocation to the nucleus, where the IκBα-bound NLS is released after signal-dependent degradation of IκBα by the proteasome. These studies do not illuminate the mechanism of stripping of the DNA-bound NF-κB from DNA by IκBα, which must occur for the signal-dependent gene transcription to be turned off after it is no longer needed. Previous in vitro studies have shown that the rate of removal of NF-κB from its cognate DNA is significantly enhanced in the presence of IκBα (6–8). NMR spectra of labeled IκBα in the presence of unlabeled DNA and NF-κB strongly suggested that both DNA and IκBα could interact simultaneously with NF-κB, forming a ternary complex in solution (7). In this paper, we provide unequivocal evidence from NMR studies of labeled NF-κB that a ternary complex is formed when IκBα is added to a complex of NF-κB with DNA. Negative-stain EM images confirm that the ternary complex is stable and persistent under the conditions used in the NMR experiments and are consistent with a model for the ternary complex derived from the published X-ray structures. These results provide structural insights into the process whereby IκBα facilitates dissociation of NF-κB from DNA at the conclusion of signaling.
Results
NMR Spectra of NF-κB.
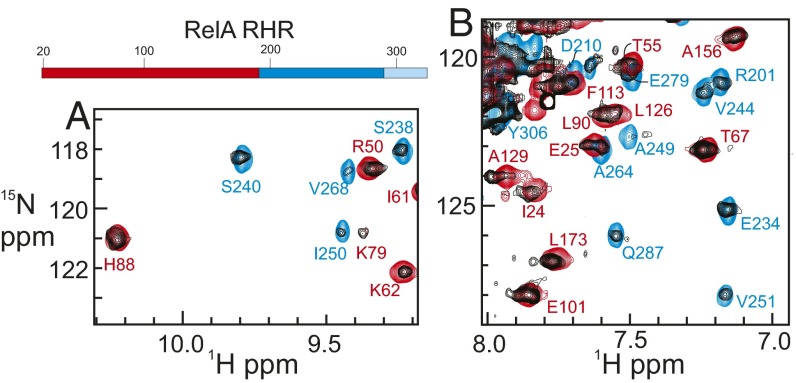
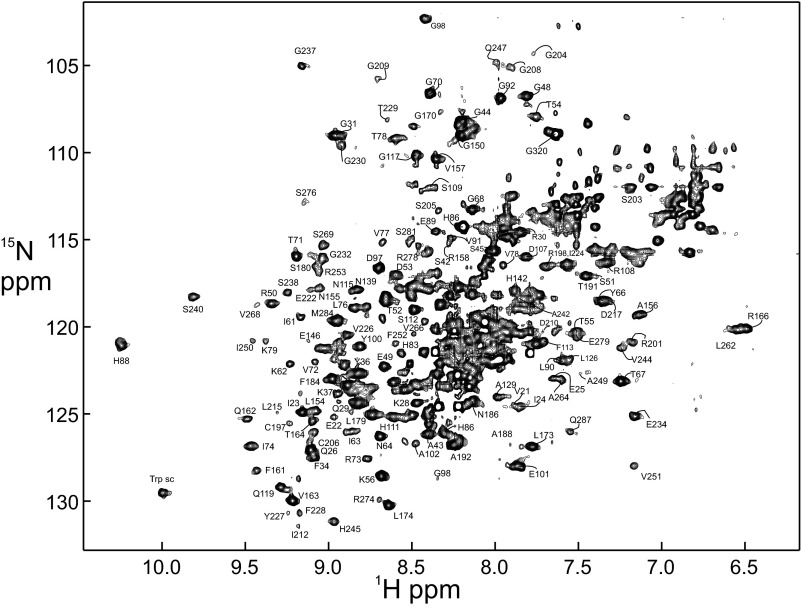
The heterodimer of the Rel-homology regions (RHRs) of RelA and p50 is quite flexible in the absence of partners such as DNA or IκBα. This is demonstrated on the one hand by the absence of any published crystallographic data on the free dimer (or on free IκBα), and on the other hand by the close correspondence between the NMR spectrum of the full-length heterodimer and those of the component domains (9). The RelA–p50 dimer is large for NMR studies (72 kDa), but we have been able to obtain NMR data, including resonance assignments, for this protein, using a combination of differential isotopic labeling and transverse relaxation-optimized spectroscopy (TROSY) (9). We chose to determine assignments for only the RelA portion of the heterodimer, simplifying the NMR spectroscopy by perdeuteration of the p50 portion. Two portions of the 1H–15N TROSY spectrum of the RelA in the heterodimer with deuterated p50 are shown in Fig. 1, together with the corresponding regions of the TROSY spectra of the DNA-binding domain (DBD) alone (red) and the DD (in complex with the deuterated DD of p50) (blue). The full spectrum of RelA in the RelA–p50 RHR (NF-κB) heterodimer with assignments is shown in Fig. S1.
Fig. 1.
(A and B) Portions of the 1H–15N TROSY spectrum of the RelA RHR in complex with perdeuterated p50 RHR (black), superimposed on the 1H–15N TROSY spectra of the RelA DBD (residues 19–191) (red) and of the RelA DD (residues 190–321) in complex with perdeuterated p50 DD (residues 245–350) (blue). Resonance assignments were obtained from the spectra of the isolated component domains (9). (Top) Schematic diagram showing regions of RelA RHR used in this work. Red, N-terminal DBD; blue, dimerization domain; light blue, NLS. The full 1H–15N HSQC spectrum is shown in Fig. S1.
Fig. S1.
1H–15N TROSY spectrum of 15N-labeled, perdeuterated RelA RHR in complex with unlabeled, perdeuterated p50 RHR. Assignments were mapped from the spectra of the individual domains (9).
NMR Analysis of Complex Formation by NF-κB.
The 15N-labeled, perdeuterated RelA RHR in complex with the perdeuterated p50 RHR gives well-dispersed TROSY NMR spectra. Addition of perdeuterated IκBα or the (nondeuterated) 18-nucleotide palindromic oligonucleotide containing the κB site (shown in bold font and underlined) (ATCTGGGAATTCCCAGAT) yields spectra of comparable quality. The quality of the spectra of the DNA complex is slightly lower than those of the binary IκBα complex, consistent with the higher proton density, which results in more rapid signal decay due to relaxation.
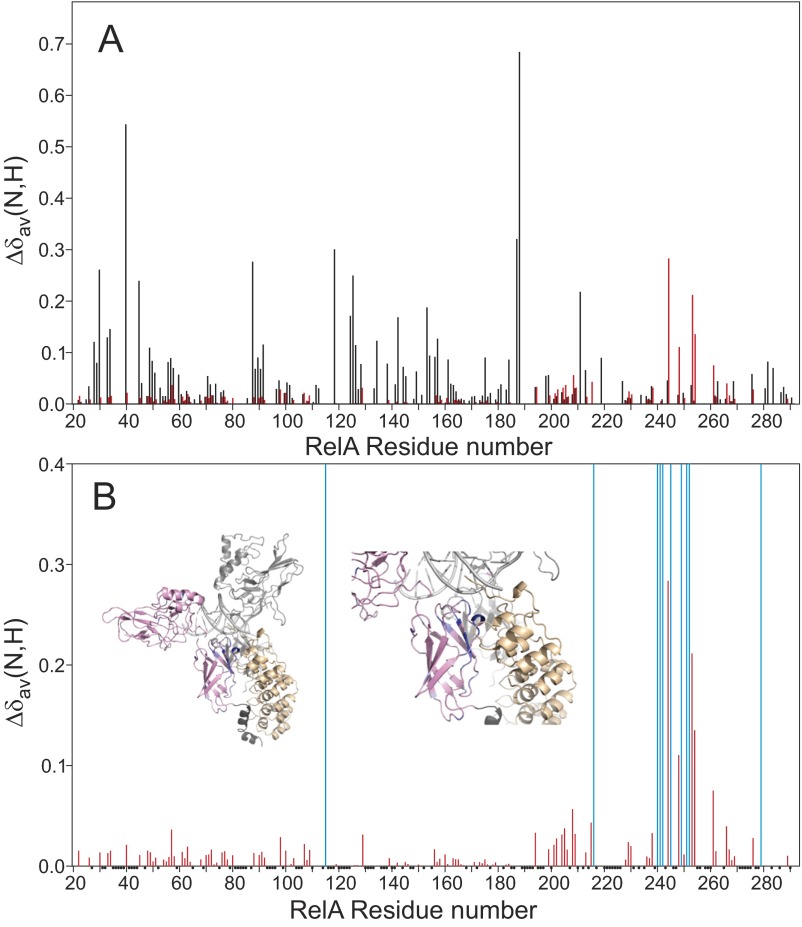
Stepwise addition of aliquots of IκBα to the NF-κB–DNA complex resulted in lowered intensity and the eventual disappearance of some of the cross-peaks. These peaks never reappeared at any of the positions that they occupy in the free, DNA-bound, or IκBα-bound forms. These observations indicate that structural and/or dynamic changes have occurred in the NF-κB–DNA complex in the presence of IκBα. The chemical shift perturbation (CSP) of cross-peaks unambiguously assigned in all of the NF-κB complexes (NF-κB–DNA, NF-κB–IκBα, and NF-κB–DNA with excess added IκBα) is shown in Fig. S2. The RelA DBD retains the same chemical shifts after the addition of excess IκBα as are observed for the NF-κB–DNA complex, whereas the DD region shows large chemical shift perturbations and resonance broadening. By contrast, the chemical shift differences between the binary NF-κB–IκBα complex and the NF-κB–DNA complex to which excess IκBα has been added show a number of perturbations in the DBD region and very little effect in the DD region. These observations are consistent with structures similar to the DNA-bound form in the DBD and to the IκBα-bound form in the DD. Chemical shifts unique to the free form of RelA (Fig. S1) were not observed in the NF-κB–DNA complex with excess IκBα.
Fig. S2.
Plots of the weighted average chemical shift differences Δδav(N,H) = √[(Δδ1H)2 + (Δδ15N/5)2] between corresponding cross-peaks in the 1H–15N TROSY spectra of binary and ternary complexes. (A) Differences between the ternary complex (NF-κB–DNA + IκBα) and the binary IκBα complex (NF-κB–IκBα) (black) and between the ternary complex and the binary DNA complex (NF-κB–DNA) (red). (B) Differences between the ternary complex (NF-κB–DNA + IκBα) and the binary DNA complex (NF-κB–DNA) (red) (same as the red data of A, with a different vertical scale) showing the location of resonance disappearance upon addition of IκBα (blue vertical bars). Small black dots at the axis denote residues for which unambiguous assignments were not available. Insets in B show a model of the ternary structure of the RelA RHR (pink) with p50 RHR (light gray) and DNA (light gray) and IκBα (yellow). The NLS is shown in dark gray at the bottom of the structure. The backbone of residues where the NH cross-peak shifts or broadens upon addition of IκBα to the NFκB–DNA complex are shown in blue.
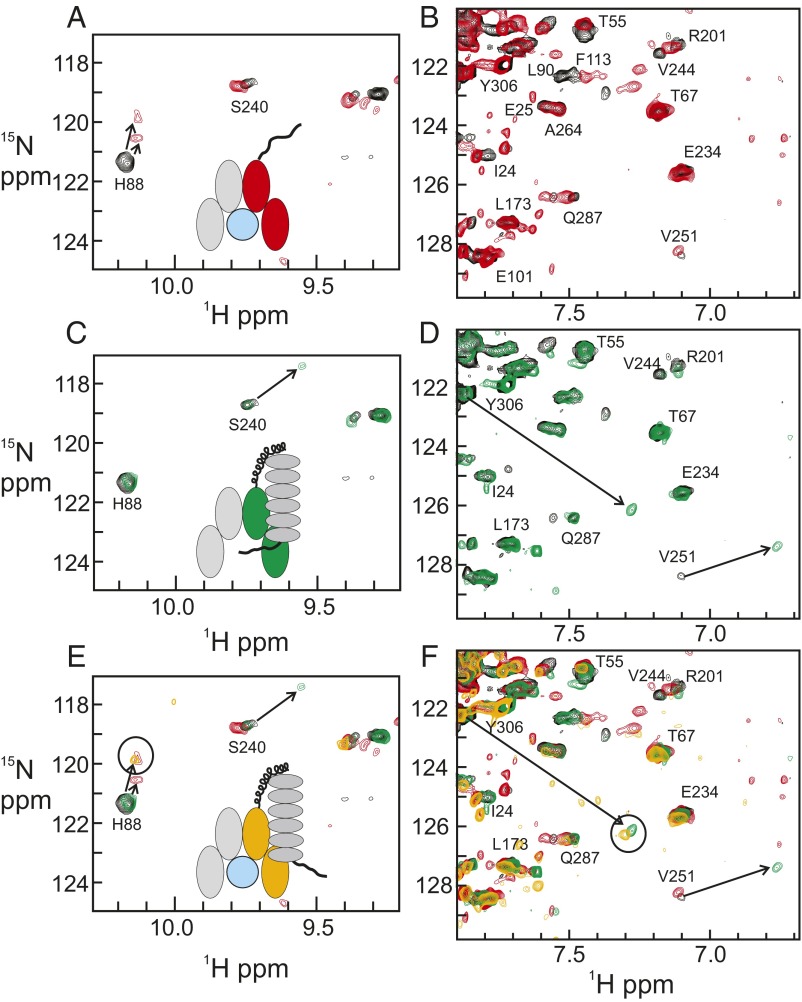
The results of the titration experiments are shown in Fig. 2. Two portions of the TROSY spectrum of free RelA–p50 RHR (black) are shown in Fig. 2 A and B superimposed with corresponding regions of NF-κB–DNA (red), and in Fig. 2 C and D superimposed with corresponding regions of NF-κB–IκBα (green). Fig. 2 E and F show these three TROSY spectra (black, red, and green) superimposed, together with the spectrum of NF-κB–DNA to which an excess amount of IκBα has been added (gold). The spectra show clear features of both DNA- and IκBα-bound NF-κB complexes. The distinctive peak for H88 reports on the interaction with DNA, because this residue is located in one of the DNA-binding loops (3). In the binary NF-κB–DNA complex, the H88 cross-peak shifts, perhaps to two new positions nearby (Fig. 2A). In the binary NF-κB–IκBα complex, the H88 cross-peak is located at the same position as in the free protein (Fig. 2C), as expected, because it is distant from the IκBα binding site. Upon addition of IκBα to the DNA complex, the cross-peak of H88 appears at one of the positions it takes up in the DNA complex, rather than at the position of the free protein (Fig. 2E). This observation indicates that the DNA remains bound to NF-κB under the conditions of the NMR experiments.
Fig. 2.
Portions of the 1H–15N TROSY spectrum of [15N, 2H] RelA RHR in complex with perdeuterated p50 RHR (black), superimposed on the 1H–15N TROSY spectra of (A and B) RelA RHR with perdeuterated p50 RHR in complex with duplex κB DNA (red); (C and D) RelA RHR with perdeuterated p50 RHR in complex with perdeuterated IκBα (residues 67–287) (green); and (E and F) RelA RHR with perdeuterated p50 RHR in complex with duplex κB DNA (red), in complex with perdeuterated IκBα (green) and in complex with duplex κB DNA, to which an equimolar amount of perdeuterated IκBα has been added (gold). Insets in A, C, and E show schematic illustrations of the components of the solution represented by the spectra of different colors.
A major proportion of the interaction surface between NF-κB and IκBα is provided by the coupled folding and binding of the RelA NLS (4, 5). Resonance assignments for the NLS region of the RelA DD in complex with deuterated p50 DD were difficult to obtain, due to the disordered nature of this region in the absence of partners (9). The positions of key residues in the NLS, in both free and IκBα-bound forms, were confirmed by residue-specific labeling (9) and by comparison with the spectrum of a peptide with sequence corresponding to that of the NLS (10). The cross-peak of Y306 reports on the interaction of the NLS with IκBα. In the free protein, the position of the Y306 cross-peak in the center of the spectrum is consistent with the disorder of the NLS sequence. In the IκBα binary complex (Fig. 2D), the cross-peak of Y306 shifts to a position that indicates that the local sequence is folded. In the spectrum of NF-κB in the presence of both DNA and IκBα, the cross-peak for Y306 appears at the same position as in the NF-κB–IκBα binary complex (Fig. 2F), indicating that the NLS is folded and thus that IκBα is present. These NMR observations are consistent with the presence of a ternary complex containing NF-κB, DNA, and IκBα.
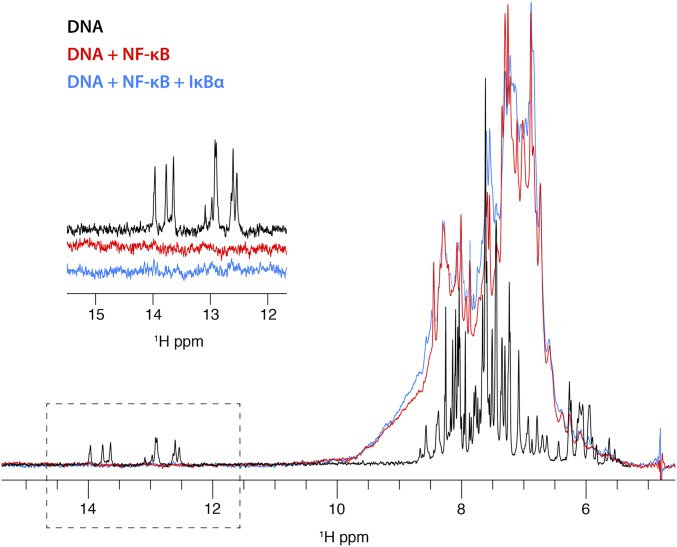
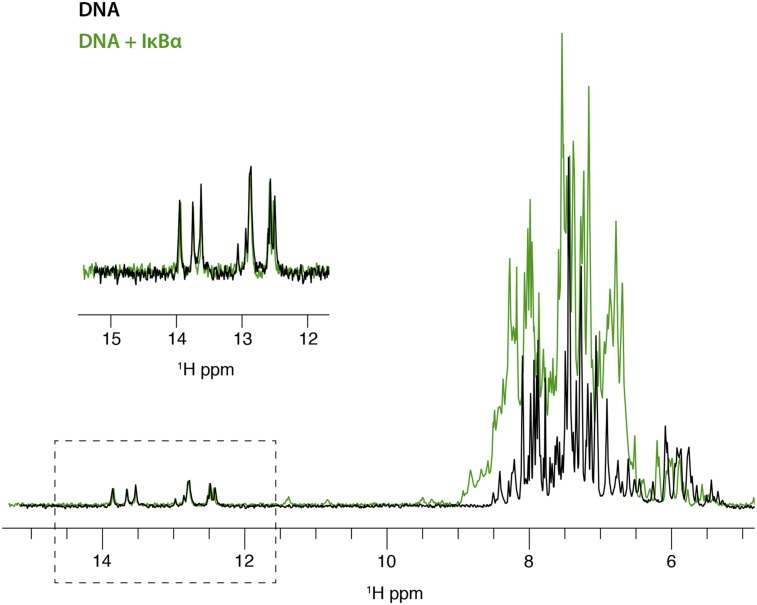
Further evidence that DNA remains in the complex is obtained from 1D 1H spectra of the duplex DNA used in these experiments. Upon addition of NF-κB, the distinctive imino proton signals in the DNA spectrum (Fig. 3) disappear, consistent with the incorporation of the DNA into a high molecular-weight complex (∼83 kDa). If the further addition of IκBα causes the DNA to dissociate from the complex, then we should observe the reappearance of the signals in the 1D spectrum. The imino signals do not reappear in the spectrum after addition of excess IκBα, indicating that the DNA remains associated with a high molecular-weight entity under these conditions. A control spectrum of DNA in the presence of equimolar IκBα (Fig. S3) shows no difference in the DNA imino region, indicating that there is no direct interaction between DNA and IκBα.
Fig. 3.
Portion of a 1D 1H spectrum of unlabeled duplex κB DNA (black) showing resonances at 12–14 ppm characteristic for hydrogen-bonded imino protons and resonances at 5–9 ppm characteristic of sugar and base protons of the DNA (the aliphatic portion of the spectrum, between 0 and 4 ppm has been omitted for clarity). Addition of perdeuterated NF-κB (red) gives a broadened spectrum representing both DNA and protein between 5 and 9 ppm, consistent with the incorporation of the DNA into an 83-kDa complex with NF-κB. The imino resonances of the DNA do not appear in this spectrum, likely due to broadening as a result of complex formation. The sharp resonances at 5.5–6 ppm in the DNA spectrum are also broadened. Further addition of IκBα to the NF-κB–DNA complex does not result in the reappearance of the imino resonances, indicating that the DNA remains part of the high molecular-weight complex instead of dissociating in the presence of IκBα.
Fig. S3.
One-dimensional 1H spectrum of unlabeled duplex κB DNA (black) and following addition of a 1:1 ratio of IκBα (green). (Inset) Hydrogen-bonded imino spectra.
Presence of a Ternary Complex by Size-Exclusion Chromatography.
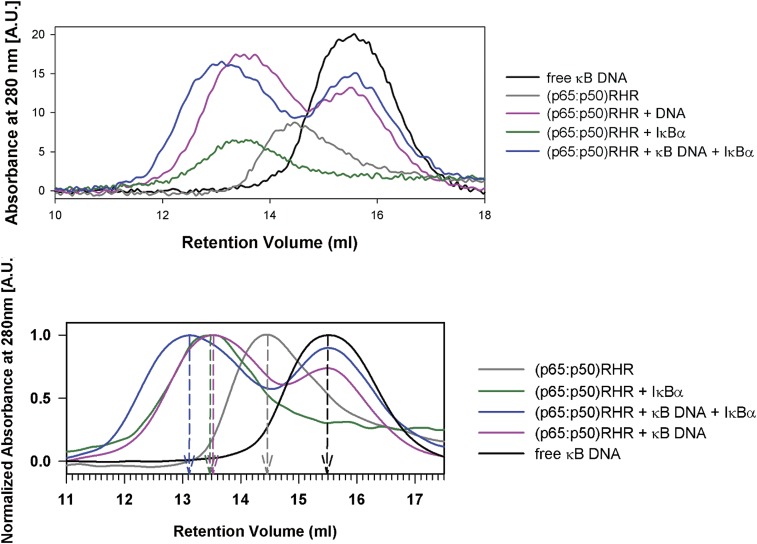
Examination of the titration samples by size exclusion chromatography (Fig. S4) showed that the two binary complexes (NF-κB–DNA and NF-κB–IκBα) are of similar molecular weight, significantly higher than free RelA–p50, and that the addition of IκBα to this complex results in a species of still higher molecular weight. It is noticeable that both binary and ternary complexes appear to contain an excess of free DNA, which likely contributes to the equilibrium stability of the ternary complex.
Fig. S4.
Traces from the elution of the components of the ternary complex from a gel filtration column. (Upper) Raw data. (Lower) Data have been smoothed and normalized.
Detection of a Ternary Complex by EM.
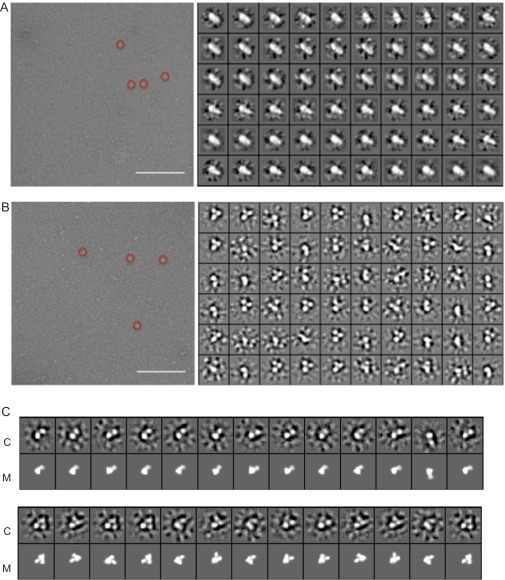
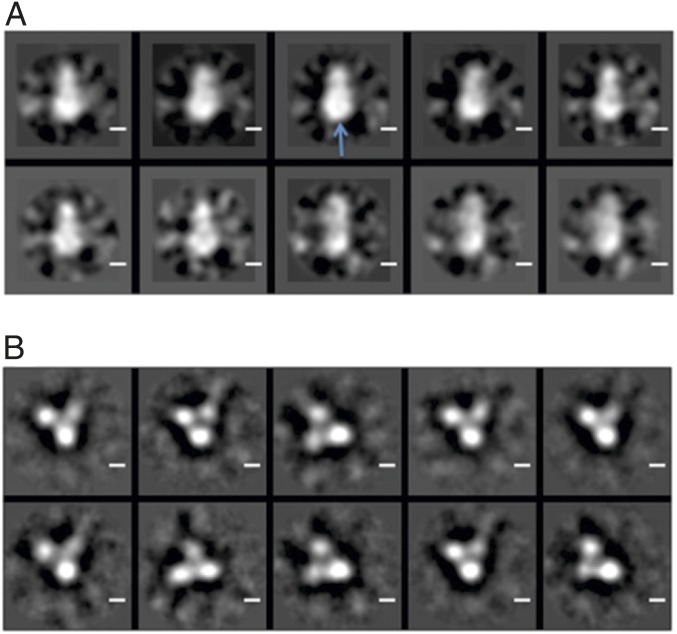
Because we were able, somewhat to our surprise, to observe evidence for a ternary complex by NMR, we inferred that the complex was persistent under our experimental conditions, rather than that the IκBα had caused the dissociation of the DNA. We reasoned that such a persistent complex should be observable by other techniques, such as EM. Samples containing equimolar amounts of NF-κB plus IκBα, representing the binary NF-κB–IκBα complex, and containing equimolar amounts of NF-κB, IκBα, and DNA, representing the putative ternary complex, were spread on grids and examined by negative staining. A selection of the raw data is shown in Fig. S5. Class averages are shown in Fig. 4A for the NF-κB/IκBα sample and Fig. 4B for the NF-κB/IκBα/DNA sample. The binary (Fig. 4A) and ternary (Fig. 4B) complexes show significant differences in shape. The binary complex has a two-lobed shape, with dimensions for the larger lobe that are approximately equal to twice the width of the RelA DBD, obtained from the crystal structures of the IκBα complex (4, 5) (the p50 DBD is not present in these structures). With DNA, IκBα, and NF-κB present, the shapes of the class averages show a mixture of two- and three-lobed shapes (Fig. S5). The three-lobed shapes likely represent a ternary complex where the positions of the p50 and RelA DBDs have been separated and fixed by the presence of the DNA, whereas the two-lobed shapes, which have a size and shape consistent with those seen in the binary complex (Fig. 4A), probably represent a population of binary complex within the solution.
Fig. S5.
(A and B) Representative negative stain electron micrographs (Left) and 60 class averages (Right) for (A) the NF-κB–IκBα binary complex and (B) the NF-κB–DNA–IκBα ternary complex. A sample of the particles picked are enclosed with a red circle. (Scale bar on each micrograph, 200 nm.) (C) Ternary complex modeled from the crystal structures 1IKN, 1NFI, and 1VKX using the program COOT (26) and shown in orientations corresponding to one- and two-lobed class averages for the ternary complex shown in B. M, model; C, class average. The comparisons of 2D class averages with projections of the 3D model were made using e2classvsproj.py in EMAN2 (27).
Fig. 4.
Typical 2D-class averages from negative-stain EM images of (A) a solution with equimolar amounts of NF-κB and IκBα and (B) a solution with equimolar amounts of NF-κB and IκBα and κB DNA. The larger density shown in A (blue arrow) has a diameter of ∼73 Å and is almost double the size of a single lobe shown in B, which has a diameter of around 40 Å.
Modeling of the Ternary Complex.
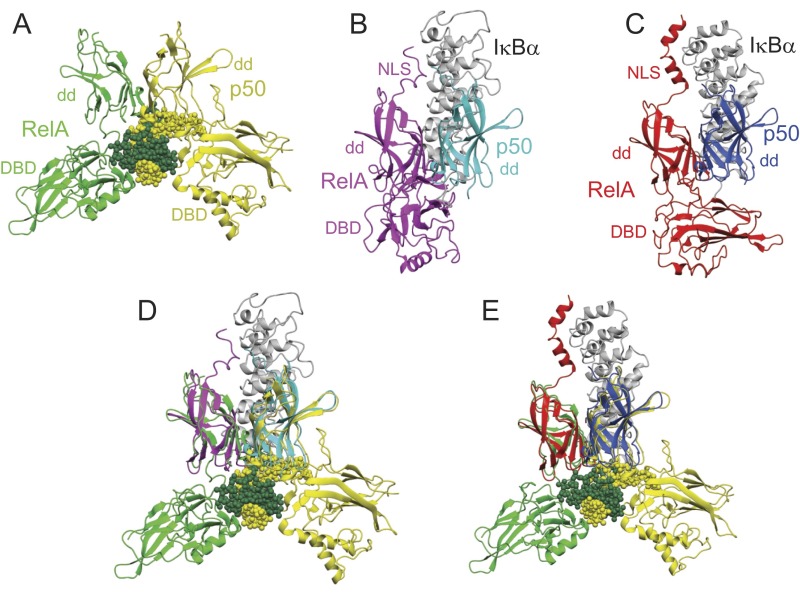
The X-ray structures of the binary DNA and IκBα complexes of RelA–p50 are shown in Fig. S6. The structure of the NLS of RelA is inconsistent between the two structures of the binary IκBα complex, and the DBD of p50 is missing from both structures. We constructed a model for the ternary complex of NF-κB, DNA, and IκBα by superimposing the dimerization domains of RelA and p50. The process is shown in Fig. S6. The resulting model (Fig. 5) is consistent with the presence of a ternary complex, in that there is very little steric clash between the structured portions of IκBα and the DNA. The PEST (rich in proline, glutamic acid, serine, and threonine) sequence at the C terminus of IκBα makes contact with the DNA-binding residues of RelA in solution (11), although its position is ambiguous in the two X-ray crystal structures. Because this region is disordered in solution, it appears likely that its flexibility would allow the DNA to be accommodated in much the same position as is seen in the binary DNA complex. Also, the addition of DNA to the IκBα complex of NF-κB specifically results in the release of the PEST sequence, while maintaining contacts between the remainder of the IκBα and the NF-κB (7). The chemical shift perturbations shown in Fig. S2, and in particular the broadening of resonances that occurs upon addition of IκBα to the NFκB–DNA complex, localize to the face of the RelA dimerization domain that makes intimate contact with IκBα in the ternary complex, providing confirmatory evidence for the validity of the structural model.
Fig. S6.
(A) X-ray crystal structure of the complex of RelA RHR (green) and p50 RHR (yellow) with the kB DNA sequence (green and yellow spheres) (3). (B) X-ray crystal structure of the complex of RelA RHR (magenta) and the dimerization domain of p50 (cyan) with IκBα (gray) (5). (C) X-ray crystal structure of the complex of RelA RHR (red) and the dimerization domain of p50 (blue) with IκBα (gray) (4). (D) Superposition of the structures in A and B on the dimerization domains of RelA and p50. (E) Superposition of the structures in A and C on the dimerization domains of RelA and p50. The figures and the superposition were made using Molmol (25).
Fig. 5.
Models for the structures of (A) the binary complex of NF-κB with IκBα and (B) the ternary complex of NF-κB with IκBα and DNA. The models are based on a superposition of the X-ray crystal structures of the DNA complex of RelA–p50 (3) and the IκBα complex of RelA–p50 (4). Figure was made using Molmol (25).
The dimensions of the modeled ternary complex were measured and compared with those of several of the three-lobed structures in the EM class averages. The distance of 100 Å from the top of the IκBα to the projection between the two DBDs at the bottom of the structure is quite consistent with the corresponding measurement in the class averages. These results are a strong indication firstly that the shape of the binary complex is quite different from that of the putative ternary complex, and secondly, that the measured dimensions of the ternary complex in the EM pictures are consistent with a plausible model of this complex derived from published X-ray data.
Discussion
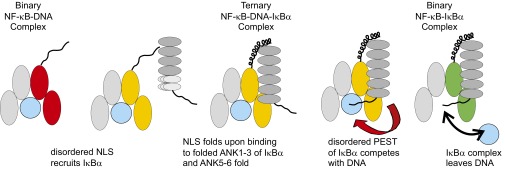
Disorder and partial order in the protein components appears to be an integral component of the mechanism of stripping of NF-κB from DNA by IκBα. Fig. 6 shows schematically how we envision this mechanism works in the nucleus of the cell. We know that in the absence of IκBα the NLS of RelA is disordered (10), and that the C terminus of IκBα shows disorder (PEST domain) and partial order (ankyrin repeats 5 and 6) (12). Ankyrin repeats 1–4 of IκBα are well ordered (13), and this is the site of interaction of the RelA NLS in the NF-κB–IκBα complex (4, 5). The first step in the stripping mechanism could therefore conceivably be recruitment of the folded ankyrin repeats 1–4 of IκBα by the disordered RelA NLS to form a ternary complex. This sequence binds to IκBα in a helical conformation even in the absence of the rest of the protein (10), and we envisage the formation of a helical structure in the IκBα-bound NLS, similar to that seen in one of the X-ray structures (4). In the second step, interaction of ankyrin repeats 4–6 with NF-κB results in the stabilization of the ANK5–6 structure (12) and brings the C-terminal region of IκBα, including the PEST sequence, into close proximity with the DNA-binding site of NF-κB. The negatively charged PEST sequence (34 residues, sequence PESEDEESYDTESEFTEDELPYDDCVFGGQRLTL) potentially competes with the DNA for the binding site on NF-κB: the PEST sequence has been shown to contact the RelA DNA-binding loops, while remaining disordered (11). Successful competition by the PEST sequence should result in the dissociation of the NF-κB–IκBα complex from the DNA. Recent modeling studies (14) show that the PEST can adopt alternative conformations, both inside and outside the DNA binding cavity, allowing for the accommodation of the DNA in the ternary complex as well as for competition that results in the dissociation of the DNA.
Fig. 6.
Schematic mechanism for the stripping of NF-κB from DNA by IκBα. The disordered NLS of RelA recruits the structured ANK1–4 domains of IκBα, the molten-globule ANK5 sixfold upon interaction with NF-κB, forming the ternary complex and bringing the PEST sequence close to the DBD. Competition by the negatively charged PEST sequence for the DNA binding site of NF-κB leads to dissociation of the NF-κB–IκBα complex, which returns to its resting state in the cytoplasm.
The NMR and EM results are consistent with the presence of a ternary complex when IκBα is added to the NF-κB–DNA complex. Such a complex was also observed when excess DNA is added to a complex of NF-κB and IκBα (7), but because of the preparation method (the reverse of what is presumed to occur in nature as IκBα strips NF-κB from DNA), we reasoned that the addition of the reagents in the correct order might give important insights into the process. NF-κB has an intrinsically higher affinity for IκBα than for DNA, so we expected the addition of IκBα to result in dissociation of the DNA from the NF-κB–DNA complex. Instead, we observe that both DNA and IκBα remain attached to NF-κB, forming a ternary complex. Further, stopped-flow fluorescence measurements show that the dissociation of DNA from NF-κB is accelerated in the presence of IκBα (6–8). The major reason for the persistence of the ternary complex is likely to be the concentrations of the macromolecular components present in the NMR (and EM) experiments, which are much larger than those in the stopped-flow fluorescence experiments. As explained previously (7), the dissociation constant for the binary complex between DNA and NF-κB is 6 nM, whereas that for the ternary complex is 56 nM, which explains, for example, why the ternary complex was never observed in gel-shift assays. At NMR concentrations, ∼100 μM, the formation of the ternary complex should be observable if the binding constant is tighter than 100 nM. The fluorescence kinetics were measured at concentrations of 0.25–1.5 μM, using an excess of protein (7). Under these conditions, the acceleration of the dissociation rate of DNA by the addition of IκBα is also consistent with the relative affinities of the binary and ternary complexes. Further, our calculations indicate that there is a slight excess of DNA in the NMR and EM samples (Fig. S4), which would further tend to stabilize a ternary interaction despite the greater affinity of the IκBα for the NF-κB compared with that of DNA.
Our experimental conditions in vitro are also widely different from those in the nucleus in vivo. A major factor affecting the persistence of the ternary complex must be the difference in the relative concentrations of the components in the NMR and EM experiments, compared with that in the cell. Also, IκBα and NF-κB are not the only biological macromolecules in the vicinity of the κB site. Many competing interactions including posttranslational modifications (PTMs) of NF-κB occur throughout the transcription process. It is likely that competing interactions and/or PTMs will contribute to the dissociation of NF-κB from the κB site. In this context, our observations may have particular relevance to the situation in vivo: what we see in the formation of the ternary complex is a weakening of the NF-κB–DNA interaction, specifically mediated by the presence of an electrostatic competitor in close proximity. Together with the extremely low dissociation rate of IκBα from NF-κB (amounting to irreversible binding for this complex) (8), the weakening of the NF-κB–DNA interaction and the increase in the exchange rate of the NF-κB on and off the DNA may be all that is needed for successful replacement of NF-κB on the promoter site by a competing factor present in the local environment.
Methods
Protein Expression and Purification.
Proteins were prepared as previously described (9, 15). All proteins used for the NMR experiments [RelA RHR (residues 19–325), p50 RHR (37–363), IκBα (67–287)] were perdeuterated. RelA RHR was isotopically labeled with 15N as previously described (9) in D2O M9 minimal medium supplemented with 15NH4Cl (1 g/L). The p50 RHR was expressed separately in D2O minimal medium with 14NH4Cl. The crude cell lysates were mixed in H2O before purification, allowing back exchange of the 15N-attached protons, and the purified heterodimer was exchanged into NMR buffer (20 mM deuterated Tris, pH 6.8, 50 mM NaCl, 2 mM deuterated DTT and 10% vol/vol D2O) for NMR spectroscopy.
Preparation of DNA.
An 18-nucleotide palindromic oligonucleotide containing the κB site (ATCTGGGAATTCCCAGAT) was commercially synthesized. The 10-bp κB site sequence (underlined) belongs to the Col7A1 promoter, which is specific for the RelA:p50 heterodimer (16). The single-stranded oligonucleotide was purified with a Q-Sepharose column using a gradient of 0.1–1 M NaOH. The pooled fractions of interest adjusted to pH 5.8 using 1 M 2-(N-morpholino) ethanesulfonic acid buffer followed by thorough buffer exchange with water followed by concentration. Duplex DNA for NMR experiments was prepared through self-annealing of the single stranded DNA by heating at 95 °C followed by gradual cooling to room temperature in annealing buffer (5 mM deuterated Tris pH 8.0, 100 mM NaCl).
NMR Experiments.
All of the 2D NMR spectra shown are clean-TROSY 1H–15N heteronuclear single quantum coherence (HSQC) spectra (17) obtained with nonuniform sampling (9, 18), recorded on Bruker spectrometers at 800 MHz (with cryoprobe) or 900 MHz. One-dimensional Watergate experiments were used to obtain the DNA 1H spectra. Data were analyzed using NMRPipe (19), NMRView (20), and CARA (21).
For assignment of the NF-κB–DNA (RelA–p50 RHR–DNA) and NF-κB–IκBα (RelA–p50 RHR–IκBα) complexes we used the same strategy of assignment transfer as for the free NF-κB protein (9). Assignments for the complex of the RelA DBD in complex with DNA were transferred to the spectra of NF-κB–DNA complex. Similarly, assignments for the complex of the RelA DD with deuterated p50 DD and IκBα were transferred to the NF-κB–IκBα complex. Because of resonance overlap and broadening of signals in the complexes of the full-length RHR of RelA, complete assignments could not be obtained. However, the available unambiguous assignments provided 164 probes for structural characterization of the stripping mechanism (Fig. S2).
For the titration experiment five identical samples of 64-μM–labeled NF-κB ([15N, 2H] RelA RHR-[2H] p50 RHR) were made. One of the samples was used for obtaining the [15N, 1H]-TROSY-HSQC spectra of the free NF-κB heterodimer protein. To another sample [2H]-IκBα from a stock of 0.25 mM was added such that the NF-κB:IκBα was in the final ratio of 1:4. The remaining three labeled NF-κB samples were pooled together and titrated with DNA with monitoring the imino region of DNA by recording 1D 1H spectra. DNA was added until sharp imino peaks from the excess free DNA were observed. The final protein:DNA ratio was maintained to 1:3. This NF-κB–DNA complex was used for the IκBα titration experiment. The NF-κB–DNA sample was further divided into three samples of 200 μL each. Different aliquots of 0.25 mM partially deuterated IκBα were added to the NF-κB–DNA complex such that the final NF-κB–DNA:IκBα ratio is 1:1, 1:3, and 1:4. The concentration of all of the samples was maintained around 29 μM of NF-κB with appropriate dilution with NMR buffer. [15N, 1H]-TROSY-HSQC were recorded with nonuniform sampling.
Size Exclusion Chromatography.
The NMR samples used for the IκBα titration experiment were directly loaded onto a Superdex G-200 analytical column (GE) in gel filtration buffer (20 mM Tris, pH 6.8, 50 mM NaCl, and 2 mM DTT) connected to the ÄKTApurifier. In addition, a free DNA sample was also loaded to study the elution profile of the free DNA.
EM Specimen Preparation.
Protein samples under identical solution conditions to those used for the NMR experiments (20 mM Tris, pH 6.8, 50 mM NaCl, 2 mM DTT) were added to previously glow-discharged continuous carbon grids. The grids were blotted and subsequently passed through four 40-μL drops of 1% uranyl formate. Excess uranyl formate was blotted away and the grids were allowed to dry.
EM Imaging and Analysis.
Images were acquired with a Tecnai TF20 electron microscope operating at 200 keV with a dose near 20 e−/Å2 and a range of 1.0–2.4 μm underfocus. Automated data collection was performed with Leginon (22) using a Gatan CCD. Migrographs, 4096 × 4096, were acquired at nominal magnification of 50,000× (pixel size of 0.183 nm). Particles were picked from micrographs using the program Difference of Gaussian Picker (DoG) (23). NF-κB plus DNA samples had 23,141 particles picked, whereas NF-κB without DNA resulted in 9,570 initial particles. All particles were iteratively aligned and classified reference-free using IMAGIC MSA/MRA (24), removing poorly aligned particles with each round. This resulted in a final stack size of 10,997 and 3,644 particles for NF-κB with and without DNA, respectively.
Modeling of the Ternary Complex.
The ternary complex was modeled using MolMol (25) to superimpose the coordinates of the RelA and p50 dimerization domains in the X-ray crystal structures of the binary NF-κB–DNA complex (1VKX) (3) and each of the two binary NF-κB–IκBα structures [1NFI (4) and 1IKN (5), as shown in Fig. S6].
Acknowledgments
We thank Maria Martinez-Yamout and Euvel Manlapaz for helpful discussions on the preparation of proteins; Gerard Kroon and Phillip Aoto for help with NMR experiments; Peter Wright and members of the Wright and H.J.D. groups for helpful discussions; and Holly Dembinski and Kristen Ramsey for preparing the protein samples for the EM experiments. This work was supported by NIH Grant GM71862 (to E.A.K. and H.J.D.) and Ruth L. Kirschstein National Research Service Award 5F32GM108310-02 (to R.M.).
Footnotes
The authors declare no conflict of interest.
This article is a PNAS Direct Submission.
This article contains supporting information online at www.pnas.org/lookup/suppl/doi:10.1073/pnas.1603488113/-/DCSupplemental.
References
- 1.Hayden MS, Ghosh S. NF-κB, the first quarter-century: Remarkable progress and outstanding questions. Genes Dev. 2012;26(3):203–234. doi: 10.1101/gad.183434.111. [DOI] [PMC free article] [PubMed] [Google Scholar]
- 2.Hoffmann A, Levchenko A, Scott ML, Baltimore D. The IkappaB-NF-kappaB signaling module: Temporal control and selective gene activation. Science. 2002;298(5596):1241–1245. doi: 10.1126/science.1071914. [DOI] [PubMed] [Google Scholar]
- 3.Chen FE, Huang DB, Chen YQ, Ghosh G. Crystal structure of p50/p65 heterodimer of transcription factor NF-kappaB bound to DNA. Nature. 1998;391(6665):410–413. doi: 10.1038/34956. [DOI] [PubMed] [Google Scholar]
- 4.Jacobs MD, Harrison SC. Structure of an IkappaBalpha/NF-kappaB complex. Cell. 1998;95(6):749–758. doi: 10.1016/s0092-8674(00)81698-0. [DOI] [PubMed] [Google Scholar]
- 5.Huxford T, Huang DB, Malek S, Ghosh G. The crystal structure of the IkappaBalpha/NF-kappaB complex reveals mechanisms of NF-kappaB inactivation. Cell. 1998;95(6):759–770. doi: 10.1016/s0092-8674(00)81699-2. [DOI] [PubMed] [Google Scholar]
- 6.Bergqvist S, et al. Kinetic enhancement of NF-kappaBxDNA dissociation by IkappaBalpha. Proc Natl Acad Sci USA. 2009;106(46):19328–19333. doi: 10.1073/pnas.0908797106. [DOI] [PMC free article] [PubMed] [Google Scholar]
- 7.Sue SC, Alverdi V, Komives EA, Dyson HJ. Detection of a ternary complex of NF-kappaB and IkappaBalpha with DNA provides insights into how IkappaBalpha removes NF-kappaB from transcription sites. Proc Natl Acad Sci USA. 2011;108(4):1367–1372. doi: 10.1073/pnas.1014323108. [DOI] [PMC free article] [PubMed] [Google Scholar]
- 8.Alverdi V, Hetrick B, Joseph S, Komives EA. Direct observation of a transient ternary complex during IκBα-mediated dissociation of NF-κB from DNA. Proc Natl Acad Sci USA. 2014;111(1):225–230. doi: 10.1073/pnas.1318115111. [DOI] [PMC free article] [PubMed] [Google Scholar]
- 9.Mukherjee SP, Borin B, Quintas PO, Dyson HJ. NMR characterization of a 72 kDa transcription factor using differential isotopic labeling. Protein Sci. 2016;25(3):597–604. doi: 10.1002/pro.2853. [DOI] [PMC free article] [PubMed] [Google Scholar]
- 10.Cervantes CF, et al. The RelA nuclear localization signal folds upon binding to IκBα. J Mol Biol. 2011;405(3):754–764. doi: 10.1016/j.jmb.2010.10.055. [DOI] [PMC free article] [PubMed] [Google Scholar]
- 11.Sue SC, Dyson HJ. Interaction of the IkappaBalpha C-terminal PEST sequence with NF-kappaB: Insights into the inhibition of NF-kappaB DNA binding by IkappaBalpha. J Mol Biol. 2009;388(4):824–838. doi: 10.1016/j.jmb.2009.03.048. [DOI] [PMC free article] [PubMed] [Google Scholar]
- 12.Sue SC, Cervantes C, Komives EA, Dyson HJ. Transfer of flexibility between ankyrin repeats in IkappaB* upon formation of the NF-kappaB complex. J Mol Biol. 2008;380(5):917–931. doi: 10.1016/j.jmb.2008.05.048. [DOI] [PMC free article] [PubMed] [Google Scholar]
- 13.Truhlar SM, Torpey JW, Komives EA. Regions of IkappaBalpha that are critical for its inhibition of NF-kappaB.DNA interaction fold upon binding to NF-kappaB. Proc Natl Acad Sci USA. 2006;103(50):18951–18956. doi: 10.1073/pnas.0605794103. [DOI] [PMC free article] [PubMed] [Google Scholar]
- 14.Potoyan DA, Zheng W, Komives EA, Wolynes PG. Molecular stripping in the NF-κB/IκB/DNA genetic regulatory network. Proc Natl Acad Sci USA. 2016;113(1):110–115. doi: 10.1073/pnas.1520483112. [DOI] [PMC free article] [PubMed] [Google Scholar]
- 15.Croy CH, Bergqvist S, Huxford T, Ghosh G, Komives EA. Biophysical characterization of the free IkappaBalpha ankyrin repeat domain in solution. Protein Sci. 2004;13(7):1767–1777. doi: 10.1110/ps.04731004. [DOI] [PMC free article] [PubMed] [Google Scholar]
- 16.Siggers T, et al. Principles of dimer-specific gene regulation revealed by a comprehensive characterization of NF-κB family DNA binding. Nat Immunol. 2011;13(1):95–102. doi: 10.1038/ni.2151. [DOI] [PMC free article] [PubMed] [Google Scholar]
- 17.Schulte-Herbrüggen T, Sørensen OW. Clean TROSY: Compensation for relaxation-induced artifacts. J Magn Reson. 2000;144(1):123–128. doi: 10.1006/jmre.2000.2020. [DOI] [PubMed] [Google Scholar]
- 18.Aoto PC, Fenwick RB, Kroon GJA, Wright PE. Accurate scoring of non-uniform sampling schemes for quantitative NMR. J Magn Reson. 2014;246(0):31–35. doi: 10.1016/j.jmr.2014.06.020. [DOI] [PMC free article] [PubMed] [Google Scholar]
- 19.Delaglio F, et al. NMRPipe: A multidimensional spectral processing system based on UNIX pipes. J Biomol NMR. 1995;6(3):277–293. doi: 10.1007/BF00197809. [DOI] [PubMed] [Google Scholar]
- 20.Johnson BA, Blevins RA. NMR View: A computer program for the visualization and analysis of NMR data. J Biomol NMR. 1994;4(5):603–614. doi: 10.1007/BF00404272. [DOI] [PubMed] [Google Scholar]
- 21.Keller RLJ. 2005. Optimizing the process of NMR spectrum analysis and computer aided resonance assignment. PhD dissertation (Eidgenossische Technische Hochschule, Zurich)
- 22.Suloway C, et al. Automated molecular microscopy: The new Leginon system. J Struct Biol. 2005;151(1):41–60. doi: 10.1016/j.jsb.2005.03.010. [DOI] [PubMed] [Google Scholar]
- 23.Voss NR, Yoshioka CK, Radermacher M, Potter CS, Carragher B. DoG Picker and TiltPicker: Software tools to facilitate particle selection in single particle electron microscopy. J Struct Biol. 2009;166(2):205–213. doi: 10.1016/j.jsb.2009.01.004. [DOI] [PMC free article] [PubMed] [Google Scholar]
- 24.Ogura T, Iwasaki K, Sato C. Topology representing network enables highly accurate classification of protein images taken by cryo electron-microscope without masking. J Struct Biol. 2003;143(3):185–200. doi: 10.1016/j.jsb.2003.08.005. [DOI] [PubMed] [Google Scholar]
- 25.Koradi R, Billeter M, Wüthrich K. MOLMOL: A program for display and analysis of macromolecular structures. J Mol Graph. 1996;14(1):51–55, 29–32. doi: 10.1016/0263-7855(96)00009-4. [DOI] [PubMed] [Google Scholar]
- 26.Emsley P, Cowtan K. Coot: Model-building tools for molecular graphics. Acta Crystallogr D Biol Crystallogr. 2004;60(Pt 12 Pt 1):2126–2132. doi: 10.1107/S0907444904019158. [DOI] [PubMed] [Google Scholar]
- 27.Tang G, et al. EMAN2: An extensible image processing suite for electron microscopy. J Struct Biol. 2007;157(1):38–46. doi: 10.1016/j.jsb.2006.05.009. [DOI] [PubMed] [Google Scholar]


