Significance
The results of the recent clinical trials, ChemoHormonal Therapy Versus Androgen Ablation Randomized Trial for Extensive Disease in Prostate Cancer (CHAARTED) and Systemic Therapy in Advanced or Metastatic Prostate Cancer: Evaluation of Drug Efficacy (STAMPEDE), suggest a significant contribution of androgen receptor signaling to sensitivity of docetaxel in prostate cancer. This study provides evidence that KDM5D (lysine-specific demethylase 5D) encoded on the Y chromosome plays an important role in docetaxel sensitivity by interacting with androgen receptor signaling, and that its expression level is associated with clinical outcomes. These data start to elucidate the biological underpinnings for the findings from these clinical trials.
Keywords: prostate cancer, docetaxel, KDM5D, JARID1D, androgen receptor
Abstract
The androgen receptor (AR) plays an essential role in prostate cancer, and suppression of its signaling with androgen deprivation therapy (ADT) has been the mainstay of treatment for metastatic hormone-sensitive prostate cancer for more than 70 y. Chemotherapy has been reserved for metastatic castration-resistant prostate cancer (mCRPC). The Eastern Cooperative Oncology Group-led trial E3805: ChemoHormonal Therapy Versus Androgen Ablation Randomized Trial for Extensive Disease in Prostate Cancer (CHAARTED) showed that the addition of docetaxel to ADT prolonged overall survival compared with ADT alone in patients with metastatic hormone-sensitive prostate cancer. This finding suggests that there is an interaction between AR signaling activity and docetaxel sensitivity. Here we demonstrate that the prostate cancer cell lines LNCaP and LAPC4 display markedly different sensitivity to docetaxel with AR activation, and RNA-seq analysis of these cell lines identified KDM5D (lysine-specific demethylase 5D) encoded on the Y chromosome as a potential mediator of this sensitivity. Knocking down KDM5D expression in LNCaP leads to docetaxel resistance in the presence of dihydrotestosterone. KDM5D physically interacts with AR in the nucleus, and regulates its transcriptional activity by demethylating H3K4me3 active transcriptional marks. Attenuating KDM5D expression dysregulates AR signaling, resulting in docetaxel insensitivity. KDM5D deletion was also observed in the LNCaP-derived CRPC cell line 104R2, which displayed docetaxel insensitivity with AR activation, unlike parental LNCaP. Dataset analysis from the Oncomine database revealed significantly decreased KDM5D expression in CRPC and poorer prognosis with low KDM5D expression. Taking these data together, this work indicates that KDM5D modulates the AR axis and that this is associated with altered docetaxel sensitivity.
Docetaxel has been an important treatment option for patients with metastatic castration-resistant prostate cancer (mCRPC) since 2004, when phase 3 trials demonstrated a 2- to 3-mo prolongation of overall survival (OS) compared with mitoxantrone and prednisone (1, 2). However, nearly all CRPC patients treated with docetaxel eventually become refractory, due to the development of drug resistance. In 2014, the Eastern Cooperative Oncology Group-led trial E3805: ChemoHormonal Therapy Versus Androgen Ablation Randomized Trial for Extensive Disease in Prostate Cancer (CHAARTED) showed that docetaxel given at the time of androgen deprivation therapy (ADT) initiation for metastatic hormone-sensitive prostate cancer (mHSPC) improved OS by 13 mo from 44 to 57 mo (3). These findings were confirmed in 2015 by the Systemic Therapy in Advanced or Metastatic Prostate Cancer: Evaluation of Drug Efficacy (STAMPEDE) trial (4). However, it still remains unclear why docetaxel deployed with concurrent androgen receptor (AR) inhibition for mHSPC improves OS dramatically more than for CRPC.
A recent study revealed a high frequency of AR signaling alterations in CRPC compared with primary HSPC, indicating the existence of AR reprogramming in CRPC (5). In this study, we hypothesized that modulation of AR signaling at the time of ADT initiation in mHSPC may enhance the efficacy of docetaxel in some patients, and that AR reprogramming in CRPC may subsequently influence the sensitivity of prostate cancer cells to docetaxel. We identified KDM5D (lysine-specific demethylase 5D; JARID1D), which is encoded on the Y chromosome, as a determinant of docetaxel sensitivity through its interaction with AR signaling in prostate cancer cells.
Results
AR Signaling Impacts Docetaxel Sensitivity in a Cell Line-Dependent Manner.
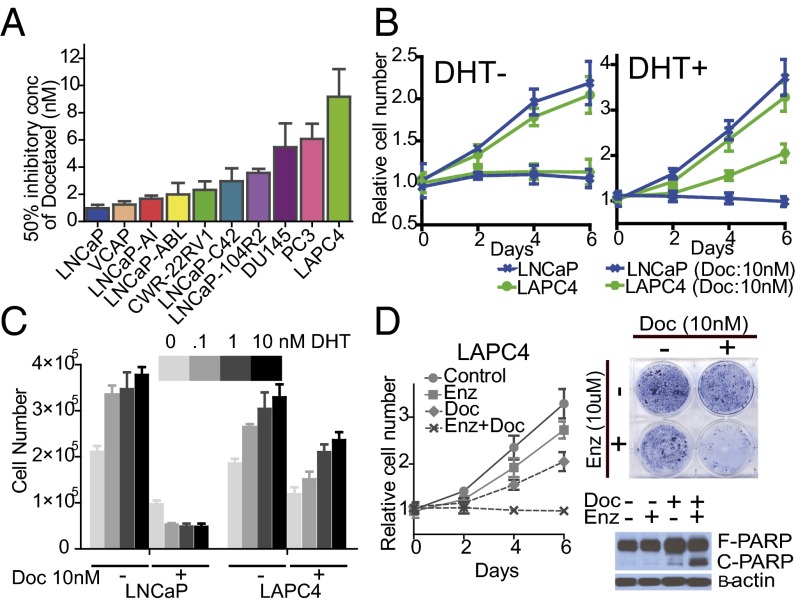
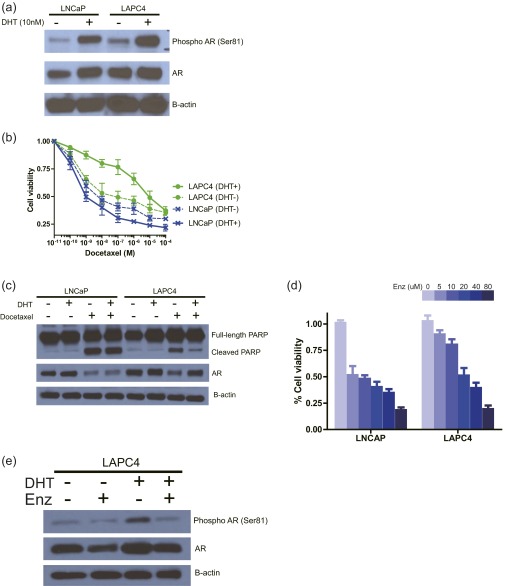
To interrogate the sensitivity of docetaxel in prostate cancer cells, we first examined cell growth with exposure to docetaxel in a panel of prostate cancer cell lines (Fig. 1A). The hormone-sensitive AR-positive prostate cancer cell lines LNCaP and LAPC4 were further analyzed because they displayed markedly different docetaxel sensitivities in 10% FBS medium. The GI50 (concentration of docetaxel necessary for 50% maximal inhibition of cell proliferation) of LAPC4 (9.17 ± 2.04 nM) was approximately ninefold higher than that of LNCaP (0.98 ± 0.24 nM). Notably, despite AR stimulation in both cell lines, confirmed by examining phosphorylated AR (Fig. S1A), the docetaxel sensitivity of these two cell lines was markedly different after exposure to dihydrotestosterone (DHT); the addition of DHT desensitized LAPC4 to docetaxel treatment (GI50 increased by ∼100-fold) but not LNCaP (Fig. 1B and Fig. S1B), and the impact of DHT treatment on the docetaxel sensitivity of LAPC4 was dose-dependent (Fig. 1C). We also confirmed that DHT treatment of LAPC4 inhibited docetaxel-induced apoptosis, resulting in the reduced effect on cell proliferation, whereas docetaxel-induced poly(ADP-ribose) polymerase (PARP) cleavage was prominent in LNCaP regardless of DHT induction (Fig. S1C). We therefore hypothesized that a careful comparison of these cell lines in the presence and absence of DHT would create an excellent model to understand the molecular underpinnings of the widely divergent sensitivities of HSPC and CRPC to docetaxel.
Fig. 1.
AR signaling impacts docetaxel sensitivity in a cell line-dependent manner. (A) Cells were cultured in 10% FBS media treated with different concentrations of docetaxel. GI50 of docetaxel was determined after 6 d of treatment. Results are expressed as mean ± SEM. (B) Cell growth of LNCaP and LAPC4 treated with and without 10 nM docetaxel in either 10% charcoal-stripped serum (CSS) media (Left) or 10% CSS with 10 nM DHT (Right) culture condition. Results are presented as relative values (mean ± SEM). (C) 1 × 10⁵ cells were plated on a six-well plate in 10% CSS media supplemented with the DHT concentrations as indicated. Cells were counted 6 d after treatment with and without 10 nM docetaxel in LNCaP and LAPC4 cell lines. Results are representative of three independent experiments (mean ± SEM). (D, Left) LAPC4 cells were treated with either or both 10 nM docetaxel and 10 μM enzalutamide in 10% CSS media supplemented with 10 nM DHT for 6 d. Results are presented as relative values (mean ± SEM). (D, Right Upper) Clonogenic survival assays in which 1 × 10⁴ LAPC4 cells were plated in a six-well plate and treated as indicated for 20 d. (D, Right Lower) LAPC4 cells were treated with either or both 10 μM enzalutamide and 10 nM docetaxel in 10% CSS media supplemented with 10 nM DHT for 48 h. Whole-cell lysates were collected and subjected to immunoblotting with the indicated antibodies.
Fig. S1.
(A) LNCaP and LAPC4 cells were cultured with and without 10 nM DHT in 10% CSS media. Twenty-four hours after DHT induction, whole-cell lysates were collected and subjected to immunoblotting with the indicated antibodies. (B) LNCaP and LAPC4 cells were treated with the indicated concentrations of docetaxel in 10% CSS media with and without 10 nM DHT for 6 d. The inhibitory effect on cell growth by docetaxel is presented as a relative value (mean ± SEM) compared with control as 100%. (C) LNCaP and LAPC4 cells were treated with and without 10 nM docetaxel in 10% CSS media with and without 10 nM DHT. After 48-h treatment, whole-cell lysates were collected and subjected to immunoblotting with the indicated antibodies. (D) Cells were treated with the indicated concentrations of enzalutamide in 10% CSS media supplemented with 10 nM DHT for 96 h. The inhibitory effect on cell growth is presented as a relative value (mean ± SEM) compared with control as 100%. (E) LAPC4 cells were treated with and without 10 μM enzalutamide in 10% CSS media with and without 10 nM DHT. After 24-h treatment, whole-cell lysates were collected and subjected to immunoblotting with the indicated antibodies.
To demonstrate that the DHT-induced docetaxel resistance in LAPC4 is mediated by AR signaling, we examined whether blocking AR activity in LAPC4 by enzalutamide, an AR antagonist, could inhibit DHT-induced docetaxel insensitivity. Despite the presence of a physiologically high concentration of docetaxel (10 nM) (6), LAPC4 cells proliferated with DHT stimulation. Enzalutamide treatment abolished DHT-induced AR activation (Fig. S1 D and E) and resensitized the cells to docetaxel in the presence of DHT (Fig. 1D), suggesting that the involvement of AR signaling in DHT modulated docetaxel resistance in LAPC4.
Taken together, these data demonstrate a role of AR signaling in docetaxel sensitivity in LAPC4, implying that modulating AR signaling significantly impacts docetaxel sensitivity in some hormone-sensitive prostate cancer cell lines.
KDM5D as a Potential Mediator of Docetaxel Sensitivity with DHT Stimulation.
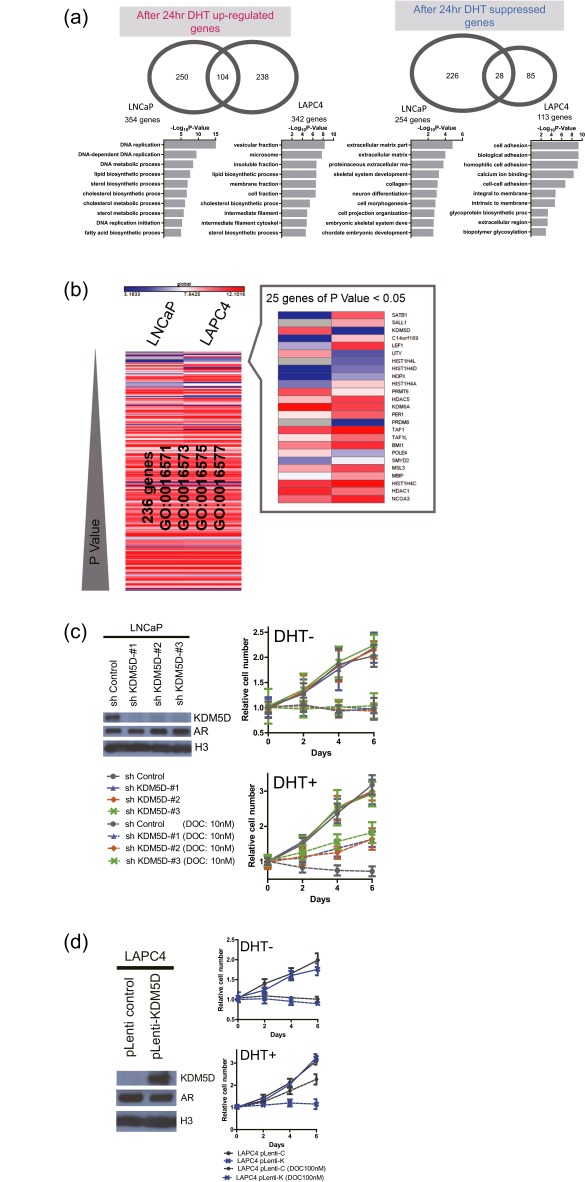
We speculated that the differential docetaxel sensitivity in response to DHT treatment between LNCaP and LAPC4 may be due to differences in their AR transcriptomes. Based on RNA-seq analysis of these cell lines, we found that LNCaP and LAPC4 have distinct AR transcriptomes after DHT exposure, as shown in Fig. 2A. Gene ontology (GO) term analysis of the DHT-regulated genes from the RNA-seq data highlighted varied gene sets regulated by DHT in these cell lines (Fig. S2A). Given multiple reports implicating epigenetic modulators affecting AR signaling (7–9), we hypothesized that epigenetic modulators may play a role in the differential gene expression profiles in response to DHT exposure in these cell lines and in turn determine docetaxel sensitivity. We therefore compared the expression level of 236 genes from the RNA-seq data, which were represented in four epigenetic GO terms (i.e., GO:0016573 histone acetylation, GO:0016575 histone deacetylation, GO:0016571 histone methylation, and GO:0016577 histone demethylation) to assess whether any of these functions were associated with the differential docetaxel sensitivity in response to DHT (Fig. S2B). A stringent threshold by Bonferroni-corrected P value and twofold gene expression difference identified seven differentially expressed genes as potential candidates (Fig. 2B) involved in DHT-induced docetaxel insensitivity in LAPC4 but not LNCaP. Knockdown of these seven genes by siRNA (small-interfering RNA) was performed in LNCaP or LAPC4, based on the expression of the relevant gene. Of the seven genes, only knockdown of KDM5D in LNCaP significantly altered docetaxel sensitivity in the presence of 10 nM DHT compared with an siRNA negative control [GI50 10.46 ± 1.27 and 1.28 ± 0.79 nM in si-KDM5D and si-control, respectively, logtwofold change (Log2FC) 3.19 ± 0.74] (Fig. 2C).
Fig. 2.
KDM5D as a potential mediator of docetaxel sensitivity with DHT stimulation. (A) Heat map of RNA expression level (logtwofold change by 10 nM DHT) based on RNA-seq data with LNCaP and LAPC4 after 4- and 24-h DHT induction. The mean expression value of three independent experiments is presented. (B) Volcano plot of 236 genes (consisting of GO:0016573 histone acetylation, GO:0016575 histone deacetylation, GO:0016571 histone methylation, and GO:0016577 histone demethylation). The mean expression value of three independent experiments was used for the analysis. (C) LNCaP or LAPC4 was transfected with siRNA of the indicated targets (based on the expression level of the relevant gene) and negative control (50 nM) 2 d before treatment with docetaxel. Transfected cells were treated with varied docetaxel concentrations in 10% CSS media supplemented with 10 nM DHT for 6 d. GI50 of docetaxel was determined after 6 d of treatment. Results are expressed as mean ± SEM. (D) LNCaP and DU145 were transfected with 50 nM si-K (KDM5D) and si-C (control) 2 d before docetaxel treatment. Transfected cells were treated with varied docetaxel concentrations in 10% CSS media with and without 10 nM DHT for 6 d. GI50 of docetaxel was determined after 6 d of treatment. Results are expressed as mean ± SEM. Nuclear fractions were collected 48 h after the indicated siRNA transfection and subjected to immunoblotting with the indicated antibodies.
Fig. S2.
(A) Venn diagrams showing DHT-induced and -suppressed genes (FDR-adjusted P < 0.05) at 24 h in LNCaP and LAPC4. GO term analysis was performed in each specific gene set, and the top 10 terms according to −log10 P value are displayed. (B) Heat map of gene expression level of 236 histone modification genes in LNCaP and LAPC4 sorted by P value. Mean expression values of three independent experiments were examined. (C) Cell growth of LNCaP-sh-control and LNCaP-sh-KDM5D (1, 2, and 3) treated with and without 10 nM docetaxel in 10% charcoal stripped serum (CSS) with or without 10 nM DHT culture conditions. Results are presented as relative values (mean ± SEM). Nuclear fractions were collected and subjected to immunoblotting with the indicated antibodies. (D) Cell growth of LAPC4-pLenti-C (control) and LAPC4-pLenti-K (KDM5D) treated with and without 100 nM docetaxel in 10% CSS with or without 10 nM DHT culture conditions. Results are presented as relative values (mean ± SEM). Nuclear fractions were collected and subjected to immunoblotting with the indicated antibodies.
To determine whether KDM5D altered docetaxel sensitivity through AR signaling, we examined DU145, an AR-negative cell line, with knockdown of KDM5D. Nuclear protein was extracted to examine KDM5D expression levels because of nonspecific affinity in cytoplasmic protein. As expected, knockdown of KDM5D in LNCaP rendered these cells less sensitive to docetaxel with DHT (GI50 10.14 ± 1.63 and 1.00 ± 0.33 nM in si-KDM5D and si-control, respectively, Log2FC 3.37 ± 0.25) but not without DHT (GI50 7.21 ± 1.43 and 6.89 ± 0.71 nM in si-KDM5D and si-control, respectively, Log2FC 0.06 ± 0.14), whereas knockdown of KDM5D in DU145 did not alter these cells’ sensitivity to docetaxel in the presence (GI50 4.00 ± 0.14 and 4.20 ± 0.26 nM in si-KDM5D and si-control, respectively, Log2FC −0.07 ± 0.14) or absence (GI50 3.73 ± 0.06 and 3.24 ± 0.06 nM in si-KDM5D and si-control, respectively, Log2FC 0.20 ± 0.05) of DHT (Fig. 2D), suggesting that both AR signaling and lower expression of KDM5D are involved in docetaxel sensitivity.
Similarly, relative resistance to docetaxel was also observed in LNCaP with stable knockdown of KDM5D generated by Tet-on inducible short hairpin (sh)-KDM5D (Fig. S2C), and overexpressing KDM5D in LAPC4 by lentiviral infection reversed docetaxel insensitivity with DHT stimulation (Fig. S2D). Collectively, these data suggest that KDM5D plays an important role in docetaxel resistance, potentially by altering expression of AR target genes.
KDM5D and AR in the Nucleus Cooperate in Rendering Docetaxel Sensitivity.
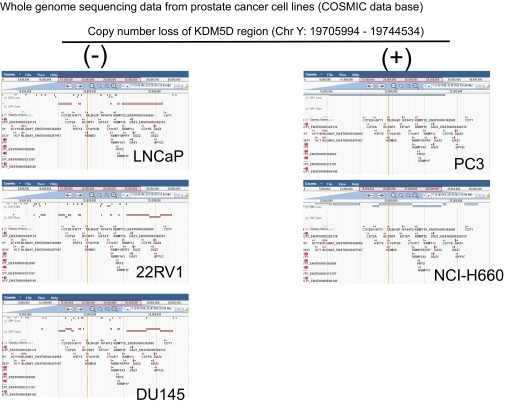
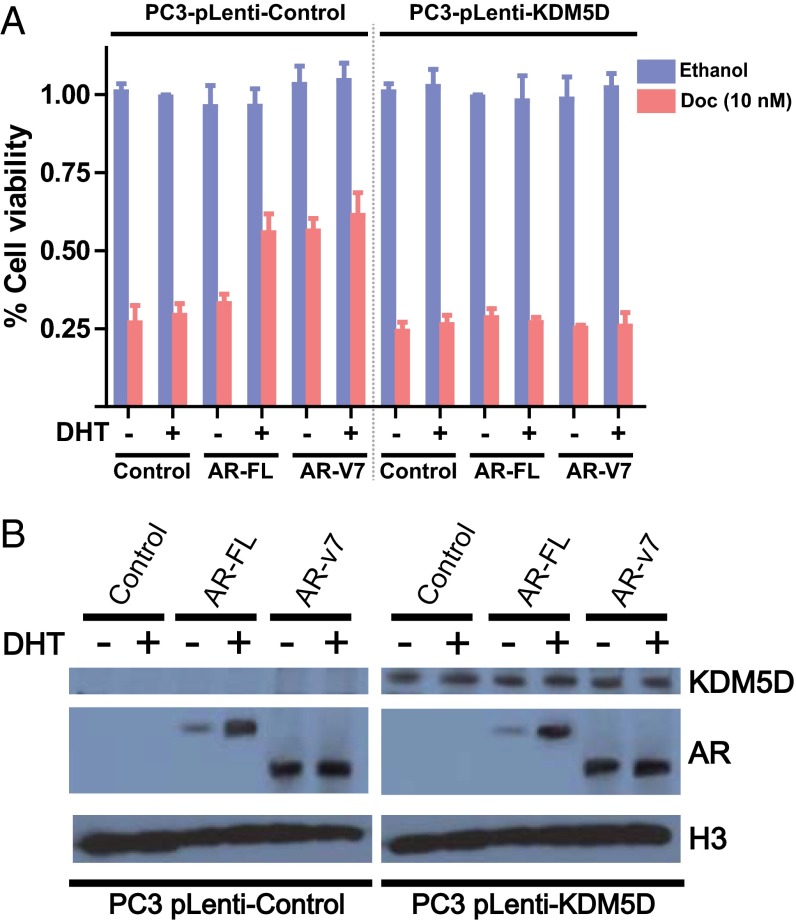
With regard to the specificity of the interaction between KDM5D and AR in docetaxel sensitivity, we used the PC3 cell line, which is AR-negative and has been reported to have deletion of the KDM5D region on the Y chromosome in publicly available datasets (Fig. S3). To test the hypothesis that KDM5D modulates docetaxel sensitivity with AR activity in the nucleus, stable KDM5D-overexpressing PC3 cells were generated. We then examined whether introducing AR-FL (full length) and its truncated splice isoform AR-v7 into these cells affects docetaxel sensitivity with and without DHT stimulation. As shown in Fig. 3A, AR-FL introduction into control PC3, which has loss of KDM5D, resulted in greater docetaxel resistance with DHT stimulation but not without DHT stimulation, whereas introduction of AR-v7, which has been shown to be constitutively active (10), conferred docetaxel insensitivity regardless of DHT stimulation. Notably, in the PC3-KDM5D–overexpressing cell line, docetaxel insensitivity was not seen with either AR-FL or AR-v7 introduction.
Fig. S3.
Whole-genome sequence data of a panel of prostate cancer cell lines (COSMIC database). Copy-number variations in the Y chromosome are shown.
Fig. 3.
KDM5D and AR in the nucleus cooperate in rendering docetaxel sensitivity. (A) PC3-pLenti-control and PC3-pLenti-KDM5D cells were transfected with the indicated AR constructs (AR-FL and AR-v7) using a forward transfection protocol. The next day, cells were plated in a 96-well plate in CSS with and without 10 nM DHT, followed by the indicated treatment (10 nM docetaxel) for 6 d. Inhibitory effect on cell growth is presented as a relative value (mean ± SEM) compared with control as 100%. (B) Transfected cells were starved in CSS for 48 h, followed by treatment with and without 10 nM DHT for 24 h. Nuclear fractions were collected and subjected to immunoblotting with the indicated antibodies.
To assess whether KDM5D affects the expression level of AR, we examined AR expression in the nucleus with and without DHT stimulation. As expected, the expression level of AR-FL in the nucleus was increased with DHT stimulation whereas AR-v7 was consistently sustained in the nucleus, indicating a constitutively active state (Fig. 3B). Importantly, KDM5D introduction into PC3 cells did not alter AR expression levels. These data suggest that KDM5D mediates AR transcriptional activity in the nucleus, which consequently causes varied docetaxel sensitivity.
KDM5D Directly Interacts with AR and Regulates Its Transcriptional Activity.
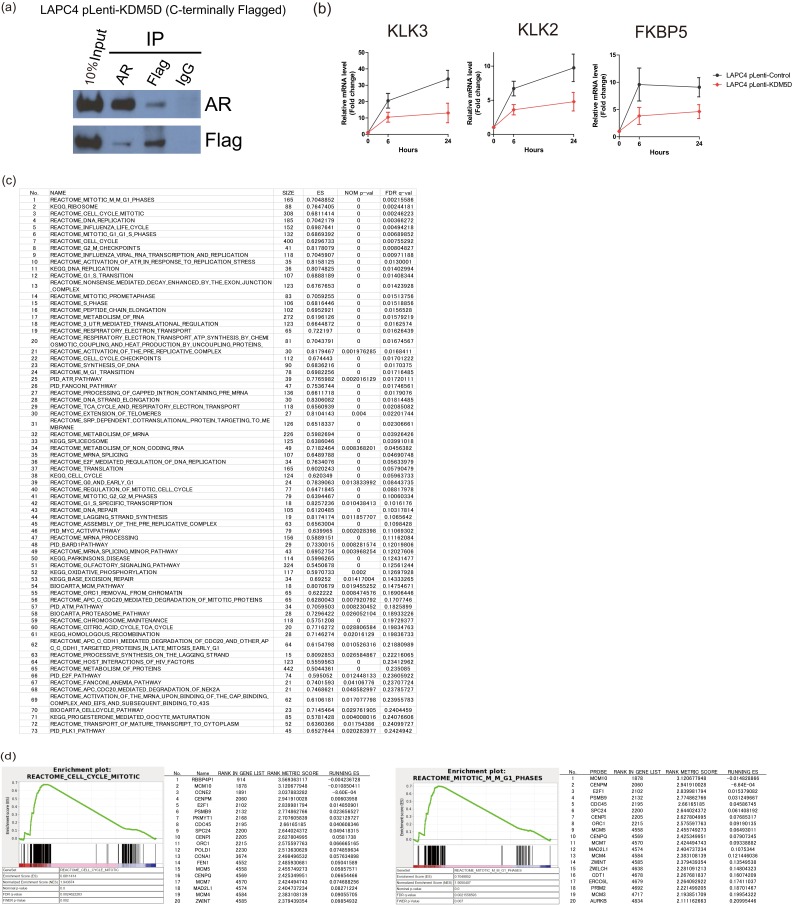
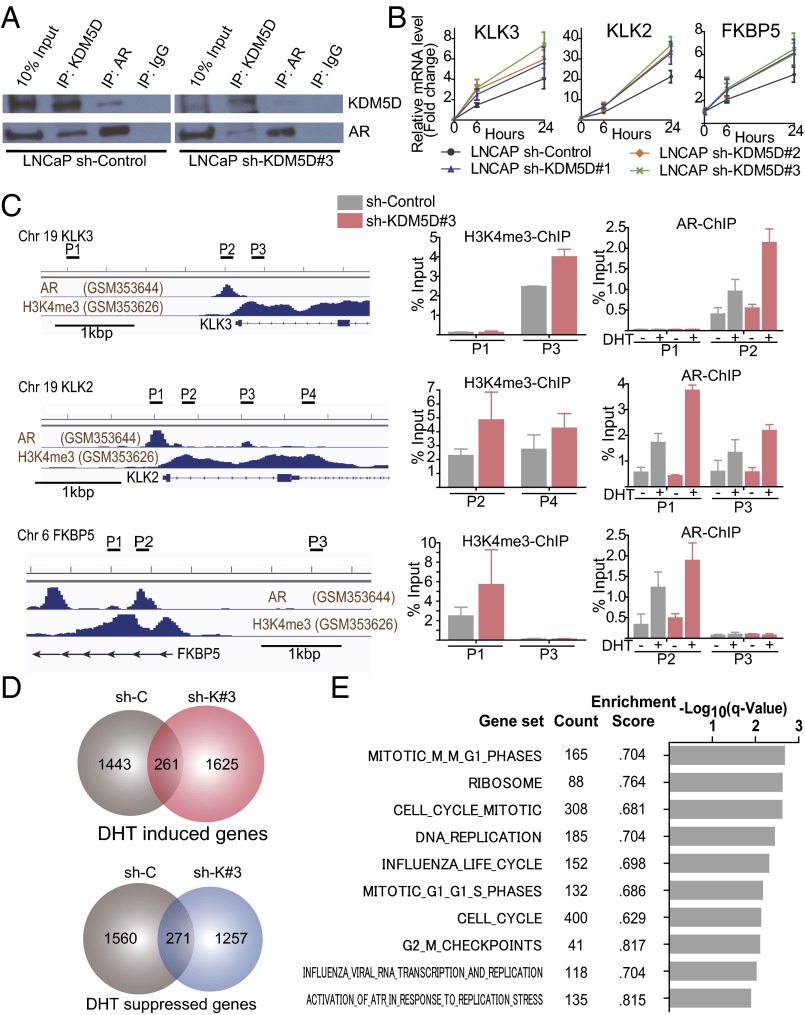
To examine whether KDM5D interacts with AR or AR-associated machinery, coimmunoprecipitation (co-IP) of nuclear protein was conducted using a KDM5D-Flag–tagged LAPC4 cell line, and we found that ectopic KDM5D expression directly interacts with AR in the nucleus (Fig. S4A). Furthermore, endogenous interaction between KDM5D and AR was confirmed in LNCaP, as there was a weaker co-IP with knockdown of KDM5D (Fig. 4A). This result suggests a physical interaction between KDM5D and AR in the nucleus.
Fig. S4.
(A) Nuclear fractions in LAPC4-pLenti-KDM5D cells were immunoprecipitated with antibodies specific to IgG, AR, and Flag followed by immunoblotting with the indicated antibodies. (B) LAPC4 cells with and without overexpression of KDM5D were starved in 10% CSS media for 48 h followed by 10 nM DHT induction. RNA expression levels of AR-regulated genes were examined at 6 and 24 h after DHT by QT-PCR and normalized to GAPDH. Data are expressed as relative mean fold change compared with expression levels without DHT stimulation (mean ± SEM). (C) Gene set enrichment analysis showing 73 gene sets that are significantly enriched by knockdown of KDM5D (sh-KDM5D#3) at FDR < 0.25 in 10 nM DHT-supplemented medium. (D) GSEA showing up-regulation in representative sets of cell cycle/mitosis-related genes. The top 20 leading-edge genes are shown.
Fig. 4.
KDM5D directly interacts with AR and regulates its transcriptional activity. (A) Nuclear fractions in LNCaP sh-control and sh-KDM5D#3 cells were immunoprecipitated with antibodies specific to IgG, AR, and KDM5D followed by immunoblotting with the indicated antibodies. (B) LNCaP cells with and without shRNA to KDM5D were starved in 10% CSS media for 48 h followed by 10 nM DHT induction. RNA expression levels of AR-regulated genes were examined at 6 and 24 h after DHT by QT-PCR and normalized to GAPDH. Data are expressed as relative mean fold change compared with the expression level without DHT stimulation (mean ± SEM). (C, Left) ChIP-seq datasets of AR and H3K4me3 (27). The chromatin status in the vicinity of the transcription start site and primers designed for KLK3, KLK2, and FKBP5 are shown. (C, Right) Quantitative PCR of ChIP of H3K4me3 and AR was performed in LNCaP sh-control and sh-KDM5D#3 cells. For ChIP of H3K4me3, cells were cultured in 10% FBS for 3 d. For ChIP of AR, cells were starved for 48 h, and then treated with and without DHT (10 nM) for 16 h. Data are shown as mean ± SD. (D) Venn diagrams showing DHT-induced and -suppressed genes (gene expression fold change >2) at 24 h in LNCaP sh-control and sh-KDM5D#3. (E) Gene set enrichment analysis illustrating the top 10 enrichment gene sets up-regulated by knockdown of KDM5D in DHT (10 nM)-supplemented medium according to −log10 FDR-adjusted P value. None of the down-regulated gene sets were enriched with FDR < 0.25.
To determine the significance of the KDM5D interaction with AR, we used quantitative PCR (QT-PCR) to assess the expression levels of several known androgen-regulated genes in LNCaP cells with and without KDM5D knockdown (Fig. 4B) and in the KDM5D-overexpressed Flag-tagged LAPC4 cell line (Fig. S4B). KDM5D expression impacted androgen-responsive genes with DHT stimulation, demonstrating a relationship between KDM5D and AR signaling.
Because KDM5D has been shown to be capable of demethylating H3K4me3 and me2 marks (11, 12), we examined whether knockdown of KDM5D increases the H3K4me3 level of promoter regions in AR-regulated genes and affects AR binding to its binding sites with DHT stimulation. As shown in Fig. 4C, H3K4me3 levels in the promoter regions of AR-regulated genes were increased by knockdown of KDM5D, and AR binding to those promoter regions was more prominent with DHT stimulation, suggesting that knockdown of KDM5D increases H3K4me3 marks, which are recognized as active transcription marks enhancing AR transcriptional activity. We also conducted RNA-seq analysis using LNCaP sh-control and sh-KDM5D. With knockdown of KDM5D, there were a number of AR-regulated genes whose expression was altered compared with control (Fig. 4D), suggesting its potential role in modulating the AR transcriptome. Because LNCaP sh-control was sensitive to docetaxel in charcoal-stripped serum (CSS) supplemented with 10 nM DHT, and LNCaP sh-KDM5D became less sensitive to docetaxel in the same culture medium (Fig. S2C), we performed gene set enrichment analysis (GSEA) in LNCaP sh-control and sh-KDM5D to assess which pathways were up- or down-regulated by knockdown of KDM5D. Seventy-three gene sets were significantly enriched at false discovery rate (FDR) <0.25 (Fig. S4C); most notably, the mitosis/cell cycle-related pathways were the most significantly up-regulated gene sets (Fig. 4E and Fig. S4D).
Collectively, these data suggest that KDM5D interacts with AR in the nucleus, regulating its transcriptional activity by demethylating H3K4me3 active transcription marks, and that reduced expression of KDM5D leads to altered regulation of AR activity, which in turn confers docetaxel insensitivity.
Impact of KDM5D Expression on Docetaxel Sensitivity in LNCaP Sublines and Impact on Clinical Outcomes.
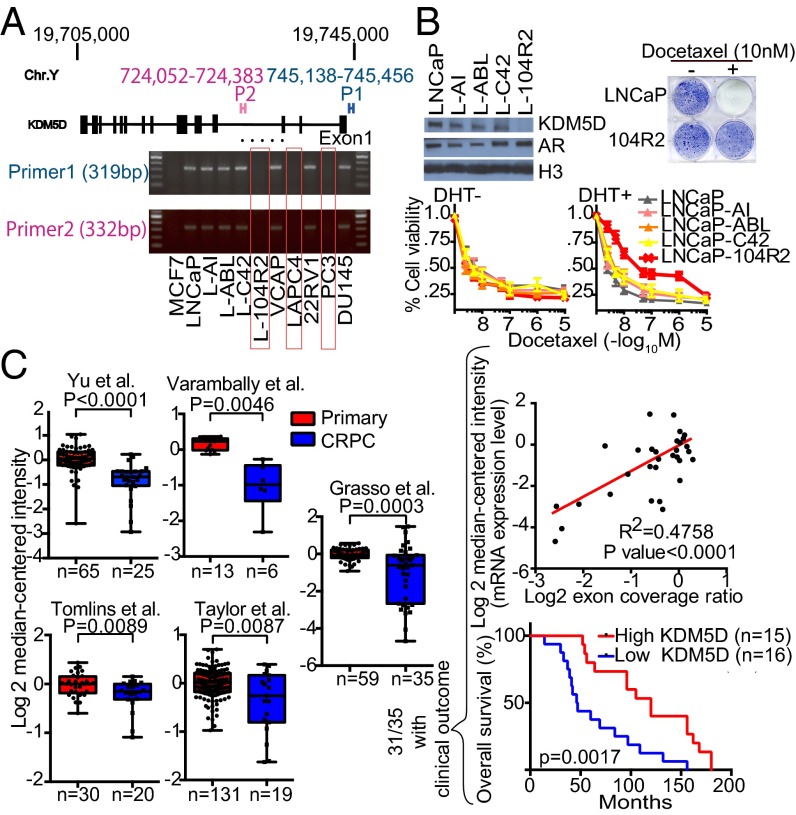
Because KDM5D expression level seemed to be involved in docetaxel sensitivity, this was examined in a panel of prostate cancer cell lines. Interestingly, QT-PCR showed a lack of KDM5D expression in LAPC4, LNCaP-104R2, and PC3 (Fig. S5A). We examined whether LAPC4 and LNCaP-104R2 have a deletion in the KDM5D region on the Y chromosome similar to PC3 (Fig. S3). MCF7, which has a 22XX karyotype, was used as a negative control. We confirmed the absence of the KDM5D region in all these cell lines (Fig. 5A). We then explored docetaxel sensitivity in LNCaP-derived CRPC cell lines expressing AR with and without KDM5D (Fig. 5B, Left Upper). Specifically the LNCaP-104R2 cell line, which has loss of KDM5D, became less sensitive to docetaxel with DHT stimulation (Fig. 5B, Lower). Clonogenic assays showed that the parental LNCaP treated with 10 nM docetaxel in DHT-supplemented medium did not grow, whereas LNCaP-104R2 kept growing in the presence of DHT and docetaxel (Fig. 5B, Right Upper). These data suggest that KDM5D loss with DHT stimulation permits survival in the presence of docetaxel and is a possible cause of docetaxel resistance in CRPC.
Fig. S5.
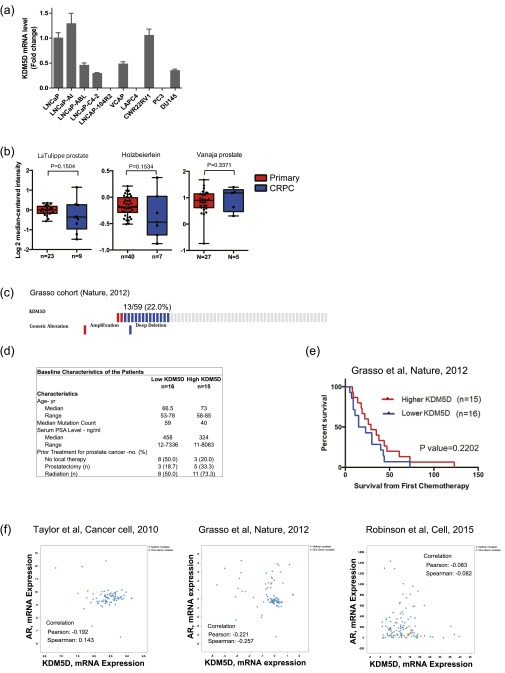
(A) RNA expression of KDM5D in a panel of prostate cancer cell lines. GAPDH was used for normalization. Mean expression values of three independent experiments were examined and are presented as mean ± SEM. (B) Datasets were analyzed for KDM5D expression in primary prostate cancer versus CRPC. Statistical significance and number of samples are indicated. P values were calculated using two-sample, one-tailed Welch’s t test. (C) Copy-number alteration (CNA) of the KDM5D region in the Grasso cohort, which contains CNA and sequencing data for 59 patients. The data include 11 primary cancer patients and 48 CRPC patients. Results were selected by using OncoPrint (www.cbioportal.org/oncoprinter.jsp), which visualizes CNA from the cBioPortal database. (D) Comparisons of characteristics of high- and low-KDM5D groups in the Grasso cohort [31 CRPC patients who have a clinical outcome (overall survival and survival from the time point of starting chemotherapy) and KDM5D expression level]. (E) Patients in the Grasso cohort were divided into two groups according to KDM5D mRNA expression level to carry out Kaplan–Meier analysis. (F) Lack of significant correlation between AR and KDM5D mRNA expression in the indicated datasets. Results were obtained from the cBioPortal database.
Fig. 5.
Impact of KDM5D expression on docetaxel sensitivity in LNCaP sublines and impact on clinical outcomes. (A) Extracted DNA from the indicated cell lines was examined by PCR with primer 1 (designed for the transcription started site) and primer 2 (designed for the intron), and then amplicons were subjected to gel electrophoresis. (B, Left Upper) Nuclear fractions were collected in the indicated cell lines and subjected to immunoblotting with the indicated antibodies. (B, Lower) LNCaP and LNCaP-derived CRPC cell lines were treated with the indicated concentrations of docetaxel in 10% CSS media with (Right) and without (Left) 10 nM DHT for 6 d. The inhibitory effect on cell growth by docetaxel is presented as a relative value (mean ± SEM) compared with control as 100%. (B, Right Upper) Clonogenic survival assays in which 7 × 10³ cells were plated in a six-well plate and treated with and without 10 nM docetaxel in 10% CSS media supplemented with 10 nM DHT for 14 d. (C) KDM5D transcript expression in multiple prostate cancer studies from the Oncomine database. Datasets were analyzed for KDM5D expression in primary prostate cancer versus CRPC. Statistical significance and number of samples are indicated. P values were calculated using two-sample, one-tailed Welch’s t test. In the Grasso cohort, 31 out of the 35 CRPC patients had exon coverage ratio, mRNA expression level, and clinical outcome data (overall survival). Linear regression was performed to examine a correlation between exon coverage ratio and mRNA expression level, and patients were divided into two groups according to KDM5D mRNA expression level to carry out Kaplan–Meier analysis. P value is calculated using log-rank test. Median survival was 120 and 46.5 mo, respectively, for high-KDM5D and low-KDM5D groups.
To start to assess the clinical relevance of these results, we analyzed publicly available gene expression profile data from the Oncomine database. The data from LNCaP and LNCaP-derived CRPC cell lines suggest that there may be genetic loss of KDM5D during ADT, which may lead to docetaxel resistance. We hypothesized that CRPC patients have attenuated KDM5D expression levels compared with hormone-naïve primary cancer patients. KDM5D RNA expression data were available in eight cohorts (13–20). Seven of the eight cohorts showed decreased expression levels of KDM5D in CRPC compared with hormone-naïve primary cancer, five of which were significantly decreased (Fig. 5C, Left), and two of the remaining three cohorts with smaller sample sizes also showed a similar trend of KDM5D expression level (Fig. S5B). One of the eight cohorts, the Grasso cohort, extensively investigated copy-number alteration (CNA) in primary cancer (11 patients) and CRPC (48 patients). Thirteen of 48 CRPC patients (27.1%) had KDM5D deletion, whereas no patients with primary tumors had KDM5D deletion (Fig. S5C). Of the 31 CRPC patients with gene expression profiling, we found a significant correlation between KDM5D mRNA expression level and CNA after determining the exon coverage ratio, indicating that less KDM5D expression in CRPC tumors is likely attributable to genetic alteration than epigenetic silencing or posttranslational modification (Fig. 5C, Right Upper). Notably, patients with decreased expression of KDM5D in their CRPC tumors had significantly shorter OS from time of diagnosis (Fig. 5C, Right Lower and Fig. S5D). In this small cohort of 31 patients, there was a trend toward shorter survival from time of chemotherapy initiation with lower KDM5D expression (Fig. S5E). We also determined whether there was a correlation between AR and KDM5D expression levels, but no significant correlation was seen in three independent cohorts (Fig. S5F), suggesting that aberrations of AR and attenuated KDM5D expression in CRPC are independent events. Further study to define the predictive value of KDM5D expression for docetaxel sensitivity is required.
Taken together, these data suggest that KDM5D is an important determinant of AR activity and in turn impacts docetaxel sensitivity in vitro, and that deletion or attenuated KDM5D expression in patients may be associated with poorer clinical outcomes.
Discussion
The specificity of AR signaling is determined by multiple factors, including epigenetic factors, but it is clear that these changes are associated with different disease transitions including tumorigenesis (21), development of CRPC (22), and potentially drug resistance. KDM5D has been reported to have a tumor suppressor function in prostate cancer (23). Specifically, KDM5D regulates invasion-associated genes (such as the MMP family), demethylating their H3K4me3 marks, and loss of KDM5D causes the cell to acquire invasiveness with increased H3K4me3 levels in the promoter regions of relevant genes, leading to the development of metastasis. This work focused on AR-negative CRPC cell lines, such as DU145 and PC3. Our work further documents the biological relevance of KDM5D in prostate cancer, as we show that KDM5D interacts with and alters the transcriptional activity of AR and impacts docetaxel sensitivity.
Preclinical and clinical experience has documented minimal activity of taxane therapy alone in HSPC (24, 25), and transcriptional response to this drug has recently been shown to be largely dependent on hormone status (26), suggesting that specific AR signaling modulates docetaxel insensitivity and that alteration of this signaling might sensitize prostate cancer cells to docetaxel. One well-known feature of AR signaling in prostate cancer involves ERG, which is overexpressed in at least 50% of prostate cancers as a result of gene fusions with genes such as TMPRSS2, SLC45A3, and NDRG1, which have AR promoter regions (27, 28). ERG has recently been shown to bind to soluble tubulin in the cytoplasm and antagonize inhibition of microtubule depolymerization by taxanes, resulting in its resistance to this therapy (29). In this paper, we studied LNCaP and LAPC4, hormone-sensitive prostate cancer cell lines, both of which are ERG fusion-negative, and demonstrated that LAPC4, which does not express KDM5D, displayed docetaxel resistance with androgen exposure and also showed the converse, in that blocking AR signaling with enzalutamide sensitized LAPC4 cells to docetaxel. On the other hand, LNCaP, which expresses KDM5D, did not show any change in docetaxel sensitivity upon androgen exposure. These data suggest that KDM5D expression in mHSPC patients could serve as a biomarker predicting docetaxel sensitivity, and may identify which patients with mHSPC (i.e., those with low KDM5D) might benefit from docetaxel treatment given at the time of ADT initiation.
The greater benefit of adding docetaxel to ADT for mHSPC (i.e., CHAARTED trial) than for CRPC patients suggests that initiation of ADT results in a series of transcriptional changes leading to greater docetaxel activity and that these changes are less common in the CRPC setting when docetaxel is added after prolonged ADT (3). In our study, we demonstrated that among 10 prostate cancer cell lines, 3 cell lines, LAPC4, PC3, and LNCaP-104R2, have genetic loss of KDM5D. KDM5D deletion in LNCaP-104R2, a LNCaP-derived CRPC cell line, suggests that deletion may occur during ADT. Our analysis of publicly available clinical datasets detailed less KDM5D RNA expression in CRPC compared with hormone-sensitive primary cancer and, in the Grasso cohort, which extensively studied the CNA of CRPC patients, we found that 13 out of 48 (27.1%) CRPC patients exhibited KDM5D deletion. These data indicate that decreased KDM5D expression level in CRPC may in part be due to KDM5D deletion as well as other processes that suppress gene expression such as epigenetic silencing and posttranslational modification, which could occur during ADT. Furthermore, we demonstrated that with AR activation, LNCaP-104R2, which has genetic loss of KDM5D, exhibited docetaxel insensitivity compared with parental LNCaP and other LNCaP-derived CRPC cell lines. The potentially more aggressive biology of prostate cancer cells with low KDM5D expression is supported by a higher frequency of loss of KDM5D in CRPC than primary prostate cancer and shorter OS in patients with lower KDM5D expression in the Grasso cohort. Given that CRPC patients have less KDM5D expression and that 62.7% of CRPC patients harbor aberrations of AR signaling (5), this may explain why docetaxel may have less activity in CRPC; namely, altered AR signaling and low KDM5D may be the cause of less docetaxel activity in CRPC than when docetaxel is added at the start of ADT in mHSPC. Hypothetically, patients with CRPC and persistent AR activity but low KDM5D may benefit more from a combination of further androgen blockade (with an agent such as enzalutamide) and docetaxel rather than docetaxel alone. This hypothesis requires testing.
In conclusion, KDM5D encoded on the Y chromosome affects AR signaling and impacts docetaxel sensitivity. Further study to explore this biological mechanism and the predictive value of KDM5D expression on docetaxel sensitivity is required, and has the potential to provide new insights into docetaxel resistance and guide strategies to improve its efficacy.
Materials and Methods
Cell Lines, Proliferation Assay, and Clonogenic Survival Assay.
The prostate cancer cell lines (LNCaP, 22RV1, VCAP, PC3, and DU145) were obtained from the American Type Culture Collection (ATCC). The LNCaP-Abl cell line was provided by Zoran Culig (Innsbruck Medical University, Innsbruck, Austria). The LNCaP-C42 cell line was obtained from ViroMed Laboratories. The LNCaP-104R2 cell line was provided by Shutsung Liao (University of Chicago, Chicago, IL), and the LAPC-4 cell line was provided by Charles Sawyers (Memorial Sloan Kettering Cancer Center, New York, NY). These cells were maintained with 10% FBS (LNCaP, LNCaP-C42, LNCaP-AI, VCAP, 22RV1, LAPC4, PC3, and DU145) or 10% charcoal-stripped serum (LNCaP-Abl and LNCaP-104R2) at 37 °C in 5% CO2. Cells treated in individual experiments were assessed for cell viability using CellTiter-Glo Luminescent Assay (Promega) following the manufacturer’s protocol by incubating cells in a 96-well format in 1:1 media to luminescent reagent for 10 min. Additional information can be found in SI Materials and Methods.
QT-PCR, DNA Extraction, and RNA-Seq Library Preparation.
The primers used are listed in Dataset S1. Additional information can be found in SI Materials and Methods. For RNA-seq, polyA+ RNA was purified using a polyA Spin mRNA Isolation Kit (New England Biolabs) followed by library preparation for 40 ng of purified RNA. Additional information regarding library preparation can be found in SI Materials and Methods. Biological triplicates were sequenced by Illumina NextSeq 500 (SR75) at the Dana-Farber Cancer Institute Center for Cancer Computational Biology Core Facility.
RNA Interference, DNA Transfection, and Lentiviral Transduction.
Sequences of short hairpin RNAs (shRNAs) used are listed in Dataset S2. siRNAs targeting genes of interest (ON-TARGETplusTM siRNA) were purchased from Dharmacon (catalog numbers are listed in Dataset S2). The AR isoform plasmid was generously provided by S. Plymate (University of Washington, Seattle, WA), and the construct was subcloned into pHR′-CMV-GFP expression vector. Additional information can be found in SI Materials and Methods.
Immunoblotting, Cell Fractionation, and Coimmunoprecipitation.
The cellular protein fractionation protocol can be found in SI Materials and Methods. Details of immunoprecipitation can be found in SI Materials and Methods. Antibodies used are listed in Table S1.
Table S1.
List of antibodies used
| Protein | Antibody | Vendor | Catalog no. |
| PARP | Rabbit anti-PARP | Cell Signaling | 9542 |
| B-actin | Monoclonal anti–β-actin | Sigma | A-5316 |
| KDM5D | Rabbit anti-JARID1D | Novus Bio | NB100-93292 |
| Androgen receptor | Rabbit anti-AR (N-20) | Santa Cruz | sc-816 |
| Androgen receptor | Rabbit anti-AR (N-20), ChIP grade | Santa Cruz | sc-816X |
| Histone H3 | Rabbit anti-histone H3, ChIP grade | Abcam | ab1791 |
| H3K4me3 | Mouse monoclonal anti-histone H3K4me3, ChIP grade | Abcam | ab1012 |
| Flag | Mouse monoclonal anti-DDK | Origene | TA50011-100 |
| Phosphorylated AR (Ser81) | Rabbit anti-phospho AR (Ser81) | Millipore | 07–1375 |
| Control IgG | Normal rabbit IgG | Santa Cruz | sc-2027 |
| Secondary Ab | Goat anti-mouse IgG-HRP | Santa Cruz | sc-2005 |
| Secondary Ab | Goat anti-rabbit IgG-HRP | Santa Cruz | sc-2004 |
Chromatin Immunoprecipitation.
Chromatin equivalent to 7.5 × 10⁶ cells was used for chromatin immunoprecipitation (ChIP) using various antibodies (listed in Table S1). Extracted ChIP-DNA was used for quantitative PCR (qPCR) with the specific primers as listed in Dataset S1. Additional information can be found in SI Materials and Methods.
Bioinformatics Analysis.
GENE-E (www.broadinstitute.org/cancer/software/GENE-E/), DAVID bioinformatics resources (https://david.ncifcrf.gov), Oncomine (https://www.oncomine.org/resource/login.html), Cosmic (cancer.sanger.ac.uk/cosmic), cBio Cancer Genomics Portal (cBioPortal; www.cbioportal.org), Integrated Genome Viewer (https://www.broadinstitute.org/igv/), and GSEA (software.broadinstitute.org/gsea/index.jsp) software were used. Additional information can be found in SI Materials and Methods.
SI Materials and Methods
Proliferation and Clonogenic Survival Assays.
For direct cell counting, cells were trypsinized and collected at the indicated time points. The number of viable cells was determined by Trypan blue exclusion and directly counted using a hemocytometer. Clonogenic survival assays in response to drug treatment were performed by plating 7–10 × 103 cells in a six-well plate. Medium plus drugs was replaced every 3 d. Cells were then fixed with 4% paraformaldehyde in PBS and stained with crystal violet solution.
QT-PCR, DNA Extraction, and RNA-Seq Library Preparation.
RNA was isolated using TRIzol (Invitrogen) according to the manufacturer’s protocol followed by quantification using a NanoDrop spectrophotometer, and 1 μg of RNA was reverse-transcribed using a High Capacity cDNA Reverse Transcription Kit (Applied Biosystems). DNA was isolated using a QIAamp DNA Mini Kit (Qiagen). Quantitative PCR was performed on an ABI 7300 sequence detector. Product formation was detected by incorporation of SYBR Green I using ROX as a passive reference. The expression data were normalized with GAPDH in each sample. Experiments were repeated and analyzed three times. For RNA-seq library preparation, RNA fragmentation, first- and second-strand cDNA synthesis, and end-repair processing were performed using NEBNext Ultra RNA Library Prep Kit for Illumina (New England Biolabs). The adaptor was ligated to the fragments for multiplex samples using NEBNext Multiplex Oligos for Illumina index primers (New England Biolabs), and the libraries were amplified by 14 cycles of PCR. The products were size-fractionated by running on an 8% polyacrylamide gel, and final libraries were purified from the gel. Fragment sizes were validated by using a High Sensitivity DNA Kit (Agilent Technologies) on an Agilent 2100 Bioanalyzer.
RNA Interference, DNA Transfection, and Lentiviral Transduction.
Mammalian Gene Collection human KDM5D sequence-verified cDNA (BC144102) was purchased from Dharmacon. Individual shRNAs were designed using Enhanced Direct (rnai.co.jp/lsci/e-sidirect.html) for licensees considering mismatch potential >0.3 and longest common factor (LCF) < 9. siRNA transfections were performed using Lipofectamine RNAiMAX (Invitrogen). Twenty-four hours before transfection, cells were seeded onto six-well plates. The cells were transfected with 50 nM siRNA as described in the manufacturer’s protocol and maintained for 48 h followed by the designed experiments. For lentiviral transduction, pLKO-Teton-puro and pLenti-CMyc-DDK-IRES-Puro were transfected with psPAX2 packaging and pMD2.G-envelope plasmid to HEK293FT cells using Lipofectamine 3000 (Invitrogen) for 2 d. Thereafter, prostate cancer cells were infected with viral supernatants (filtered through a 0.45-pm filter) in the presence of 8 μg/mL polybrene. For shRNAs, a spin-infection protocol was applied using six-well plates at 2,700 rpm for 60 min (Heraeus Multifuge X1 Centrifuge Series, Thermo Scientific), followed by incubation at 37 °C. The next day, medium was changed to fresh medium, and the cells transduced with virus were incubated for 3 d followed by selection using puromycin (1–1.5 ng/mL). For DNA plasmid transfection into PC3-pLenti-Control and PC3-pLenti-KDM5D cells, a forward transfection protocol was applied using Lipofectamine 3000 (Invitrogen) overnight, following the manufacturer’s protocol. The next day, cells were trypsinized and examined for the designed experiments.
Cellular Protein Fractionation.
Whole-cell lysates were collected and lysed in radioimmunoprecipitation assay (RIPA) lysis buffer with proteinase inhibitor mixture (Thermo Scientific) and sonicated using a Bioruptor Standard for 5 min. For cellular protein fractionation, hypotonic lysis buffer (50 mM Hepes-NaOH, pH 7.5, 10% glycerol, 0.5% Nonidet P-40, 0.25% Triton X-100, proteinase inhibitor mixture) was used for extracting cytoplasmic proteins. Nuclear pellets were washed with cold PBS once and dissolved in high-salt nuclear extraction buffer (0.1% SDS, 10 mM Tris⋅HCl, 150 mM NaCl, 0.1% Triton-X, proteinase inhibitor mixture) and sonicated using a Bioruptor Standard for 5 min followed by gentle agitation for 30 min at 4 °C. After centrifugation at 13,200 rpm for 5 min, supernatant was collected as nuclear fractions. Proteins were subjected to 4–15% SDS/polyacrylamide gels before being transferred onto nitrocellulose or polyvinylidene difluoride membrane (Millipore).
Coimmunoprecipitation.
For coimmunoprecipitation, nuclear pellets of 8 × 10⁶ cells were lysed in nuclear lysis buffer (10 mM Hepes-NaOH, pH 8, 1.5 mM MgCl2, 25% glycerol, 0.5% Nonidet P-40, 0.42 M NaCl, 0.2 mM EDTA, 0.5 mM DTT) followed by disruption using a U-100 insulin syringe (26-gauge) (Becton Dickinson). The nuclear fraction was collected after centrifugation (13,200 rpm) for 10 min and diluted with dilution buffer (20 mM Tris⋅HCl, pH 8.0, 1.5 mM MgCl2, 0.2 mM EDTA, 0.5% Nonidet P-40), and MgCl and DNase (NEB) were added for final concentrations of 3 mM for Mg2+ and 20 U/mL for DNase, followed by 37-°C incubation for 30 min. Dynabeads Protein G (Life Technologies) (30 μL) was used to preclear for 60 min at 4 °C with gentle rotation. Then, 10% of the lysate was taken as input, and the rest was incubated with 5 μg of primary antibodies [KDM5D: NB100-93292 (0.2 μg/μL); AR: SC-816X (2 μg/μL); Flag: TA50011-100 (1:200); rabbit-IgG: SC-2027 (0.4 μg/μL), mouse-igG: SC-2025 (0.4 μg/μL)] overnight. The next day, 50 μL Dynabeads Protein G was added and incubated for 2 h at 4 °C with gentle rotation. Precipitated proteins by the antibodies of interest were washed using low-salt co-IP wash buffer (20 mM Tris⋅HCl, pH 8.0, 150 mM NaCl, 1.5 mM MgCl2, 0.5% Nonidet P-40, 0.2 mM EDTA) twice, and 30 μL NuPAGE LDS sample buffer with DTT (Bio-Rad) was added and heated at 95 °C for 5 min. Supernatants were immunoblotted for the indicated proteins.
Chromatin Immunoprecipitation.
Cells (7.5 × 10⁶) at room temperature were cross-linked for 10 min with 1% paraformaldehyde and the reaction was terminated by the addition of 1 mL of 1.25 M glycine for 5 min, followed by extracting the nuclear fraction using the hypotonic lysis buffer described in the co-IP protocol. Cross-linked chromatin was transferred to AFA fiber tubes (Covaris) and sonicated to an average fragment size of 150–200 bp in 0.2% SDS shearing buffer using a Covaris sonicator. Sonicated chromatin was centrifuged for 5 min at 13,000 rpm and diluted to 0.1% SDS concentration. After preclearing with Dynabeads Protein G (Life Technologies) for 1 h, chromatin–protein complexes were immunoprecipitated with 5 μg of antibodies (listed in Table S1) overnight at 4 °C. The next day, Dynabeads Protein G was added for 2 h, and beads were washed with the following buffers: low-salt wash buffer (20 mM Tris⋅HCl, pH 8.0, 150 mM NaCl, 0.1% SDS, 1% Triton X-100, 2 mM EDTA), high-salt wash buffer (20 mM Tris⋅HCl, pH 8.0, 500 mM NaCl, 0.1% SDS, 1% Triton X-100, 2 mM EDTA), LiCl wash buffer (10 mM Tris⋅HCl, pH 8.0, 250 mM LiCl, 1% IGEPAL CA-630, 1% sodium deoxycholate, 1 mM EDTA), and TE buffer. Precipitated chromatin was then eluted from the beads in 300 µL elution buffer (1% SDS, 0.1 M NaHCO3) for 1 h at room temperature followed by de–cross-linking at 65 °C overnight. After RNase A and proteinase K treatment, ChIP and input DNA were extracted by phenol-chloroform extraction. Fragment sizes (150–200 bp) were evaluated by a High Sensitivity DNA Kit (Agilent Technologies) on an Agilent 2100 Bioanalyzer.
Bioinformatics Analysis.
Heat maps were created by using GENE-E software from the Broad Institute (www.broadinstitute.org/cancer/software/GENE-E/). GO term analysis was used to examine the impact of AR stimulation of LNCaP and LAPC4 (DAVID bioinformatics resources). A volcano plot was used to effectively identify seven candidate genes among 236 histone modification genes, which demonstrated the significance (Bonferroni-corrected P values from t tests) and magnitude (twofold changes) of the gene expression difference between LNCaP and LAPC4 cells. GSEA software was used to identify significant gene sets (30). Integrated Genome Viewer (IGV v2.3; Broad Institute) was used to refer to available ChIP-seq datasets. Clinical datasets were examined in Oncomine and cBioPortal (31). Kaplan–Meier analysis was performed to compare overall survival between patients with high and low KDM5D expression levels.
Supplementary Material
Acknowledgments
This work was supported by the Louis B. Mayer Foundation.
Footnotes
The authors declare no conflict of interest.
This article is a PNAS Direct Submission.
This article contains supporting information online at www.pnas.org/lookup/suppl/doi:10.1073/pnas.1600420113/-/DCSupplemental.
References
- 1.Petrylak DP, et al. Docetaxel and estramustine compared with mitoxantrone and prednisone for advanced refractory prostate cancer. N Engl J Med. 2004;351(15):1513–1520. doi: 10.1056/NEJMoa041318. [DOI] [PubMed] [Google Scholar]
- 2.Tannock IF, et al. TAX 327 Investigators Docetaxel plus prednisone or mitoxantrone plus prednisone for advanced prostate cancer. N Engl J Med. 2004;351(15):1502–1512. doi: 10.1056/NEJMoa040720. [DOI] [PubMed] [Google Scholar]
- 3.Sweeney CJ, et al. Chemohormonal therapy in metastatic hormone-sensitive prostate cancer. N Engl J Med. 2015;373(8):737–746. doi: 10.1056/NEJMoa1503747. [DOI] [PMC free article] [PubMed] [Google Scholar]
- 4.James ND, et al. STAMPEDE Investigators Addition of docetaxel, zoledronic acid, or both to first-line long-term hormone therapy in prostate cancer (STAMPEDE): Survival results from an adaptive, multiarm, multistage, platform randomised controlled trial. Lancet. 2016;387(10024):1163–1177. doi: 10.1016/S0140-6736(15)01037-5. [DOI] [PMC free article] [PubMed] [Google Scholar]
- 5.Robinson D, et al. Integrative clinical genomics of advanced prostate cancer. Cell. 2015;161(5):1215–1228. doi: 10.1016/j.cell.2015.05.001. [DOI] [PMC free article] [PubMed] [Google Scholar]
- 6.Baker SD, et al. Comparative pharmacokinetics of weekly and every-three-weeks docetaxel. Clin Cancer Res. 2004;10(6):1976–1983. doi: 10.1158/1078-0432.ccr-0842-03. [DOI] [PubMed] [Google Scholar]
- 7.Metzger E, et al. LSD1 demethylates repressive histone marks to promote androgen-receptor-dependent transcription. Nature. 2005;437(7057):436–439. doi: 10.1038/nature04020. [DOI] [PubMed] [Google Scholar]
- 8.Wang C, et al. MDC1 functionally identified as an androgen receptor co-activator participates in suppression of prostate cancer. Nucleic Acids Res. 2015;43(10):4893–4908. doi: 10.1093/nar/gkv394. [DOI] [PMC free article] [PubMed] [Google Scholar]
- 9.Xiang Y, et al. JARID1B is a histone H3 lysine 4 demethylase up-regulated in prostate cancer. Proc Natl Acad Sci USA. 2007;104(49):19226–19231. doi: 10.1073/pnas.0700735104. [DOI] [PMC free article] [PubMed] [Google Scholar]
- 10.Thadani-Mulero M, et al. Androgen receptor splice variants determine taxane sensitivity in prostate cancer. Cancer Res. 2014;74(8):2270–2282. doi: 10.1158/0008-5472.CAN-13-2876. [DOI] [PMC free article] [PubMed] [Google Scholar]
- 11.Iwase S, et al. The X-linked mental retardation gene SMCX/JARID1C defines a family of histone H3 lysine 4 demethylases. Cell. 2007;128(6):1077–1088. doi: 10.1016/j.cell.2007.02.017. [DOI] [PubMed] [Google Scholar]
- 12.Lee MG, Norman J, Shilatifard A, Shiekhattar R. Physical and functional association of a trimethyl H3K4 demethylase and Ring6a/MBLR, a polycomb-like protein. Cell. 2007;128(5):877–887. doi: 10.1016/j.cell.2007.02.004. [DOI] [PubMed] [Google Scholar]
- 13.Grasso CS, et al. The mutational landscape of lethal castration-resistant prostate cancer. Nature. 2012;487(7406):239–243. doi: 10.1038/nature11125. [DOI] [PMC free article] [PubMed] [Google Scholar]
- 14.Holzbeierlein J, et al. Gene expression analysis of human prostate carcinoma during hormonal therapy identifies androgen-responsive genes and mechanisms of therapy resistance. Am J Pathol. 2004;164(1):217–227. doi: 10.1016/S0002-9440(10)63112-4. [DOI] [PMC free article] [PubMed] [Google Scholar]
- 15.LaTulippe E, et al. Comprehensive gene expression analysis of prostate cancer reveals distinct transcriptional programs associated with metastatic disease. Cancer Res. 2002;62(15):4499–4506. [PubMed] [Google Scholar]
- 16.Taylor BS, et al. Integrative genomic profiling of human prostate cancer. Cancer Cell. 2010;18(1):11–22. doi: 10.1016/j.ccr.2010.05.026. [DOI] [PMC free article] [PubMed] [Google Scholar]
- 17.Tomlins SA, et al. Integrative molecular concept modeling of prostate cancer progression. Nat Genet. 2007;39(1):41–51. doi: 10.1038/ng1935. [DOI] [PubMed] [Google Scholar]
- 18.Vanaja DK, Cheville JC, Iturria SJ, Young CY. Transcriptional silencing of zinc finger protein 185 identified by expression profiling is associated with prostate cancer progression. Cancer Res. 2003;63(14):3877–3882. [PubMed] [Google Scholar]
- 19.Varambally S, et al. Integrative genomic and proteomic analysis of prostate cancer reveals signatures of metastatic progression. Cancer Cell. 2005;8(5):393–406. doi: 10.1016/j.ccr.2005.10.001. [DOI] [PubMed] [Google Scholar]
- 20.Yu YP, et al. Gene expression alterations in prostate cancer predicting tumor aggression and preceding development of malignancy. J Clin Oncol. 2004;22(14):2790–2799. doi: 10.1200/JCO.2004.05.158. [DOI] [PubMed] [Google Scholar]
- 21.Pomerantz MM, et al. The androgen receptor cistrome is extensively reprogrammed in human prostate tumorigenesis. Nat Genet. 2015;47(11):1346–1351. doi: 10.1038/ng.3419. [DOI] [PMC free article] [PubMed] [Google Scholar]
- 22.Wang Q, et al. Androgen receptor regulates a distinct transcription program in androgen-independent prostate cancer. Cell. 2009;138(2):245–256. doi: 10.1016/j.cell.2009.04.056. [DOI] [PMC free article] [PubMed] [Google Scholar]
- 23.Li N, et al. JARID1D is a suppressor and prognostic marker of prostate cancer invasion and metastasis. Cancer Res. 2016;76(4):831–843. doi: 10.1158/0008-5472.CAN-15-0906. [DOI] [PMC free article] [PubMed] [Google Scholar]
- 24.Eigl BJ, et al. Timing is everything: Preclinical evidence supporting simultaneous rather than sequential chemohormonal therapy for prostate cancer. Clin Cancer Res. 2005;11(13):4905–4911. doi: 10.1158/1078-0432.CCR-04-2140. [DOI] [PubMed] [Google Scholar]
- 25.Febbo PG, et al. Neoadjuvant docetaxel before radical prostatectomy in patients with high-risk localized prostate cancer. Clin Cancer Res. 2005;11(14):5233–5240. doi: 10.1158/1078-0432.CCR-05-0299. [DOI] [PubMed] [Google Scholar]
- 26.de Leeuw R, et al. Novel actions of next-generation taxanes benefit advanced stages of prostate cancer. Clin Cancer Res. 2015;21(4):795–807. doi: 10.1158/1078-0432.CCR-14-1358. [DOI] [PMC free article] [PubMed] [Google Scholar]
- 27.Yu J, et al. An integrated network of androgen receptor, polycomb, and TMPRSS2-ERG gene fusions in prostate cancer progression. Cancer Cell. 2010;17(5):443–454. doi: 10.1016/j.ccr.2010.03.018. [DOI] [PMC free article] [PubMed] [Google Scholar]
- 28.Tomlins SA, et al. Recurrent fusion of TMPRSS2 and ETS transcription factor genes in prostate cancer. Science. 2005;310(5748):644–648. doi: 10.1126/science.1117679. [DOI] [PubMed] [Google Scholar]
- 29.Galletti G, et al. ERG induces taxane resistance in castration-resistant prostate cancer. Nat Commun. 2014;5:5548. doi: 10.1038/ncomms6548. [DOI] [PMC free article] [PubMed] [Google Scholar]
- 30.Subramanian A, et al. Gene set enrichment analysis: A knowledge-based approach for interpreting genome-wide expression profiles. Proc Natl Acad Sci USA. 2005;102(43):15545–15550. doi: 10.1073/pnas.0506580102. [DOI] [PMC free article] [PubMed] [Google Scholar]
- 31.Cerami E, et al. The cBio Cancer Genomics Portal: An open platform for exploring multidimensional cancer genomics data. Cancer Discov. 2012;2(5):401–404. doi: 10.1158/2159-8290.CD-12-0095. [DOI] [PMC free article] [PubMed] [Google Scholar]
Associated Data
This section collects any data citations, data availability statements, or supplementary materials included in this article.


