Significance
Recent exome sequencing studies have uncovered high-frequency histone H3 driver mutations in pediatric cancers. Previous studies have shown that lysine to methionine histone mutations are potent inhibitors of their respective lysine methyltransferases. However, an in-depth understanding of this inhibition was limited by the lack of structural and kinetic information. This study investigates the biochemical and biophysical parameters of lysine to methionine histone mutants using the methyltransferase G9a and H3K9M as a model system. Structural and functional experiments conclude that the methyltransferase cofactor S-adenosyl methionine is required for binding of G9a to the mutant histone.
Keywords: oncohistone, G9a, EHMT2, H3K9me3, K to M
Abstract
Lysine to methionine (K-to-M) mutations in genes encoding histone H3 are thought to drive a subset of pediatric brain and bone cancers. These high-frequency K-to-M mutations occur at sites of methylation on histone H3, and tumors containing the mutant histones exhibit a global loss of specific histone methylation marks. Previous studies showed that K-to-M mutant histones, also known as oncohistones, are potent orthosteric inhibitors of specific Su(var)3-9, Enhancer-of-zeste, Trithorax (SET) domain methyltransferases. However, the biochemical and biophysical details of the interaction between K-to-M mutant histones and the respective SET domain methyltransferases are currently unknown. Here, we use the histone H3K9-directed methyltransferase G9a as a model to explore the mechanism of inhibition by K-to-M oncohistones. X-ray cocrystal structures revealed that the K9M residue of histone H3 occupies the active site cavity of G9a, and kinetic analysis indicates competitive inhibition of G9a by histone H3K9M. Additionally, we find that the cofactor S-adenosyl methionine (SAM) is necessary for stable interaction between G9a and H3K9M histone. Consistent with the formation of a ternary complex, we find that the inhibitory peptide is uncompetitive with regard to SAM. These data and others indicate that K-to-M oncohistones promote global loss of specific lysine methylation through sequestration and inhibition of SAM-bound SET domain methyltransferases.
Covalent modifications to both DNA and histone proteins turn chromatin into a dynamic information hub that integrates diverse biochemical stimuli to regulate genomic DNA access to the transcription machinery and ultimately, establish and maintain cellular phenotypes. Moreover, there is increasing appreciation that alterations of the chromatin landscape, including DNA and histone modifications, are involved in the pathogenesis of cancer. Nowhere is this finding better supported than with the groundbreaking discoveries of high-frequency somatic mutations in histones that are drivers of tumorigenesis.
Monoallelic missense mutations in genes encoding for histone H3 were recently found in bone and brain tumors that affect children and young adults. Approximately 80% of diffuse intrinsic pontine glioma contain a lysine 27-methionine (K27M) mutation (1, 2), and 95% of chondroblastoma samples contain a K36M mutation in genes encoding either histone H3.1 or H3.3 (3). The K27M and K36M mutations in histone H3 are the known lysine to methionine (“K-to-M”) histone H3 missense mutations found in human disease thus far. Although these oncohistones represent a small population of total histone H3 in tumor cells (3–17% of histone H3), they remarkably lead to global loss of the associated methylation mark on the WT complement of histone H3. The nearly invariant nature of the K-to-M mutation strongly suggests that this specific amino acid substitution imparts a unique gain of function to the mutant histone. We and others previously showed that K-to-M oncohistones transform the histone H3 proteins into potent inhibitors of specific lysine methyltransferase enzymes (4–7). The unprecedented finding that mutant histones act as enzyme inhibitors and alter downstream epigenomic landscapes implicates a direct effect of epigenetic misregulation driven by oncohistones in tumorigenesis.
Polycomb Repressive Complex 2 (PRC2) is one component of the two main Polycomb group protein complexes that function in a collaborative epigenetic cross-talk with H3K27me3 to initiate and maintain transcriptional repression, and the EHZ2 subunit of PRC2 catalyzes mono-, di-, and trimethylation of H3K27. Previous studies showed that the K27M mutation found in pediatric glioma is sufficient to transform histone H3 into a potent inhibitor of enzymatic activity of PRC2 (4, 5, 7). Consequently, tumor cells with the K27M mutation exhibit low levels of H3K27me3 and aberrant gene silencing (4, 7–9). Previously, we found that only long, unbranched hydrophobic side chains containing methionine (M) and isoleucine (I) at lysine 27 (K27M and K27I) were capable of inhibiting PRC2 in vitro and decreasing H3K27me3 when expressed ectopically in cultured cells (7). The recent identification of K27I histone H3 mutations in a small number of diffuse intrinsic pontine glioma samples further links the inhibition of PRC2 and loss of K27me3 to the likely oncogenic activity of histone H3K27 mutations (10). Additionally, histone H3 peptides that contained unbranched hydrophobic lysine isosteres at position 27 are potent orthosteric inhibitors of PRC2 activity (5). Despite these findings, a detailed biochemical and biophysical understanding of the interaction of K-to-M mutant histones with Su(var)3-9, Enhancer-of-zeste, Trithorax (SET) domain methyltransferases is currently lacking.
In seeking to better understand the mechanism of K-to-M mutant histones, we chose to study the H3K9 methyltransferase G9a as a model system because of the availability of high-resolution G9a crystals described in the literature. G9a is an ∼120-kDa protein and contains an SET domain at its C terminus that catalyzes mono- and dimethylation of histones at lysine 9 (11), and we previously showed that H3K9M peptides are capable of inhibiting activity of SUV39H1 and G9a, two H3K9-directed methyltransferases, in vitro (7). Recent studies identified a role for G9a in heterochromatin maintenance and transcriptional repression, such as the silencing of repeat elements, including long interspersed nuclear elements and endogenous retroviruses (12–14). Up-regulation of both G9a and G9a like protein (GLP) has implications in a variety of human cancers, including solid tumors as well as acute myeloid leukemia (15–17). Here, we present biochemical and structural evidence that the histone H3K9M peptide inhibits G9a activity by effectively competing with WT histone H3 substrate peptide for binding to the active site. Additionally, we find that G9a bound to S-adenosyl methionine (SAM) is necessary to form a stable ternary complex with the K9M peptide. Together, these data provide important mechanistic insights into how oncohistones alter the chromatin landscape in tumorigenesis.
Results
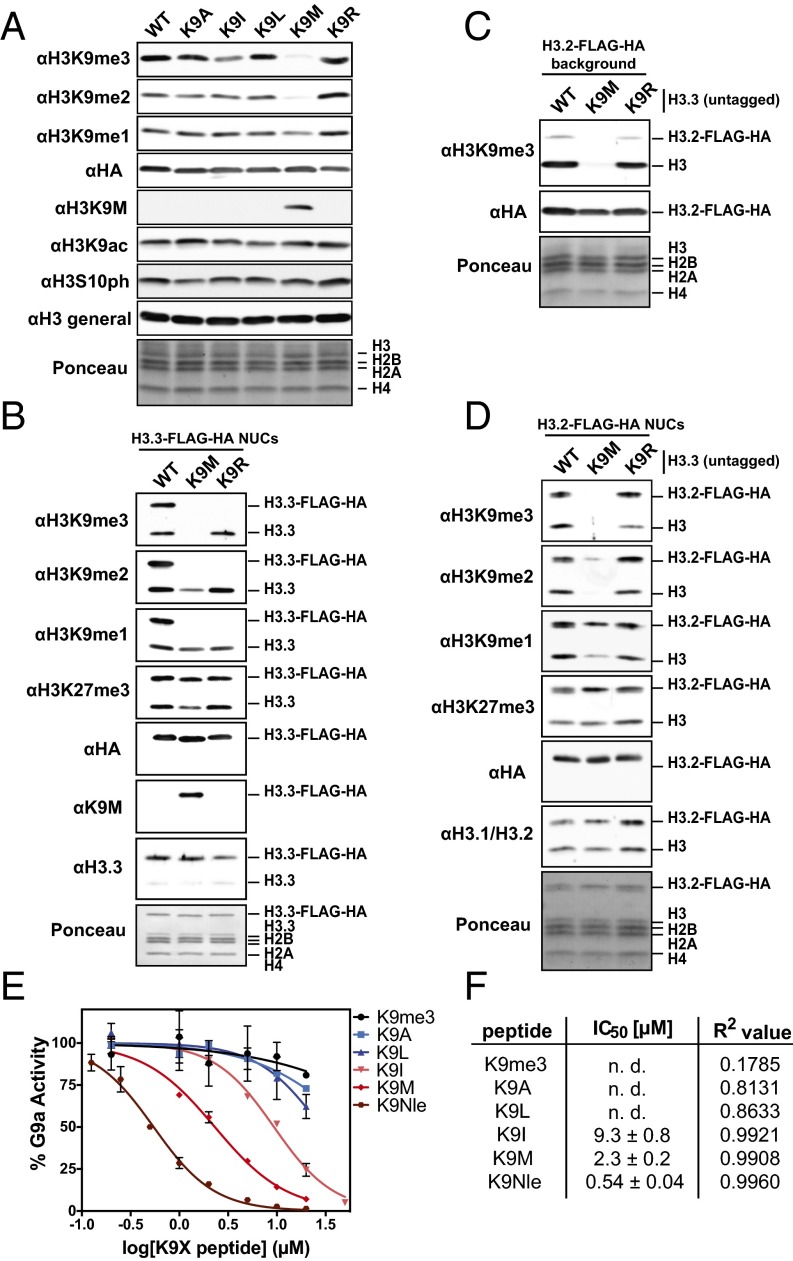
Previously, we showed that a histone H3 transgene containing the K9M substitution was sufficient to decrease global levels of H3K9me3 in cells (7). To further evaluate the specificity of this substitution, we assessed whether histone H3 transgenes with nonmethionine substitutions at lysine 9 would similarly lead to loss of H3K9me2/3 levels in cells. Immunoblot analysis of whole-cell extracts from transgenic cells shows that K9I and K9M histone H3 transgenes lead to lower levels of H3K9me2 and H3K9me2/3, respectively, whereas cell lines containing K9A, K9L, and K9R transgenes showed little or no reduction in overall levels of H3K9me2/3 (Fig. 1A). The ectopically expressed histones make up less than 5% of total histone H3 as measured by immunoblot, indicating a robust dominant negative effect by the transgenes. The immunoblot results from the panel of H3K9 substitutions resemble those that we obtained with H3K27 substitutions (7), suggesting that K9M/I and K27M/I share a common inhibition mechanism of their respective methyltransferases.
Fig. 1.
Comparison of K9X transgenes and peptides with regard to reduction of K9 methylation and G9a inhibition. (A) Immunoblots of whole-cell lysates from lentivirus-transduced 293T cells expressing H3.3 WT, K9A, K9I, K9L, K9M, or K9R transgenes. (B) Immunoblots of affinity-purified heterotypic mononucleosomes from lentivirus-transduced 293T cells expressing the indicated epitope-tagged H3.3 transgenes. (C) Immunoblot of whole-cell lysates from lentivirus-transduced 293 cells expressing FLAG-HA–tagged WT H3.2 and untagged H3.3 WT, K9M, or K9R transgenes. (D) Immunoblot of affinity-purified heterotypic mononucleosomes from cells expressing epitope-tagged H3.2 transgenes as well as the indicated untagged H3.3 transgenes. (E) IC50 measurement for the indicated K9X peptides. In vitro methyltransferase assay was carried out under saturating conditions as a titration of K9X peptides with G9a–SET and H31–20 unmodified peptide. Methyltransferase activity was quantified by scintillation and normalized. Error bars represent the SD of two replicates. (F) Summary of IC50 and R2 values determined for experiment described in E. n. d., not determined.
Immunoblot analyses of immunoprecipitated heterotypic mononucleosomes (containing approximately a 1:1 ratio of endogenous H3.3 and H3.3 K9M-FLAG-HA) from the transgenic cell lines indicated that the H3.3 K9M transgene primarily led to loss of higher-order K9 methylation (H3K9me2/3), whereas levels of H3K9me1 showed only a modest reduction (Fig. 1B). The global reduction in H3K9me2/3 suggested that the H3K9M histone reduced methylation on endogenous WT H3 histones. Indeed, purified heterotypic mononucleosomes (containing both H3.2-FLAG-HA and endogenous H3) from cells expressing H3.3 K9M displayed a marked decrease in H3K9me2/3 (Fig. 1 C and D). These results are similar to those obtained from immunoprecipitation of mononucleosomes from cells expressing H3.3 K27M that showed a decrease in H3K27 methylation in trans (7).
Using in vitro histone methyltransferase assays, we found that H31–20 peptides containing K9I, K9M, or the norleucine (Nle) derivative K9Nle inhibited G9a methyltransferase activity (Fig. 1 E and F). These biochemical results parallel our in vivo findings that K9M and K9I amino acid substitutions produced a robust decrease in cellular levels of higher-order K9 methylation. Moreover, we found that the K9Nle peptide is a more potent inhibitor than the K9M or K9I peptides. Previously, we showed that H3K27 peptides containing Nle, a leucine isomer, were potent inhibitors of PRC2 activity in vitro (5, 7). The extended, unbranched aliphatic side chain of Nle likely makes superior interactions with the aromatic and hydrophobic residues that line the SET domain active site.
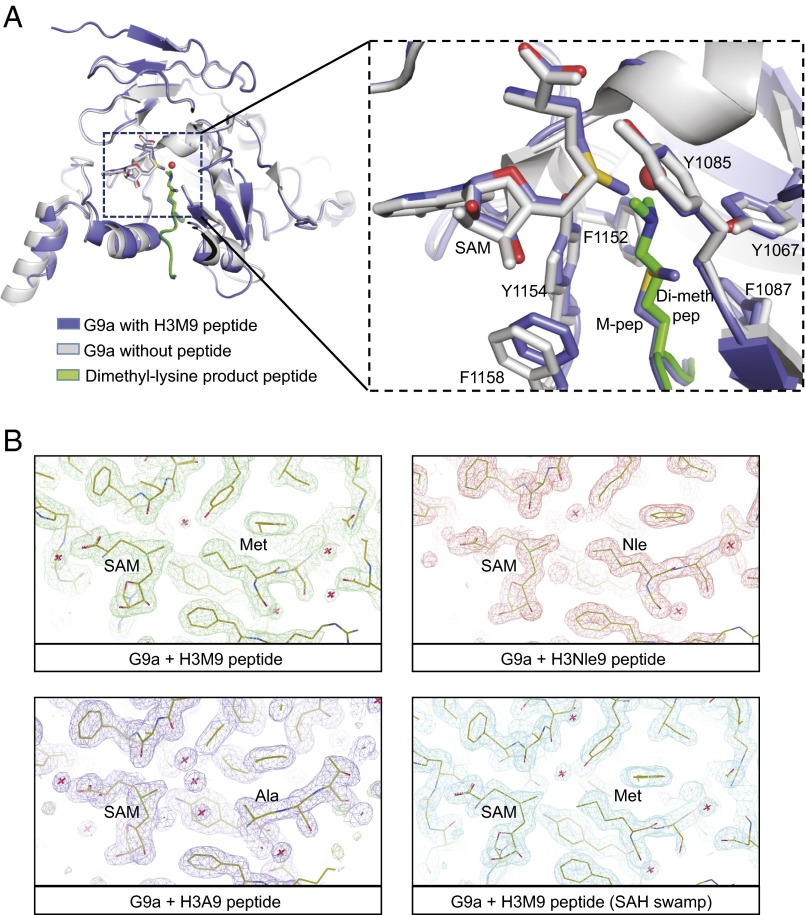
To assess whether structural alterations of the G9a active site are involved in the remarkably potent inhibitory activity of H3K9M both in vitro and in vivo, we determined the structures of the G9a–SET domain with H3K9M, H3K9Nle, and H3K9A containing peptides (Fig. 2). These structures were compared with the structures of G9a with bound S-adenosyl homocysteine (SAH) and the structure of the closely related (∼77% identity) complex of G9a-like protein with bound mono- and dimethylated histone peptide. The cocrystal structure of G9a with the H3K9M-containing peptide at 1.85-Å resolution (Table S1) showed clear electron density for both the mutant methionine residue and the surrounding peptide. Comparison with the structure of G9a with bound SAH [Protein Data Bank (PDB) ID code 2O8J] revealed surprisingly few differences (0.343 Å2) overall as well as with regard to the residues surrounding the cofactor and substrate binding sites (0.445 Å2). Comparison with the product peptides bound to GLP [PDB ID codes 3HNA (GLP-H3K9me1) and 2RFI (GLP-H3K9me2)] reveals an almost identical conformation of the peptide backbones, with overall rmsd of ∼0.6 Å2 (Fig. 2A). Examination of the conformation of the mutant methionine residue bound to G9a with the product dimethyl-lysine showed that the two adopt a virtually identical conformation in the substrate binding site with their Cα through Cε carbon atoms superimposed perfectly, suggesting that the mechanism for methionine inhibition results from a direct competition for the peptide substrate binding site.
Fig. 2.
Cocrystal structures of mutant H3 peptides with G9a. (A) Comparison of G9a protein cocrystallized with H3K9M peptide (blue) with G9a bound with SAH and no peptide (2O9S) (gray). Also superimposed for purposes of comparison is the dimethyl-lysine product peptide alone (green) from GLP (ID code 2RFI). (B) Experimental electron density (2mFo-Dfc) maps calculated using Sigmaa for the H3K9M, H3K9Nle, and H3K9A crystallization experiments. Also shown in Lower Right is an experiment where, in addition to the H3K9M peptide, a 50-fold molar excess of SAH was added to the crystallization experiment to determine if the bound SAM could be “swamped” out by SAH.
Table S1.
Data collection and refinement statistics (molecular replacement)
| Peptide (PDB ID) | G9a–Met (5JIN) | G9a–Nle (5JIY) | G9a–Ala (5JHN) | G9a–Met–SAH (5JJ0) |
| Data collection | ||||
| Space group | P 1 21 1 | P 1 21 1 | P 1 21 1 | P 1 21 1 |
| Cell dimensions | ||||
| a, b, c (Å) | 56.43, 78.68, 72.77 | 56.61, 78.46, 73.08 | 56.78, 78.27, 73.12 | 56.67, 78.31, 73.06 |
| α, β, γ (°) | 90.00, 90.69, 90.00 | 90.00, 90.28, 90.00 | 90.00, 90.34, 90.00 | 90.00, 90.20, 90.00 |
| Resolution (Å) | 1.85 (1.85–1.92)* | 1.48 (1.48–1.53) | 1.67 (1.67–1.83) | 1.73 (1.73–1.79) |
| Rsym or Rmerge | 7.2 (63.7) | 7.6 (72.5) | 6.8 (68.5) | 10.4 (70.3) |
| I/σI | 14.87 (1.75) | 14.15 (2.0) | 16.67 (2.0) | 10.13 (2.2) |
| Completeness (%) | 98.4 (97.6) | 99.6 (99.3) | 99.19 (93.86) | 98.73 (87.49) |
| Redundancy | 3.8 (3.8) | 3.7 (3.7) | 3.7 (3.7) | 3.6 (3.7) |
| Refinement | ||||
| Resolution (Å) | 1.85 | 1.48 | 1.67 | 1.73 |
| No. reflections | 42,119 | 100,580 | 70,175 | 63,270 |
| Rwork/ Rfree | 0.2007/0.2372 | 0.2079/0.23241 | 0.21034/0.23740 | 0.2084/0.2424 |
| No. atoms | ||||
| Protein | 4,511 | 4,511 | 4,505 | 4,511 |
| Ligand/ion | 62 | 62 | 62 | 62 |
| Water | 174 | 137 | 151 | 133 |
| B factors | ||||
| Protein | 46.52 | 27.68 | 36.29 | 31.57 |
| Ligand/ion | 45.044 | 14.664 | 28.85 | 26.45 |
| Water | 43.575 | 26.731 | 32.47 | 30.29 |
| rmsds | ||||
| Bond lengths (Å) | 0.017 | 0.019 | 0.018 | 0.018 |
| Bond angles (º) | 1.757 | 1.962 | 1.884 | 1.884 |
There was a single crystal used for each data set
Highest resolution shell is shown in parenthesis.
Strikingly, despite an overall similarity in the conformation of peptide and surrounding residues, the crystallized G9a–K9M complex exhibited complete occupancy of SAM within the cofactor binding pocket. The structures of G9a and GLP used in our comparisons consistently show occupancy of the cofactor binding pocket by SAH, the expended cofactor product that results after methylation. The surprising complete occupancy for SAM was even more notable, because no additional SAM was added at any stage of the protein production, purification, or crystallization from bacterially expressed G9a protein. We hypothesize that our G9a protein preparation contains a mixture of SAH- and SAM-bound G9a populations and that, despite the inferred low abundance of SAM-bound G9a used in the cocrystallography experiments, the structure of G9a with the mutant methionine histone peptide results from an enrichment of the SAM-bound population in the cofactor binding pocket.
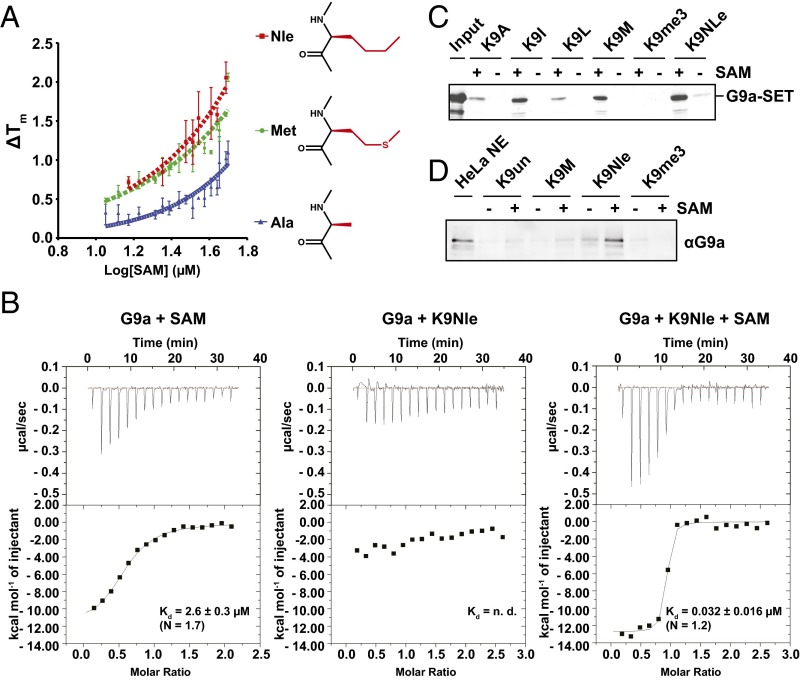
In addition to observing full SAM occupancy in the H3K9M mutant cocrystal structures, we also observed full SAM occupancy in the H3K9Nle and H3K9A cocrystal structures (Fig. 2B). Furthermore, adding a high concentration of SAH during cocrystallization of G9a with the H3K9M mutant did not decrease the SAM occupancy of the structure. A comparison of the peptide complex structures with each other showed that they were highly similar to each other (0.18–0.21 Å2 rmsd), and all showed complete occupancy for SAM in the active site. The bound SAM molecules were superimposable across all four structures. The cooccupancy of SAM in the G9a–H3K9M structure suggested that SAM may be necessary for stable interaction between G9a and the K9M peptide. To explore whether SAM is required for K9M peptide interaction with G9a, a variety of in vitro assays were performed. First, we characterized the relative binding affinities of SAM-bound G9a to the mutant peptide by differential scanning fluorimetry, where an increase in the melting temperature (Tm) for a protein ligand complex correlates with the tightness of binding. Fig. 3A shows the titration of G9a at constant peptide concentration and varying SAM. The nonlinear increase of melting temperature (∆Tm) with increasing SAM concentrations implies a level of cooperativity in the interaction of SAM and mutant histone peptides. The Tm vs. SAM concentration curve for the K9Nle peptide was the steepest followed by K9M, whereas the K9A peptide curve showed only a modest upward slope. This finding suggests that the Nle peptide had the most favorable interaction with G9a and SAM and that the alanine peptide had the least SAM dependence. This trend is consistent with their respective inhibitory activities in vitro and in vivo.
Fig. 3.
SAM dependence of binding of inhibitory K9X peptides to G9a. (A) Plot of differential scanning fluorimetry-determined melting temperature change with respect to apo-G9a (∆Tm) for H3K9Nle, H3K9M, and H3K9A peptides at varying concentrations of SAM. (B) Isothermal titration calorimetry analysis of Nle binding to G9A. (Left) G9A after turnover and dialysis binds SAM with low-micromolar affinity (the divergence of N from one is likely caused by being done under “low-C” conditions). (Center) After dialysis, G9A does not bind Nle peptide in the absence of SAM. (Right) Addition of 1 mM SAM causes potent Nle binding. (C) Peptide pulldown assay was performed using recombinant G9a–SET and streptavidin agarose beads coupled to the indicated C-terminally biotinylated H31–20 K9X peptides. Where indicated, SAM was present throughout the binding and washing process. Bands were visualized by Coomassie staining. (D) Peptide pulldown assay was performed using HeLa nuclear extract and streptavidin agarose beads coupled to the indicated C-terminally biotinylated H31–20 K9X peptides. Where indicated, SAM was present throughout the binding and washing process. Immunoblot using anti-G9a antibody is shown.
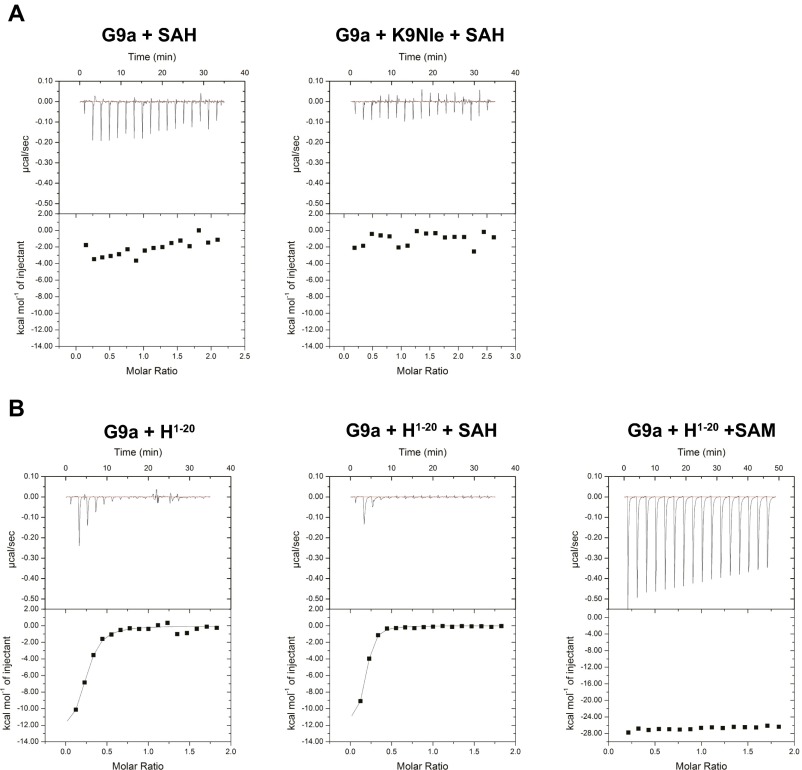
Next, we used isothermal titration calorimetry to assess the SAM and SAH dependency of the G9a–K9Nle peptide interaction and determine the dissociation constants for the interaction. Before analysis, G9a was treated with substrate peptide to convert bound SAM into SAH and subsequently dialyzed. Although G9a bound SAM alone with a Kd of 2.6 µM (Fig. 3B, Left), G9a did not bind K9Nle peptide after dialysis (Fig. 3B, Center). However, a robust interaction (Kd = 0.032 µM) between G9a and the K9Nle peptide was observed in the presence of added SAM (Fig. 3B, Right). In contrast, G9A did not bind SAH when assessed as for SAM binding, and even when present at 1 mM, SAH did not promote binding of K9Nle peptide (Fig. S1A). These data indicate that SAM is a necessary cofactor in the stable association between G9a and K9M/Nle peptides. Isothermal titration calorimetry analysis of K9 substrate also suggested the necessity of SAM for binding but was complicated by turnover at the high substrate/enzyme concentrations (Fig. S1B). These data are consistent with a proposed model where SAM facilitates folding of the G9a post-SET domain, which forms part of the peptide binding site for H3K9 (18). We, furthermore, performed peptide pulldown assays to assess the SAM dependency of interaction between various histone H3K9X peptides and the SET domain of G9a (Fig. 3C). In this experiment, histone H3 peptides that inhibited G9a activity in vitro (K9I, M, and Nle) bound to relatively more recombinant G9a–SET than peptides that displayed weak inhibitory activity (K9L and K9A). Additionally, all K9-substituted peptides displayed increased binding to G9a–SET when SAM was present during both binding and washes as opposed to SAM being absent.
Fig. S1.
ITC analysis of K9 substrate binding to G9A. (A, Left) G9A does not bind SAH. (A, Right) Addition of 1 mM SAH does not engender Nle binding. (B, Left) G9A after turnover and dialysis does not bind substrate (the weak initial signal is well below stoichiometric). (B, Center) Inclusion of 1 mM SAH does not promote K9 substrate binding. (B, Right) Inclusion of 1 mM SAM results in a strong signal response, likely reflecting both binding and subsequent turnover and not allowing a Kd to be derived.
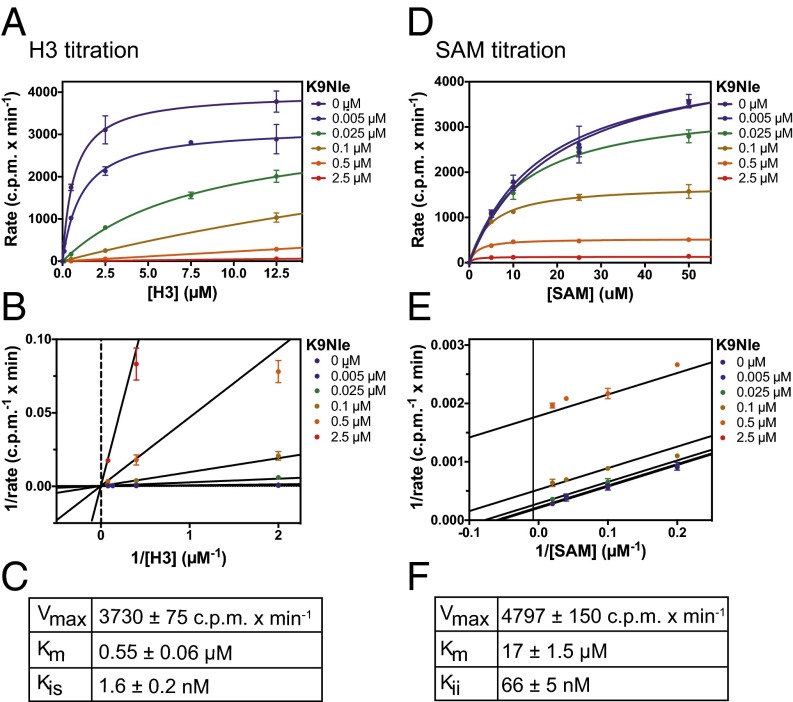
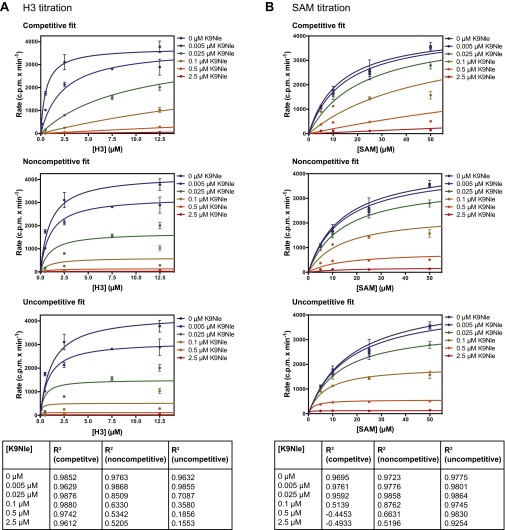
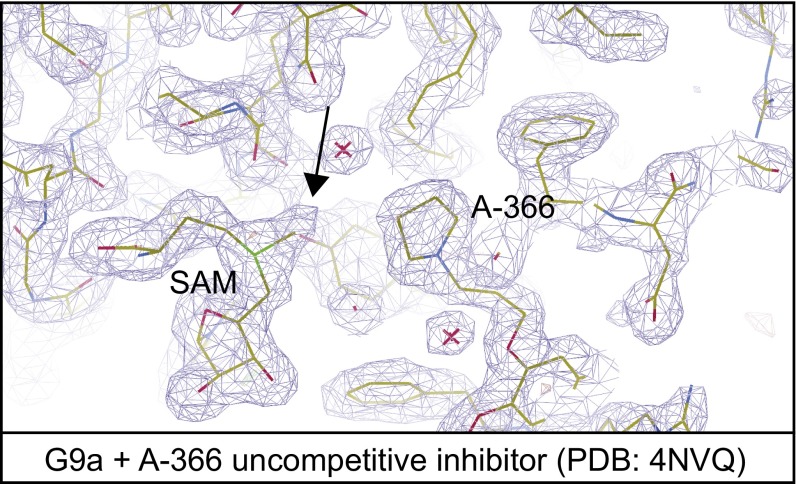
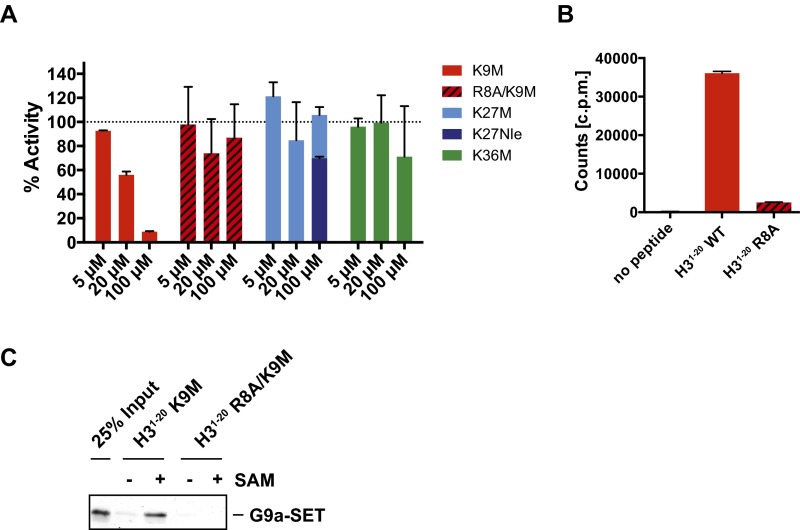
We next determined the detailed mechanism of action and Michaelis–Menten kinetic parameters associated with both the peptide and SAM as a function of K9Nle concentration. In past work, oxidation of methionine was found to decrease the potency of K27M peptides (5). In an effort to maintain consistency between experiments, we chose to use K9Nle in our kinetic assays, because it is a methionine isostere that is not oxidized. These experiments confirmed that K9Nle was competitive with the peptide substrate, because the Km of the peptide increased linearly with the K9Nle concentration (Fig. 4 A–C and Fig. S2). The K9Nle peptide was uncompetitive with cofactor SAM, because both the apparent Km of SAM and the Vmax decreased as the peptide concentration increased (Fig. 4 D–F). Previous studies identified small molecules that inhibited G9a and other SET domain methyltransferases in an uncompetitive manner with respect to SAM (19–22). A detailed analysis of available crystallography data revealed that these uncompetitive compounds also selectively bound to SAM-occupied G9a like the peptides used in our study (Fig. S3). These data are consistent with the necessity of SAM for interaction between G9a and K9 peptides. The competitive mode of inhibition with regard to H3 peptide suggests that K-to-M oncohistones need to mimic the endogenous substrate to effectively bind to SET domain enzymes. Together with K9, arginine 8 (R8) on histone H3 peptides was reported to be necessary for both binding and catalysis by G9a (23). We assessed whether R8 was required for inhibition of G9a by K9M peptides. We found that K9M peptides containing an R8A substitution failed to both inhibit and interact with G9a in an SAM-dependent manner (Fig. S4). These findings strongly support the competitive inhibition model for H3K9M with regard to the peptide substrate.
Fig. 4.
Kinetic analysis of G9a inhibition by K9Nle with regard to H3 and SAM dependency. (A–C) Steady-state kinetics of G9a–SET with constant SAM and titration of H31–20 unmodified peptide at different K9Nle peptide concentrations. Data are represented as a Michaelis–Menten plot (A) and a Lineweaver–Burk plot (B). Data were fitted (using nonlinear least squares) to the equation for competitive inhibition (black lines) and yielded a Kis of 1.6 ± 0.2 nM (C). Error bars represent SD of two replicates. (D–F) Steady-state kinetics of G9a–SET with constant H3 and titration of SAM at different K9Nle concentrations. Data are represented as a Michaelis–Menten plot (D) and a Lineweaver–Burk plot (E). Data were fitted (using nonlinear least squares) to the equation for uncompetitive inhibition (black lines) and yielded a Kii of 66 ± 5 nM (F). Error bars represent SD of two replicates.
Fig. S2.
Fitting kinetic data to different modes of inhibition. (A) Steady-state kinetics of G9a–SET with constant SAM and titration of H31v20 unmodified peptide at different K9Nle peptide concentrations. Data were fitted to different modes of inhibition using GraphPad Prism 6. R2 values for each fit are shown in the table. (B) Steady-state kinetics of G9a–SET with constant H3 and titration of SAM at different K9Nle concentrations. Data were fitted to different modes of inhibition using GraphPad Prism 6. R2 values for each fit are shown in the table.
Fig. S3.
Electron density map contoured at 1.2σ for A-366 uncompetitive inhibitor rerefined against deposited experimental data (PDB ID code 4NVQ). The arrow shows the clear density for the SAM methyl group in the map calculated after refinement.
Fig. S4.
Analysis of the importance of arginine 8 (R8) in H3 for inhibition of G9a by K9M. (A) In vitro methyltransferase assays with recombinant G9a–SET, substrate H31–20 unmodified peptide, and radioactive SAM. Different concentrations of 20-mer K9M, R8A/K9M, K27M, K27Nle, or K36M peptides were present in the reaction as indicated. Methyltransferase activity was quantified by scintillation and normalized. (B) In vitro methyltransferase assays using either H31–20 WT or H31–20 R8A as the substrate peptide alongside a “no peptide” control. Methyltransferase activity was quantified by scintillation. (C) Peptide pulldown assay was performed using recombinant G9a–SET and streptavidin agarose beads coupled to the indicated C-terminally biotinylated H31–20 K9M or R8A/K9M peptides. Where indicated, SAM was present throughout the binding and washing process. Bands were visualized by Coomassie staining.
Discussion
Multiple lines of biochemical and cellular evidence converge on the idea that K-to-M oncohistones function as potent orthosteric inhibitors of SET domain-containing lysine methyltransferases. Our studies to date indicate that K-to-M oncohistones decrease levels of histone methylation through a trans mechanism, suggesting that the oncohistone concentration rather than the genomic location is important for oncogenic potential. Indeed, the K27M mutation has been observed to occur in genes encoding all forms of histone H3 (H3.1, H3.2, and H3.3) in human glioma (1, 10, 24). Our study reveals a critical role for SAM in the sequestration of lysine methyltransferases by these inhibitory mutant histones.
Our G9a inhibitory peptide cocrystal structures reveal a striking similarity to the WT dimethylated end product peptide (however, with SAM instead of SAH bound in the cofactor binding pocket). The presence of SAM in our G9a–peptide complex structures was striking compared with the SAH occupying the WT structure with bound peptide. Taken together, these results suggest that K-to-M oncohistones interact with G9a and likely other lysine methyltransferases in their SAM-occupied state with a far greater affinity than in their SAH-occupied state. This stable ternary complex could also nucleate and crystallize readily, which possibly explains our failure to observe SAH-bound complex structures, despite growing crystals with the inhibitory peptide in the presence of a large excess of SAH (Fig. 2B). Indeed, a recent publication describing the first high-resolution X-ray crystal structure of PRC2 revealed that addition of the K27M peptide was necessary for crystallization (25).
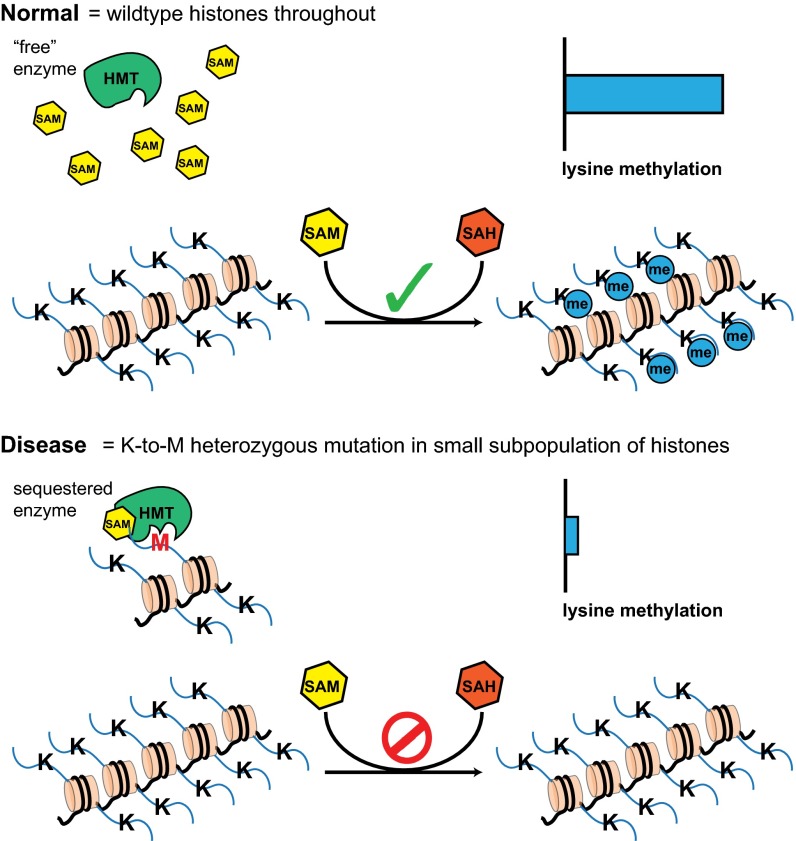
Our structural and biochemical data suggest that G9a binds the inhibitory peptides in an SAM-dependent manner with a cooperativity with a trend that matches the inhibitory activity of the peptides with Nle > Met >> Ala. The resulting cooperative interaction of SAM-bound G9a with the K9 peptides leads us to postulate a model, in which sequestration of SAM-bound methyltransferases may drive the reduction in the levels of methylation on the WT copy (Fig. 5).
Fig. 5.
Model for sequestration and inhibition of histone lysine methyltransferases (HMTs) by oncohistones. Under normal conditions, HMTs catalyze the transfer of methyl groups from SAM to specific lysine residues on histones. In cells expressing K-to-M oncohistones, the high affinity of SAM-bound HMTs for oncohistone tails results in sequestration of the enzymes onto the mutant histone, whereas HMT cannot bind the K-to-M histone in the absence of SAM. The effective decrease of catalytically active HMTs results in a global reduction of histone methylation.
The extraordinary cooperative binding for SAM and the inhibitory peptides indicates that G9a bound to SAM has a significantly higher affinity for inhibitory peptides bearing the K-to-M mutation. We propose that the increased affinity of the K-to-M histone to specific SET domain methyltransferases in the presence of SAM likely leads to sequestration of the enzymes onto oncohistone-containing nucleosomes in tumor cells (Fig. 5). The cooperativity coupled with the IC50 for the inhibitory peptides make it likely that a small population of oncohistone could exert a striking reduction in the levels of SAM-bound methyltransferase molecules, resulting in a marked reduction in histone methylation levels. As previously noted, the low-micromolar concentrations that oncohistones can achieve in tumor cell nuclei exceed the observed in vitro IC50 for these inhibitory peptides (5, 7, 26).
The H3K27M mutation, which is observed in midline gliomas, may be even more susceptible to such inhibition, because PRC2 is the sole methyltransferase that methylates histones at lysine 27. The cooperativity of the SAM–PRC2–K27M interaction may allow a small population of mutant histones to effectively sequester active enzyme and result in a global reduction of H3K27me2/3. Our previous work indicates that the presence of several histone posttranslational modifications in the H3 tail, both proximal and distal to K27, was able to neutralize the toxic effect of the K27M mutation (5). Our observation of SAM-bound enzyme for both mutant peptides and previously reported inhibitory compounds suggests that engaging the substrate channel allows for an uncompetitive interaction with SAM and possibly, helps enhance the cellular potency of some SET domain binding inhibitors reported in the literature. Based on our studies modeled with G9a, we predict that altering the SAM:SAH ratio or lowering cofactor levels in the nucleus may lower the inhibitory potency of K-to-M oncohistones. Importantly, this strategy may provide an alternative intervention strategy for oncohistone-driven cancers brought about, in part, by the sequestration of active methyltransferases.
Materials and Methods
Structure Determination.
G9a–SET at 33 mg/mL was mixed with peptides at a 1:3 stoichiometric ratio of protein:peptide. The protein mixture was crystallized against a mother liquor containing 0.2 M triammonium citrate (pH 7) and 20% (wt/vol) PEG 3350 using the sitting drop methodology. Data were collected at the Argonne National Laboratory Advanced Photon Source, Life Science Collaborative Access Team Beamline 21-ID-G and the Canadian Light Source CMCF-BM Beamline. The data processing statistics are given in SI Materials and Methods. Diffraction data were phased by molecular replacement using the apo-G9a as a model (PDB ID code 2O8J). Crystallographic analysis was carried out using the CCP4 Suite of crystallographic programs followed by model building in Coot and visualization in PyMol.
In Vitro Histone Methyltransferase Assay for G9a Enzymatic Activity in the Presence of Different K9X Peptides.
Unmodified H31–20 peptide (23 µM) was incubated with 25 nM G9a–SET in the presence of 50 µM SAM (radioactive:nonradioactive molar ratio = 0.016) in a buffer containing 50 mM Hepes (pH 7.9), 0.5 mM DTT, 0.25 mM PMSF, and 2 mM MgCl2. Where applicable, different H31–20 K9X peptides (Tufts University Peptide Synthesis Core) were present in the reaction. Inhibitor peptides were present together with enzyme and substrate peptide before the reaction start, and reactions were initiated by the addition of SAM. Reactions were carried out at 30 °C for 1 h. Reactions were stopped by spotting on P81 nitrocellulose filters (Whatman), and filters were washed three times with 100 mM sodium bicarbonate, dipped into acetone, and air-dried. For assay quantification, radioactivity retained on the filter was counted using a Tri-Carb 2910 TR Liquid Scintillation Analyzer (PerkinElmer). IC50 data were obtained by logarithmic conversion of [K9X] fitting to the log(inhibitor) vs. normalized response function in GraphPad Prism 6.
Detailed information regarding the reagent assembly and assay conditions can be found in SI Materials and Methods.
SI Materials and Methods
Protein and Peptide Purification.
The SET domain of human G9a protein (EHMT2_HUMAN:N913-D1193; EC 2.1.1.43) was expressed and purified from Escherichia coli. The expressed 6-His–tagged protein was purified by Ni2+ affinity followed by tag cleavage and cation exchange chromatography and dialyzed and concentrated to 33 mg/mL into a buffer with 20 mM Hepes (pH 8), 300 mM NaCl, and 1 mM tris(2-carboxyethyl)phosphine. Peptides H3K9M (H3.1:3–13 TKQTARMSTGG), H3K9Nle (H3.1:3–13 TKQTARNleSTGG), and H3K9A (H3.1:3–13 TKQTARASTGG) were ordered from Tufts University Peptide Synthesis Core and resuspended in the protein buffer at 50 mM stock concentrations.
Cell Culture and Generation of Stable Cell Lines.
293T cells were cultured in DMEM (Gibco) with 10% (vol/vol) FBS (Gibco). To generate 293T cells stably expressing various histone mutants, cells were transduced with H3.3-FLAG-HA–expressing lentivirus and grown under puromycin selection (2 µg/mL); 293 cells were culture in DMEM with 10% (vol/vol) Fetalgro (RMBIO), and 293 cells stably transduced with H3.2-FLAG-HA–expressing lentivirus and different H3.3-untagged lentiviruses were grown under neomycin (0.8 mg/mL) and puromycin (2 µg/mL) selection.
Nucleosome Purification.
Cell nuclei were isolated using a hypotonic buffer (5 mM Hepes, 10 mM KCl, 5 mM MgCl2, 0.5 mM EDTA, 1 mM β-mercaptoethanol (BME), 0.4 mM PMSF, 1 mM benzamidine, 1 mM sodium metabisulfite) followed by centrifugation at 2,000 × g. Nuclei were resuspended in 30 mL buffer A (15 mM Hepes, 30 mM KCl, 3 mM CaCl2, 3 mM MgCl2, 1 mM BME, 0.4 mM PMSF) and incubated with micrococcal nuclease for 15 min. Ca2+ ions were chelated by adding EDTA, EGTA, and KCl to final concentrations of 5, 3, and 300 mM, respectively, to stop micrococcal nuclease reaction. HA-FLAG–tagged H3.3 containing mononucleosomes were purified by incubating with αFLAG M2 beads for 2 h. Mononucleosomes were recovered from the beads by eluting with 3X-FLAG peptide at 500 ng/µL in a buffer containing 20 mM Hepes, 1 mM EDTA, 10% (vol/vol) glycerol, 150 mM NaCl, 0.01% Nonidet P-40, 1 mM BME, and 0.4 mM PMSF. The final NaCl concentration was brought down to 50 mM using dialysis.
Immunoblotting.
Purified mononucleosomes or cell lysates were separated by SDS/PAGE, transferred to nitrocellulose membrane, blocked in 5% (wt/vol) nonfat milk in Tris-buffered saline plus 0.5% Tween-20, incubated with primary antibodies, and detected with HRP-conjugated anti-rabbit or anti-mouse secondary antibodies (BioRad). Primary antibodies used were anti-H3 general (Proteintech), anti-H3.1/H3.2 (in house), anti-H3.3 (09–838; Millipore), anti-HA (clone 12CA5), anti-H3.3K9M (gift from Millipore), anti-K9me1 (07–450; Millipore), anti-K9me2 (07–441; Millipore), anti-K9me2 (in house), anti-H3K9me3 (ab8898; Abcam), anti-H3K9me3 (39161; Active Motif), anti-K9ac (39917; Active Motif), anti-H3S10ph (in house), anti-H3K27me3 (07–449; Millipore), and anti-G9a (MA5-14880; Thermo Fisher).
Differential Scanning Fluorimetry.
G9a at 4 µM was incubated with increasing concentrations of SAM (0–50 µM) with the peptide at 100 µM. Sypro Orange dye was added to a final concentration of 8× in a reaction volume of 20 µL, and the melting temperature was determined by increasing the temperature from 25 °C to 97.5 °C at a rate of 0.32 °C/min in a ViiA7 Thermal Cycler Instrument (Life Technologies) in the 384-well format. The melting curve was fitted to a Boltzman single-state melting curve using the Protein Thermal Shift software included with the instrument. The ∆Tm values were subject to nonlinear fits in GraphPad Prism.
Steady-State G9a Enzyme Kinetics of K9Nle Inhibition.
For H3 titration, 25 nM G9a–SET was incubated with 50 µM SAM (radioactive:nonradioactive molar ratio = 0.0016) in the presence of increasing concentrations (0–12.5 µM) of unmodified H31–20 peptide in a buffer containing 50 mM Hepes (pH 7.9), 0.25 mM DTT, 0.25 mM PMSF, and 2 mM MgCl2. For SAM titration, 25 nM G9a–SET was incubated with 23 µM unmodified H31–20 peptide in the presence of increasing concentrations (0–50 µM) of SAM (radioactive:nonradioactive molar ratio = 0.016) under the same buffer conditions. Reactions were incubated for 4 min at 30 °C in the presence of varying concentrations (0–2.5 µM) of K9Nle peptide (Tufts University Peptide Synthesis Core). Inhibitor peptides were present together with enzyme and substrate peptide before the reaction start, and reactions were initiated by addition of SAM. Quantification of the radioactive signal was performed as described above. The mode of inhibition was determined by fitting the data to the equations of competitive, noncompetitive, or uncompetitive inhibition using nonlinear squares using KinetAsyst (IntelliKinetics).
Peptide Pulldown Using Recombinant G9a–SET.
Overnight, 1.32 μg (3× molar excess) each C-terminally biotinylated H31–20 peptide per 1 µL packed streptavidin agarose beads was incubated at 4 °C in PBS with 0.01% Nonidet P-40. Beads were subsequently washed six times with PBS and 0.01% Nonidet P-40 to remove the excess peptides. To remove copurified SAM from G9a preparation, 0.33 μg unmodified H3K9 peptide (1:1 molar ratio) was incubated with 3.3 μg G9a protein in 50 mM Hepes, 1 mM DTT, and 1× Protease Inhibitor Mixture for 15 min at 37 °C. For peptide binding, 3.3 μg G9a was incubated with 15 μL beads in 20 mM Hepes, 50 mM NaCl, 0.01% Nonidet P-40, 1 mM BME, and 0.4 mM PMSF in the presence or absence of 10 μM SAM for 2 h at 4 °C. Beads were washed with 20 mM Hepes, 50 mM NaCl, 0.01% Nonidet P-40, 1 mM BME, and 0.4 mM PMSF with or without 10 µM SAM. Bound G9a was then eluted with 100 mM glycine and 150 mM NaCl. Eluates were analyzed by SDS/PAGE and visualized with Coomassie staining.
Peptide Pulldown of Endogenous G9a from HeLa Nuclear Extract.
Nuclear extract from HeLa cells was prepared as described previously (7). Buffer composition of the nuclear extract was 20 mM Hepes (pH 7.9), 125 mM KCl, 1 mM EDTA, 10% (vol/vol) glycerol, 0.01% Nonidet P-40, 0.4 mM PMSF, and 2 mM BME. To 1 mL nuclear extract, 15 µL packed streptavidin agarose beads coupled to various H31–20 peptides were added and incubated while rotating at 4 °C for 3 h. Depending on the assay condition, 200 µM SAM were present during this incubation. Beads were subsequently washed four times with wash buffer containing 20 mM Hepes, 325 mM NaCl, 0.01% Nonidet P-40, 2 mM BME, and 0.4 mM PMSF in the presence or absence of 100 µM SAM. Bound G9a was, then, eluted with 70 mM glycine and 150 mM NaCl. Eluates were analyzed by SDS/PAGE and visualized by immunoblot with anti-G9a antibody.
Isothermal Titration Calorimetry.
Isothermal titration calorimetry (ITC) measurements were made on a MicroCal ITC200 Instrument (Malvern Instruments). G9A and H31–20 (200 and 250 µM, respectively; 100 μL volume) were incubated together for 30 min at room temperature in ITC buffer [50 mM Hepes (pH 7.5), 150 mM NaCl], then dialyzed overnight at 4 °C against the same (1.1 L), and clarified by passage through a 0.22-µm Spin-X Tube (Corning, Inc.). The protein concentration was determined by A280 on a NanoDrop Instrument (Thermo Scientific). K9Nle (15 µM in ITC buffer) was equilibrated in the cell (200 µL volume; 25.0 °C; stirrer speed of 750 rpm; 11 µcal/s reference power), and G9A (150 µM in ITC buffer) was titrated into the cell in a series of 16 2.4-µL injections with durations of 4.8 s each and an equilibration period of 120 s between injections. This titration was preceded by an initial injection of 0.6 µL, which was omitted from analysis. The resulting data were fitted using the instrument’s Origin 7.0 software. Binding of SAM or SAH was assessed in the same manner. In the peptide binding experiments conducted in the presence of SAM or SAH, the cofactor was present in both the syringe and the cell at 1 mM concentration. (Note that, because of the graphics associated with the Origin software, the x axis on the plots is the reciprocal of N when the protein is in the syringe and the peptide is in the cell.) The K9 substrate experiments ± SAM/SAH were carried out in a similar manner but with the protein (15 μM) in the cell and the peptide (150 μM) in the syringe.
Acknowledgments
The authors thank Jessica Feldman and John Denu for productive discussions. This work was funded by Starr Cancer Consortium Grant SCC I6-A614 (to C.D.A.), NIH Grant P01CA196539 (to C.D.A. and P.W.L.), Sidney Kimmel Foundation Kimmel Scholar Award (to P.W.L.), Greater Milwaukee Foundation Shaw Scientist Award (to P.W.L), and startup funds provided by the Wisconsin Institute for Discovery (to P.W.L.). D.H. is supported by a Boehringer Ingelheim Fonds Predoctoral Fellowship.
Footnotes
The authors declare no conflict of interest.
This article contains supporting information online at www.pnas.org/lookup/suppl/doi:10.1073/pnas.1605523113/-/DCSupplemental.
References
- 1.Schwartzentruber J, et al. Driver mutations in histone H3.3 and chromatin remodelling genes in paediatric glioblastoma. Nature. 2012;482(7384):226–231. doi: 10.1038/nature10833. [DOI] [PubMed] [Google Scholar]
- 2.Wu G, et al. St. Jude Children’s Research Hospital–Washington University Pediatric Cancer Genome Project The genomic landscape of diffuse intrinsic pontine glioma and pediatric non-brainstem high-grade glioma. Nat Genet. 2014;46(5):444–450. doi: 10.1038/ng.2938. [DOI] [PMC free article] [PubMed] [Google Scholar]
- 3.Behjati S, et al. Distinct H3F3A and H3F3B driver mutations define chondroblastoma and giant cell tumor of bone. Nat Genet. 2013;45(12):1479–1482. doi: 10.1038/ng.2814. [DOI] [PMC free article] [PubMed] [Google Scholar]
- 4.Bender S, et al. Reduced H3K27me3 and DNA hypomethylation are major drivers of gene expression in K27M mutant pediatric high-grade gliomas. Cancer Cell. 2013;24(5):660–672. doi: 10.1016/j.ccr.2013.10.006. [DOI] [PubMed] [Google Scholar]
- 5.Brown ZZ, et al. Strategy for “detoxification” of a cancer-derived histone mutant based on mapping its interaction with the methyltransferase PRC2. J Am Chem Soc. 2014;136(39):13498–13501. doi: 10.1021/ja5060934. [DOI] [PMC free article] [PubMed] [Google Scholar]
- 6.Brown ZZ, Müller MM, Kong HE, Lewis PW, Muir TW. Targeted histone peptides: Insights into the spatial regulation of the methyltransferase PRC2 by using a surrogate of heterotypic chromatin. Angew Chem Int Ed Engl. 2015;54(22):6457–6461. doi: 10.1002/anie.201500085. [DOI] [PMC free article] [PubMed] [Google Scholar]
- 7.Lewis PW, et al. Inhibition of PRC2 activity by a gain-of-function H3 mutation found in pediatric glioblastoma. Science. 2013;340(6134):857–861. doi: 10.1126/science.1232245. [DOI] [PMC free article] [PubMed] [Google Scholar]
- 8.Bechet D, et al. Specific detection of methionine 27 mutation in histone 3 variants (H3K27M) in fixed tissue from high-grade astrocytomas. Acta Neuropathol. 2014;128(5):733–741. doi: 10.1007/s00401-014-1337-4. [DOI] [PMC free article] [PubMed] [Google Scholar]
- 9.Venneti S, et al. A sensitive and specific histopathologic prognostic marker for H3F3A K27M mutant pediatric glioblastomas. Acta Neuropathol. 2014;128(5):743–753. doi: 10.1007/s00401-014-1338-3. [DOI] [PMC free article] [PubMed] [Google Scholar]
- 10.Castel D, et al. Histone H3F3A and HIST1H3B K27M mutations define two subgroups of diffuse intrinsic pontine gliomas with different prognosis and phenotypes. Acta Neuropathol. 2015;130(6):815–827. doi: 10.1007/s00401-015-1478-0. [DOI] [PMC free article] [PubMed] [Google Scholar]
- 11.Tachibana M, Sugimoto K, Fukushima T, Shinkai Y. Set domain-containing protein, G9a, is a novel lysine-preferring mammalian histone methyltransferase with hyperactivity and specific selectivity to lysines 9 and 27 of histone H3. J Biol Chem. 2001;276(27):25309–25317. doi: 10.1074/jbc.M101914200. [DOI] [PubMed] [Google Scholar]
- 12.Di Giacomo M, Comazzetto S, Sampath SC, Sampath SC, O’Carroll D. G9a co-suppresses LINE1 elements in spermatogonia. Epigenetics Chromatin. 2014;7:24. doi: 10.1186/1756-8935-7-24. [DOI] [PMC free article] [PubMed] [Google Scholar]
- 13.Leung DC, et al. Lysine methyltransferase G9a is required for de novo DNA methylation and the establishment, but not the maintenance, of proviral silencing. Proc Natl Acad Sci USA. 2011;108(14):5718–5723. doi: 10.1073/pnas.1014660108. [DOI] [PMC free article] [PubMed] [Google Scholar]
- 14.Maksakova IA, et al. Distinct roles of KAP1, HP1 and G9a/GLP in silencing of the two-cell-specific retrotransposon MERVL in mouse ES cells. Epigenetics Chromatin. 2013;6(1):15. doi: 10.1186/1756-8935-6-15. [DOI] [PMC free article] [PubMed] [Google Scholar]
- 15.Chen MW, et al. H3K9 histone methyltransferase G9a promotes lung cancer invasion and metastasis by silencing the cell adhesion molecule Ep-CAM. Cancer Res. 2010;70(20):7830–7840. doi: 10.1158/0008-5472.CAN-10-0833. [DOI] [PubMed] [Google Scholar]
- 16.Huang J, et al. G9a and Glp methylate lysine 373 in the tumor suppressor p53. J Biol Chem. 2010;285(13):9636–9641. doi: 10.1074/jbc.M109.062588. [DOI] [PMC free article] [PubMed] [Google Scholar]
- 17.Lehnertz B, et al. The methyltransferase G9a regulates HoxA9-dependent transcription in AML. Genes Dev. 2014;28(4):317–327. doi: 10.1101/gad.236794.113. [DOI] [PMC free article] [PubMed] [Google Scholar]
- 18.Wu H, et al. Structural biology of human H3K9 methyltransferases. PLoS One. 2010;5(1):e8570. doi: 10.1371/journal.pone.0008570. [DOI] [PMC free article] [PubMed] [Google Scholar]
- 19.Kubicek S, et al. Reversal of H3K9me2 by a small-molecule inhibitor for the G9a histone methyltransferase. Mol Cell. 2007;25(3):473–481. doi: 10.1016/j.molcel.2007.01.017. [DOI] [PubMed] [Google Scholar]
- 20.Lin Y, et al. Detecting S-adenosyl-L-methionine-induced conformational change of a histone methyltransferase using a homogeneous time-resolved fluorescence-based binding assay. Anal Biochem. 2012;423(1):171–177. doi: 10.1016/j.ab.2012.01.019. [DOI] [PubMed] [Google Scholar]
- 21.Sweis RF, et al. Discovery and development of potent and selective inhibitors of histone methyltransferase g9a. ACS Med Chem Lett. 2014;5(2):205–209. doi: 10.1021/ml400496h. [DOI] [PMC free article] [PubMed] [Google Scholar]
- 22.Barsyte-Lovejoy D, et al. (R)-PFI-2 is a potent and selective inhibitor of SETD7 methyltransferase activity in cells. Proc Natl Acad Sci USA. 2014;111(35):12853–12858. doi: 10.1073/pnas.1407358111. [DOI] [PMC free article] [PubMed] [Google Scholar]
- 23.Rathert P, et al. Protein lysine methyltransferase G9a acts on non-histone targets. Nat Chem Biol. 2008;4(6):344–346. doi: 10.1038/nchembio.88. [DOI] [PMC free article] [PubMed] [Google Scholar]
- 24.Wu G, et al. St. Jude Children’s Research Hospital–Washington University Pediatric Cancer Genome Project Somatic histone H3 alterations in pediatric diffuse intrinsic pontine gliomas and non-brainstem glioblastomas. Nat Genet. 2012;44(3):251–253. doi: 10.1038/ng.1102. [DOI] [PMC free article] [PubMed] [Google Scholar]
- 25.Jiao L, Liu X. Structural basis of histone H3K27 trimethylation by an active polycomb repressive complex 2. Science. 2015;350(6258):aac4383. doi: 10.1126/science.aac4383. [DOI] [PMC free article] [PubMed] [Google Scholar]
- 26.Lewis PW, Allis CD. Poisoning the “histone code” in pediatric gliomagenesis. Cell Cycle. 2013;12(20):3241–3242. doi: 10.4161/cc.26356. [DOI] [PMC free article] [PubMed] [Google Scholar]


